Current federal debt, recent change, debt per person, and source methodology using official U.S. Treasury data.
Updated March 19, 2026 · Official U.S. Treasury data
What is the US Debt Clock?Compare presidentsExplore debt historyDownload datasetsRead the methodologyYour Share: $118,562
↑ increasing by $17.19/day
Algorithmically projected from latest Treasury data
(Treasury data is periodically updated)
| Dec 29 | $38.386T | +$5.8B |
| Dec 26 | $38.381T | +$27.7B |
| Dec 24 | $38.353T | -$22.5B |
| Dec 23 | $38.375T | -$3.1B |
| Dec 22 | $38.378T | +$5.5B |
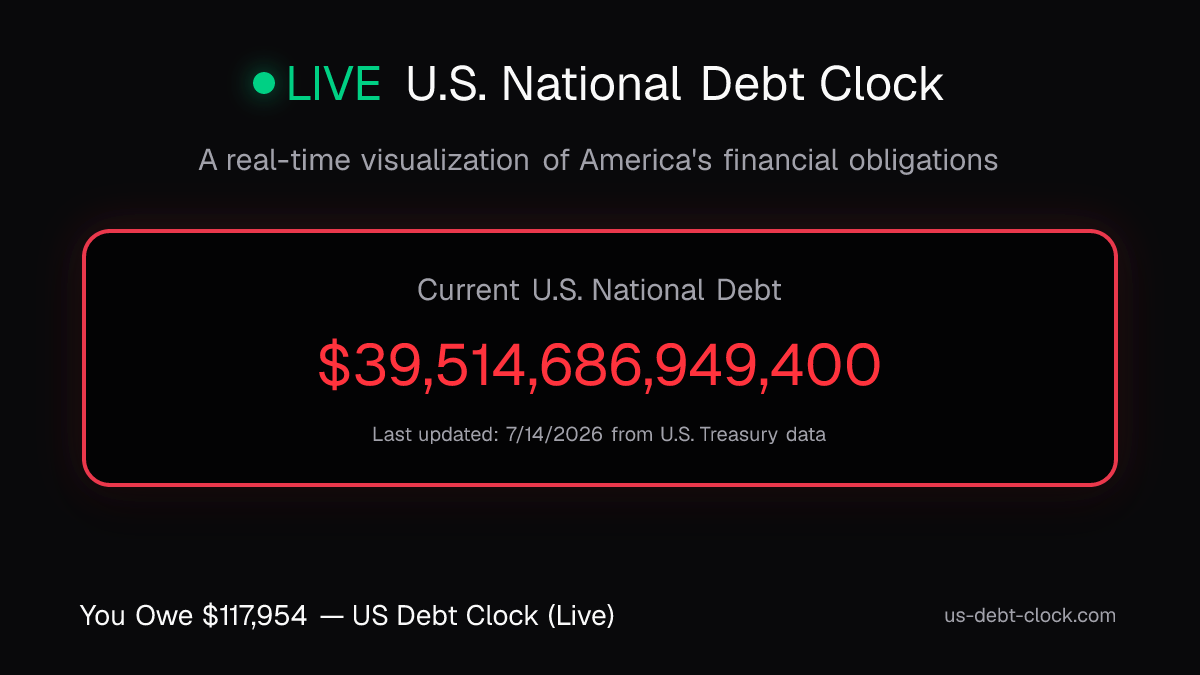
The current U.S. national debt is $39.72 Trillion as of July 4, 2026, according to the latest data from the U.S. Treasury Department. This US debt live counter equals approximately $118,562 per U.S. citizen. The debt increases by roughly $1 trillion every 750 days and grows at approximately $1.3 billion per day, making this national debt clock live view a real-time snapshot of America's borrowing. Source: U.S. Treasury Fiscal Data.
How this clock is calculated
The official total comes from the U.S. Treasury's Debt to the Penny dataset. Between Treasury records, the display projects the latest observed daily change and labels estimated values. Latest source date: 2026-03-19.
$118,562
Every American's share
$283,703
Each taxpayer's share
$5.0B
Today's estimated debt increase
$3.6B
Daily interest cost on the debt
Free daily briefing. No spam. Unsubscribe anytime.
California's unfunded pension liabilities add another $95 billion on top of its $145 billion in state debt.
Free Daily Briefing
The debt grows ~$83K every second — are you keeping up?
Join thousands of readers who get the numbers that matter before markets open. No spam, unsubscribe anytime.
Press & Mentions
Shared by lawmakers, educators, and citizens tracking the national debt.