

Welcome to the first installment of our series on AI-assisted browser bug hunting and exploit development. We will walk you through a Google Chrome exploit chain, from the V8 JavaScript engine in the renderer to the GPU process. We demonstrate the full chain on Windows, and for the GPU compromise we also show a novel technique on Linux, where the mitigations are tougher to defeat.
The exploit chain, comprising 5 vulnerabilities, took 3 months of part-time effort to go from initial discovery to complete exploitation. We found the first bug in March 2026, started working on this chain in April, and had a reliable exploit by the first week of June. We used a mixture of tools (Gemini, Claude, and Codex) to complete the majority of the work, and collected a total of US$117,000 in the Chrome Vulnerability Reward Program.
AI carried a large share of this work, and it accelerated nearly every stage, from fine-tuning a heap spray to applying a math lemma to recover memory bytes. At one point we were stuck beating ASLR in the GPU process. We could read memory, but it came back to us as float coordinates rendered as pixels. We didn't know how to convert those pixels back to raw bytes, until Claude pointed us to Sterbenz's lemma, which makes the subtraction in our refinement loop exact and recovers bytes losslessly. It certainly helps when your collaborator has most of human knowledge on call.
Even so, our human researchers stayed in the driver's seat, steering the tools and making the calls that mattered. Neither side could have done this alone. The AI needed experienced hands to aim it and check its work, and the researchers needed the AI both to cover ground that would otherwise have taken far longer and, at times, to connect a dot that lay outside their own expertise, like the lemma above.
We grew up watching "Journey to the West": the Monkey King escorting the monk Xuanzang from Tang China to India to fetch the Buddhist scriptures, clearing 81 tribulations along the way. Breaking a modern browser is its own road West. The scripture waiting at the end is code execution deep inside Chrome, and each vulnerability in the chain is one more tribulation between us and it.
AI lent us something like the Monkey King's own magic, the somersault cloud that crosses in a single leap ground that once took us days on foot, and the 72 transformations that slip past obstacles brute force alone could not. So consider this series our pilgrimage, and Episode I begins with the Maglev King: a bug in V8's Maglev compiler.
Here is what the chain looks like in action:
You'll get the most out of this series by following along in the testing environment below:
Windows 11 x64 Build 26200.8457
V8 version 14.6.202.33, commit
f09a91282a26caa91d016c962d785d852cfdec36
You can find the PoCs in poc/. To follow along, you'll want a build of d8 (the V8 developer shell) at the pinned commit above; the README.md covers building d8 and running each PoC.
We also assume some basic knowledge of browser exploitation. If that's new to you, LiveOverflow's browser exploitation series is a good starting point. Samuel Groß's Phrack article Attacking JavaScript Engines and his JITSploitation series on Project Zero are seminal work in this space. We also recently invited Sam to give a talk on the state of browser exploitation.
Although not necessary, we recommend feeding our articles to your favourite AI agent and asking it anything you might find unclear. As noted in our Coruna blog post, AI is the best teacher one can find these days.
We started doing this for fun, as a way to measure how far our capabilities can be accelerated with the help of AI, and we have no financial motivations behind this effort. The results came out spectacular in terms of how fast we achieved it:
The first vulnerability in the GPU process was found at the beginning of March 2026. About 1 month later, the remaining vulnerabilities were found in the V8 engine.
We finished the exploits for the renderer vulnerabilities within 2 weeks of their discovery and reported them to Google.
At the beginning of May 2026, we completed the exploit chain demonstration for Windows. Reliability fell short of expectations, so we spent a couple more weeks tuning the exploit on and off, reaching ~100% afterward.
All of this was accomplished by a team of 3 part-time members. The researcher who found all those bugs, Quang Luong, had virtually no background in browser research before this run. In the past, the same effort by top offensive security firms would have taken from half to a full year, from initial discovery to a reliable exploit, and they basically worked full-time. From a pure impact standpoint, this acceleration means vendors would have to adapt just as fast as threat actors; disclosure policies and security fix deadlines would never be the same again.
This research is driven by the belief that open-source knowledge helps the community grow, similar to open-source software. In the past few years, such in-depth research was limited to an "elite circle", making it hard for beginners (and "outsiders") to access. Since early V8 exploits (2017-2018), novel research has declined due to financial and scarcity incentives to keep it private. This has created barriers for new researchers, so fewer novel vulnerability classes and exploitation techniques get disclosed, and security improvements arrive late. Much public research is outdated by the time it appears at conferences, and modern exploits evolve rapidly, leaving fundamentals behind. While determined hackers can still find their way, Chromium's security and fast patch-release cycle show that the open-source model works. It’s increasingly likely that vulnerabilities discovered and exploited by LLMs are also publicly known, which changes where cybersecurity threats come from.
How did we use AI here? Our guiding principle is that the human is the captain and the AI is the steering wheel. AI shines at repetitive procedural work, while reasoning and verification still need human hands.

We often had to fight the steering wheel like the Captain above. This was not "Claude exploit Chrome full chain, make no mistake"; we tried to be the major origin of ideas, direction, and verification. AI is indisputably better at holding a lot of things in working memory thanks to its large context window, giving it some big-brain moments (such as the aforementioned application of Sterbenz's lemma), though we did observe it struggle at times. Here are the times we took the W(in) and when Claude, Codex, and Gemini did:
Human W: The decisive factor in discovering these vulnerabilities, especially the GPU ones found with Gemini, was in how we choose the information to feed into AI. We did this without any agentic action. We essentially told AI to give us a candidate shortlist of exploitable bugs, then we looked at it, talking back and forth to confirm or reject the candidates. This methodology was discussed by our team member Quang Luong at the recent Real World AI Security conference at Stanford University.
Human W: We tried leaving Claude to work on its own to port the exploit chain from the V8 interactive shell to the Chrome browser, where we could no longer use the
%TerminateExecutionbuilt-in as a realistic trigger for the JSPI bug. To our surprise, it never discovered the faking of this internal exception despite trying many strategies. We gave it a single nudge: “Fake Terminate Exception object”, and it figured it out immediately.AI W: A big part of this exploit chain is spraying to reclaim the stale memory and shaping the heap to our advantage. If you have ever exploited these kinds of vulnerabilities in browsers, you know how fragile it can be at times. We didn't do it manually; Claude and Codex did it for us with very little guidance. We only specified how reliable we wanted the exploit to be, and when they finished, we tested it to confirm the claimed reliability. In addition, to avoid unknowingly triggering garbage collection and messing up the heap layout during early primitives construction, they set up part of the exploit primitives in a “critical zone” where nothing must change to ensure heap stability. This is the kind of work that, given sufficient time and effort, we can still do it, but we felt like spending our time on other tasks than tuning exploits byte-by-byte.
There are a lot of takes in the security community that, in our opinion, fail to recognize the full picture in such efforts: they either believe that AI has reached the point where it can effortlessly perform this end-to-end with a 100% success rate all the time, or that it is nowhere near human capabilities. From our experience over the past few months working on this, we believe the reality and the future lie somewhere in between: the strongest, most capable researchers will be the ones who know how to drive powerful AI in the right way and in the right direction, and sometimes get crazy ideas from it.
This may be a hard pill to swallow for some people who feel like things they have spent years studying and doing can suddenly be done somewhat effortlessly. As humans, we have had those feelings too. However, this is exactly why we started this project: to find out where humans stand in this ever-changing wave by looking at the full picture. As of right now, we’ve observed that most repetitive procedural work and simple, localized reasoning work are what LLMs and AI agents excel at. Those are the kinds of work that, given sufficient human time, attention, and a willingness to overcome boredom, can be accomplished without AI, as they have been for years. For example:
Tracing the data flow of a variable within a function and nearby functions
Renaming variables and functions, creating structures in reverse engineering work
Repeatedly tuning heap spray parameters in exploits
On the contrary, there are kinds of work where we still have an edge compared to AI:
Choosing which information to give attention to, which is crucial, given the large but still limited context window of LLMs.
Case-by-case insight into the exploit development process, which can only be built by exposure and experience.
Long reasoning chain across many abstraction layers.
Of course, it isn’t always a clear split. In the end, it all comes down to what we, as human beings, want to achieve. There isn’t an obvious difference between an all-human and an all-AI bug discovery or exploit, and the line is getting harder to tell day by day. Do you want to train to become the master of the craft yourself, or do you want to train to solely feel good about owning the products of the craft? This is where it makes a difference: a true master can tell good from bad (like telling gold from slop), and a sole feel-good owner can’t. We hate to be the bearer of bad (or just real) news, but it is what it is, so pick your poison.

And yes, this post (and series) is proudly brought to you by a human writer. We can let machines handle the technical work and fact-check us on grammar, typos, and technical details, but we believe there is value in communicating with each other as humans. So we are deeply grateful that you read it yourself.
To understand how attackers can compromise modern web browsers, we start with an example of the Chromium browser architecture, as illustrated below:
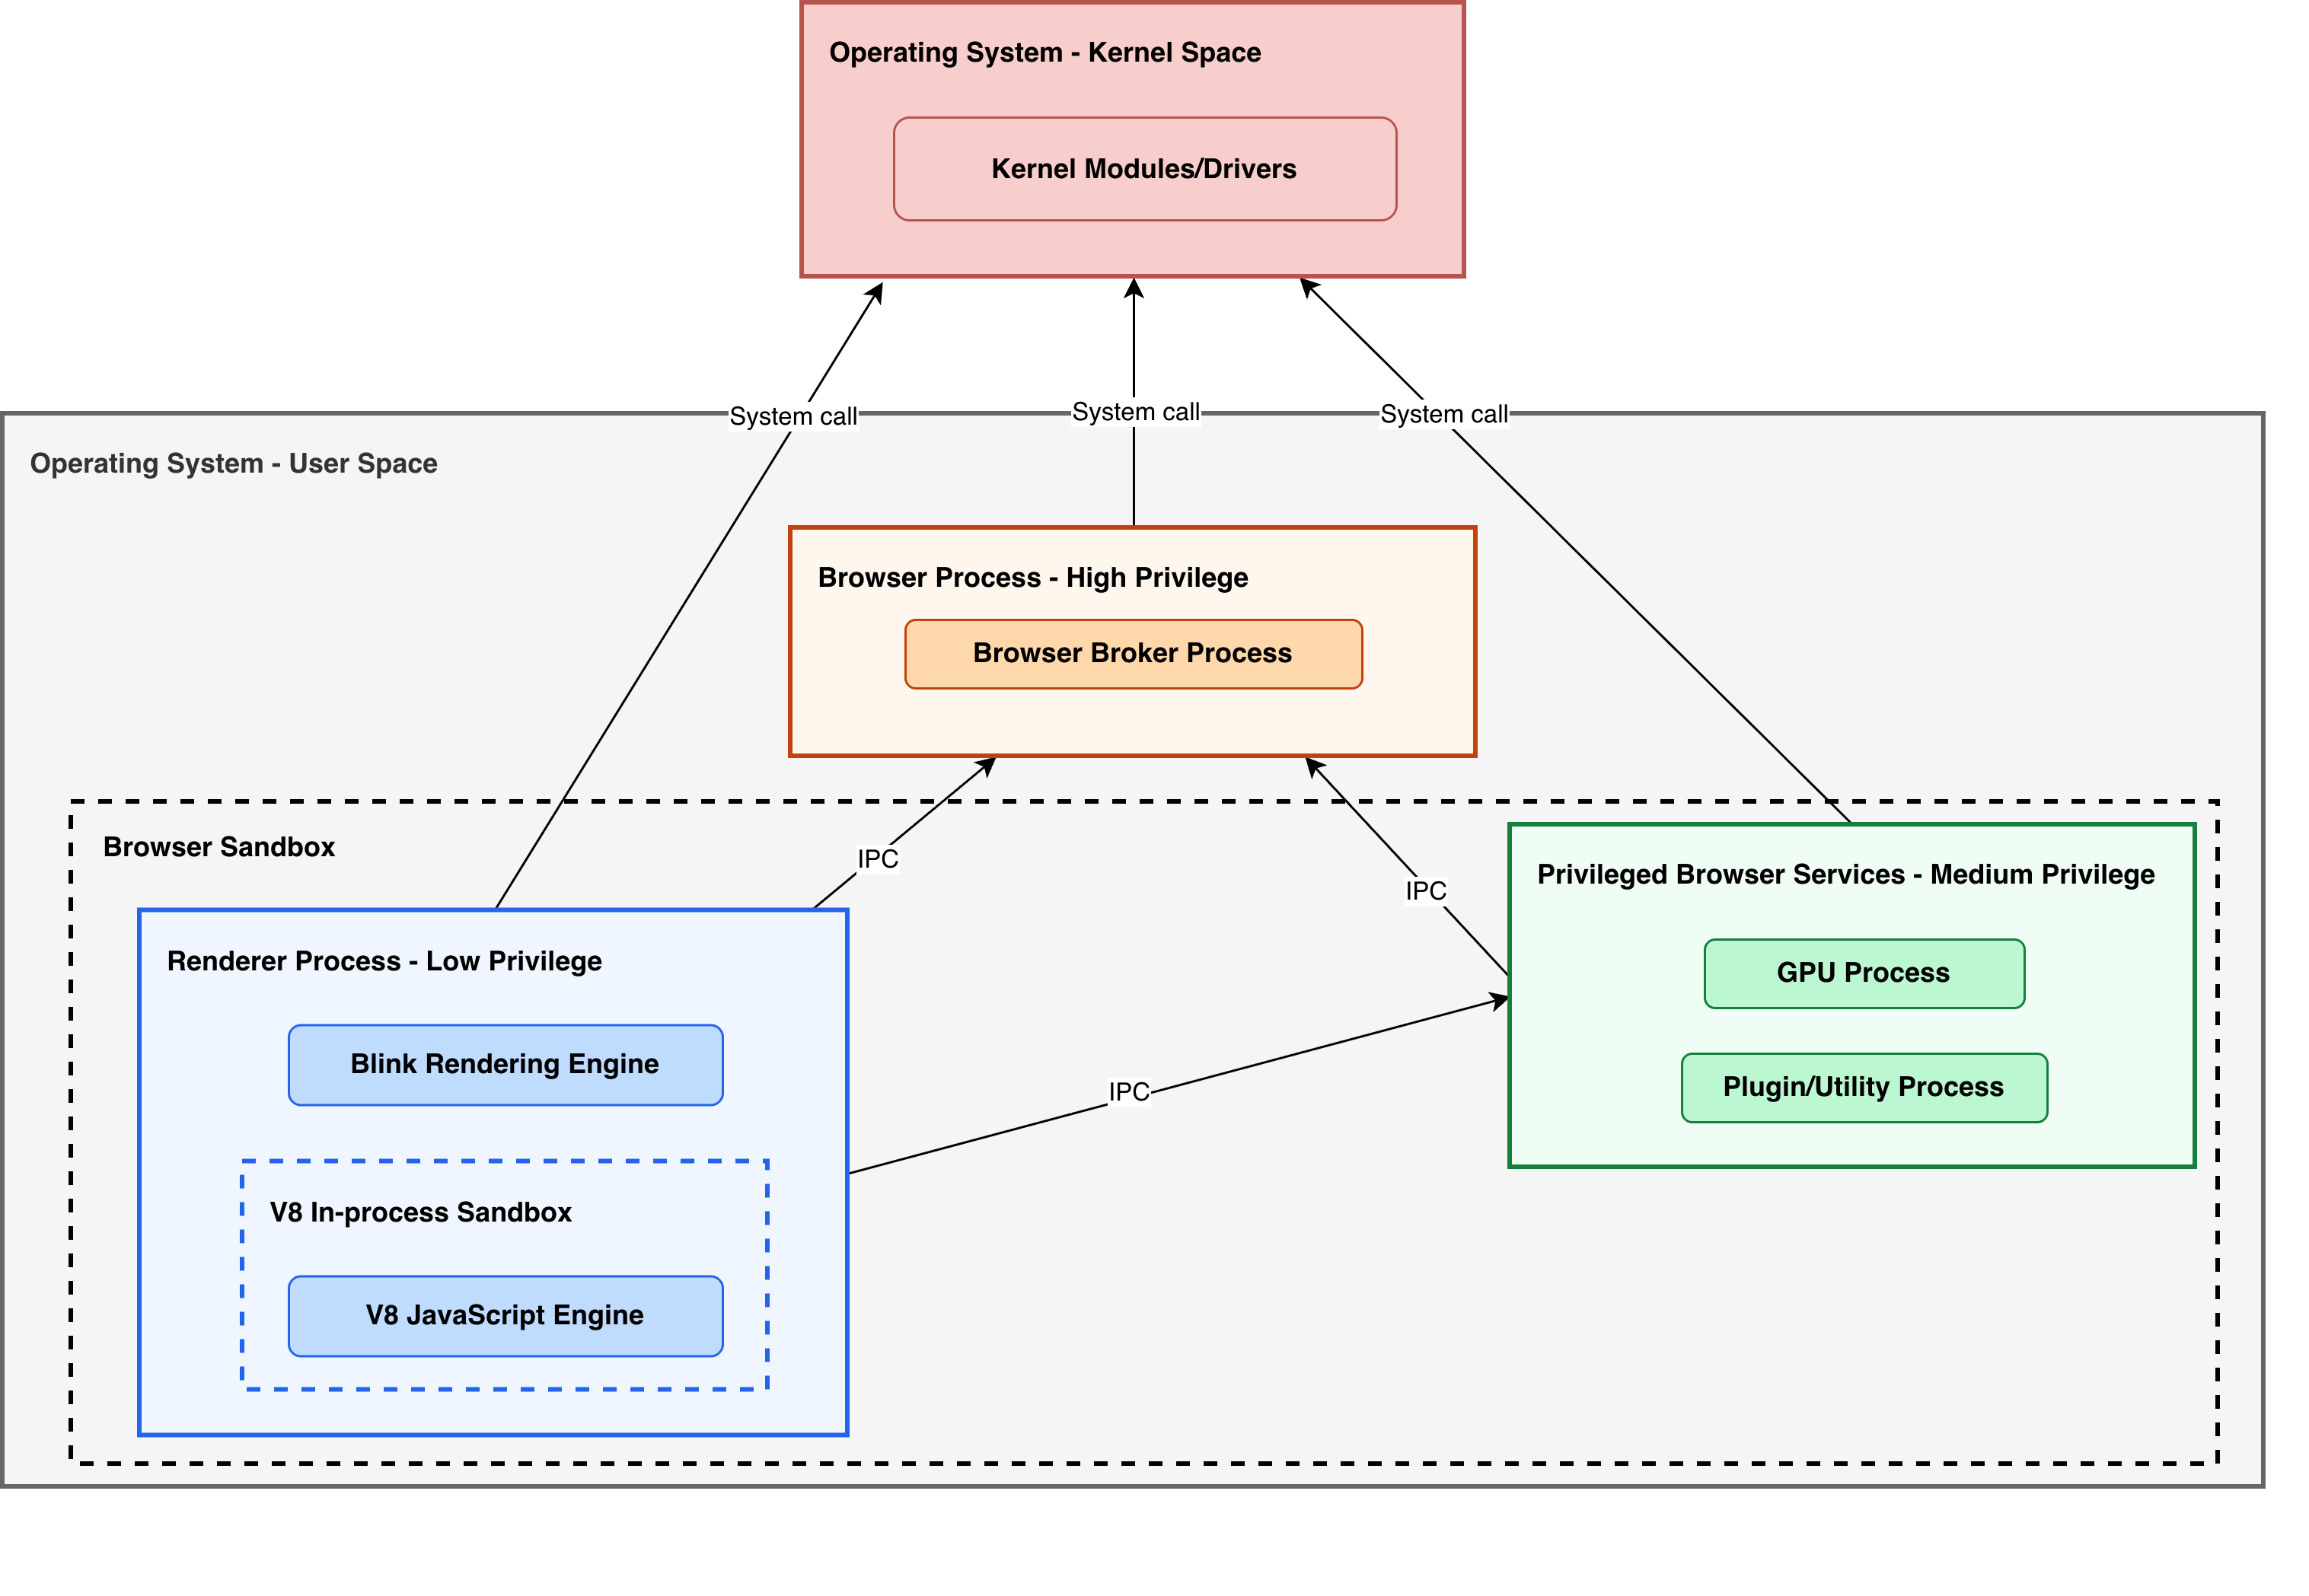
Chromium browser architecture (simplified)
As with most modern web browsers, Chromium employs a multi-process architecture with highly specialized processes and strict separation of privilege levels. The implementation varies slightly by operating system, but the idea is least privilege. Each process gets only what it needs for its job, so a compromised low-privilege process does not bring down the whole browser.
In a typical web browser usage scenario, web content, such as HTML/CSS/JS, is treated as untrusted data by the browser. The first thing a user interacts with in a browser session is the renderer process, which houses all that untrusted data. It is therefore reasonable to assume that the renderer is the most likely to be compromised first when attacking a web browser, and that it must be the most contained, with the least privileges, of all processes in the web browser process tree.
As shown in the model above, to compromise the entire web browser, one typically starts in the V8 JavaScript engine or the rendering engine, then either breaks the browser sandbox boundary by directly compromising the browser process or the underlying OS kernel, or takes a detour through more privileged but still restricted processes, such as the GPU process. Depending on the purpose of the exploit chain, the destination can be anywhere on the path from the renderer process to the OS kernel.
Our exploit chain consists of 2 parts: compromising the renderer and then the GPU process.
For the renderer compromise, we used 3 vulnerabilities: 1 in Maglev compiler optimizations for the initial caged primitives, 1 in JavaScript Promise Integration for V8 sandbox escape code execution, and 1 in
ExternalOneByteStringof a legacy feature for an information leak that facilitated the V8 sandbox escape.For the GPU component, we used 1 information leak and 1 for read/write/control primitive.
In this post, we will walk you through the renderer exploitation of this chain.
Here is a map of where we are headed: the chain breaks V8 to build its exploit primitives and ends in renderer code execution. Come back to this illustration if the details blur along the way.
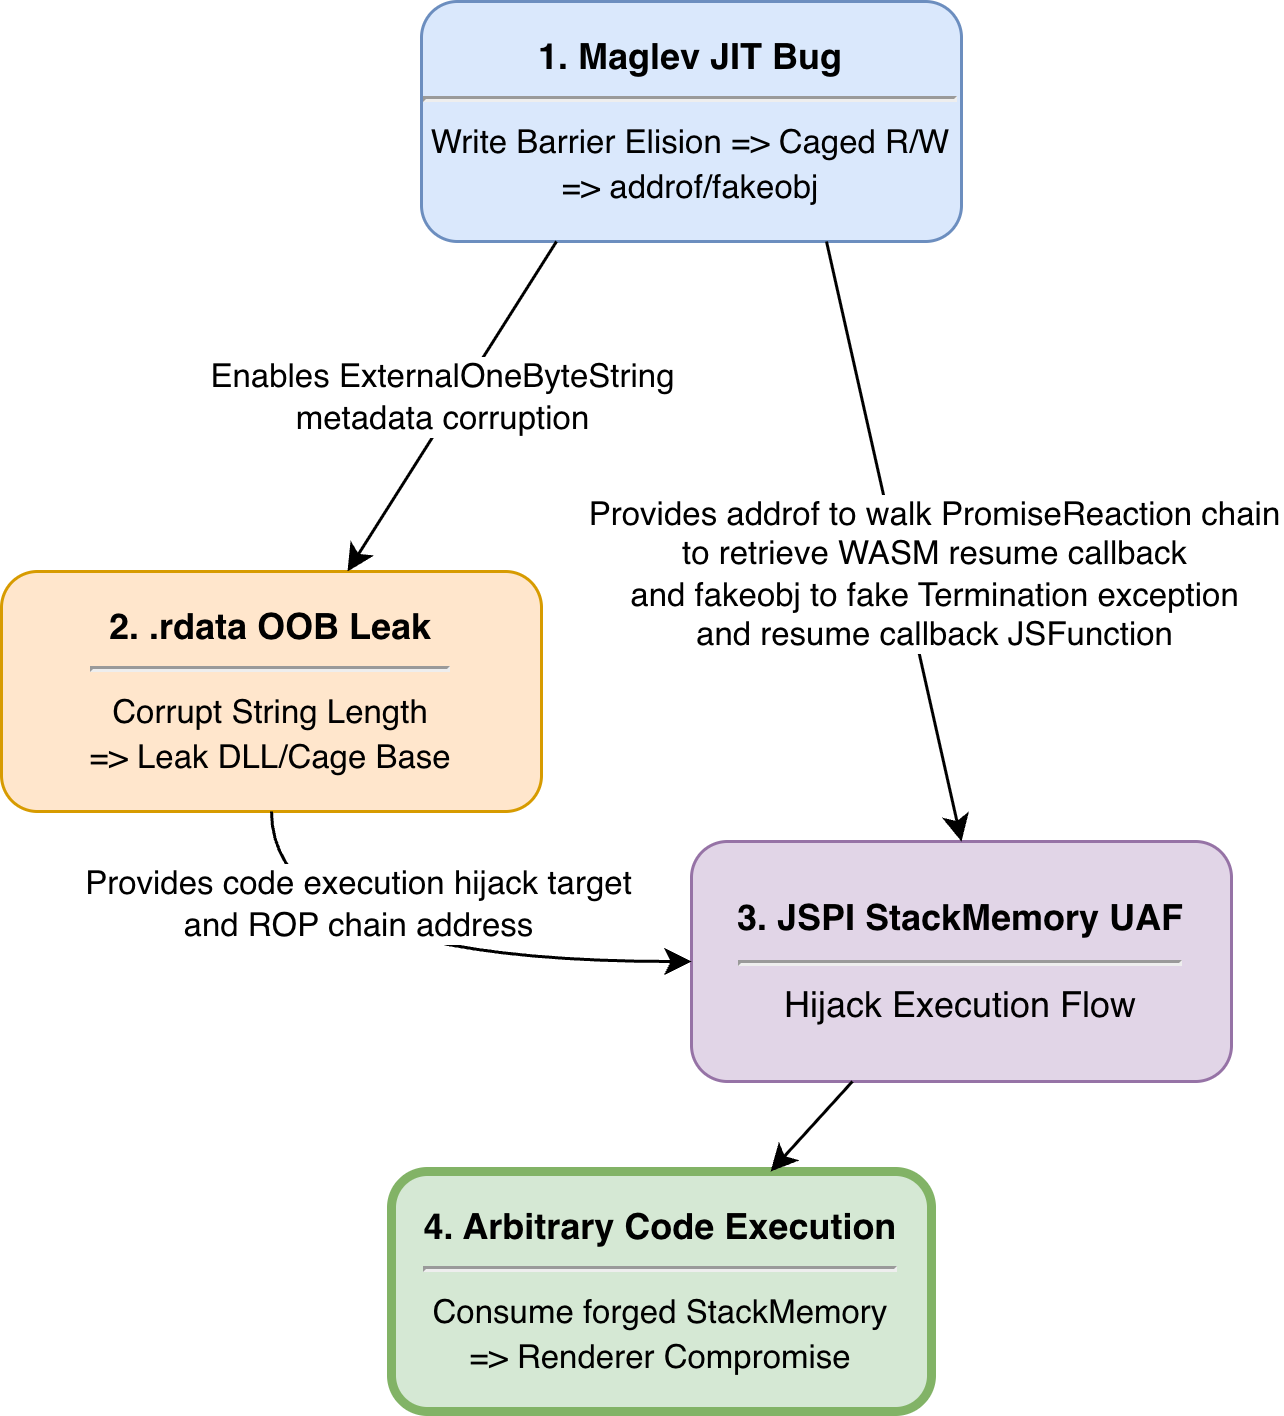
The exploit chain, from Maglev bug to renderer code execution
In our initial foothold, we exploited a representation-confusion bug in Maglev that led to incorrect write-barrier elision. We need to understand a few key concepts before diving in.
The V8 JavaScript engine uses a multi-tiered compilation pipeline to optimize JavaScript code into native machine code. Based on the “hotness” of the executed code, V8 decides how far in the pipeline the code will be optimized, using execution feedback. If the optimized code invalidates any previous assumptions derived from the feedback during runtime, it will be deoptimized back to the interpreted bytecode to ensure correctness.
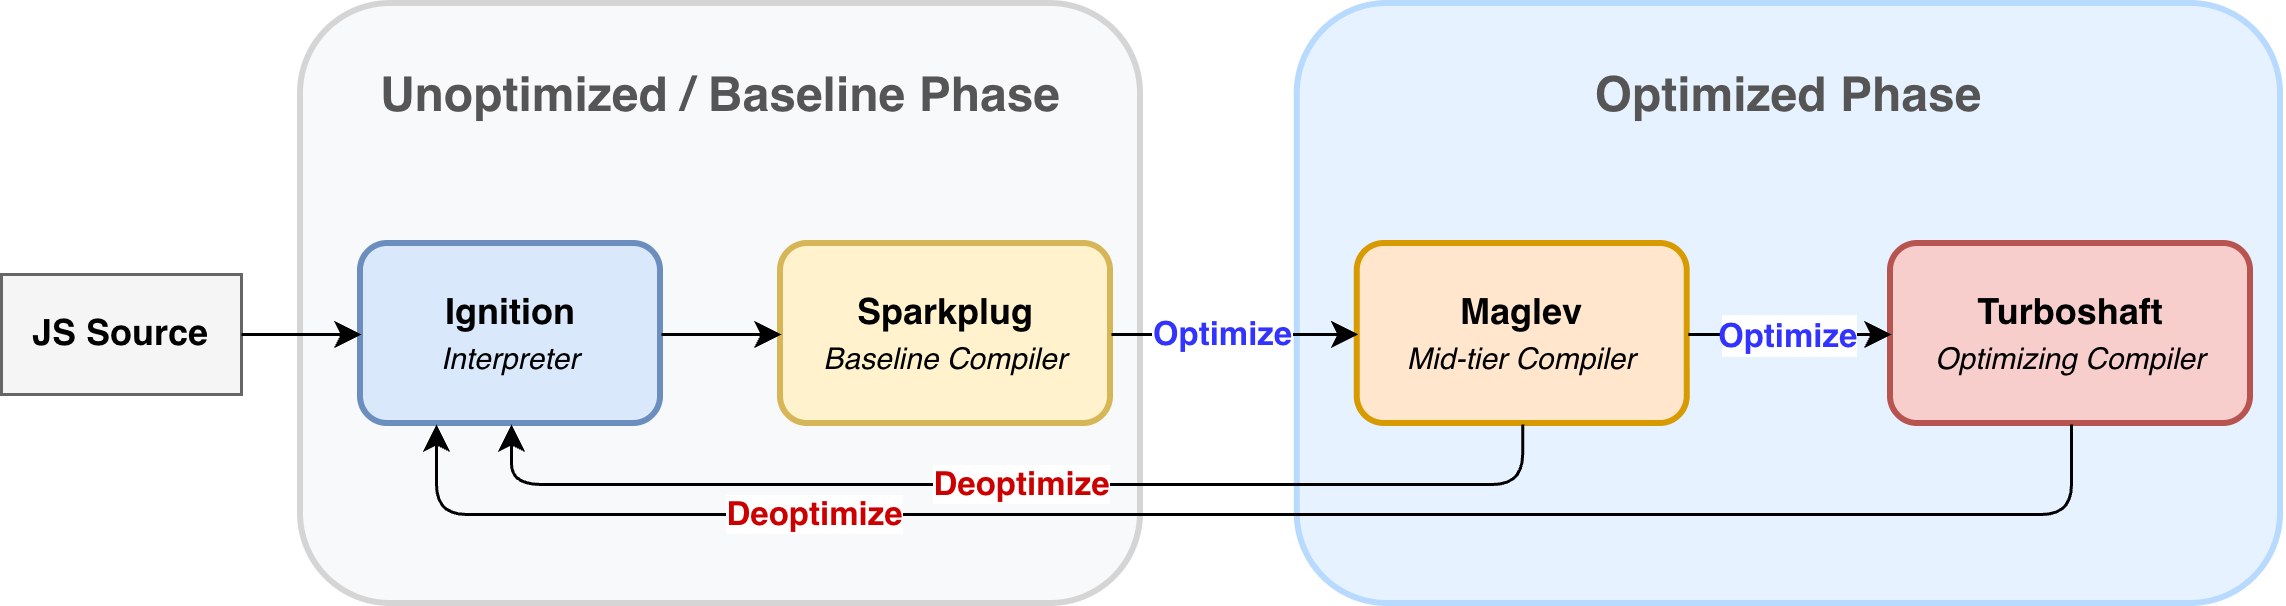
V8 JavaScript compilation and optimization pipeline
Each tier in this pipeline has its own intermediate representation (IR) of the program being operated on. For example, during the interpreter phase, the JS source code is interpreted into Ignition bytecode, while optimization compilers like Maglev and Turboshaft use a lower-level IR that is closer to native machine instructions.
Maglev is V8's mid-tier JIT optimization compiler, which operates on a Control-Flow Graph (CFG) representation of the program. Each node in this graph uses the Maglev IR and has known information attached, derived from execution feedback in earlier phases. Among this information, one important kind is type information. This is a major part of the optimization passes Maglev performs, since many optimizations rely on type assumptions to eliminate checks that are proven unnecessary. For example, say Maglev is trying to optimize the following JS function:
If, during the execution of this function prior to optimization, V8 has only seen integer values being passed to the function, it will compile it down to the following machine instructions:
As long as the parameters being passed to add remain integers, the machine will execute it correctly. However, if this is not the case, Maglev will need to perform additional runtime checks before treating the function's parameters as integers. We know that JavaScript is a dynamically-typed language, so it is technically possible to do things like “adding” strings together, or an integer to a string.
In Maglev, values and representations are two distinct but related concepts. A single value can have multiple representations, or "views". This is similar to how, in C programs, the same value in memory can be cast to different types and operated on differently. In the world of Maglev, there are 2 main value representations:
Untagged values, which are essentially machine-native types such as raw pointers, IEEE-754 floating-point numbers, and 32-bit integers.
Tagged values, which are V8 values encoded as
HeapObjects or Small Integers (Smi). Under Chrome's pointer compression, aSmiis a 31-bit signed integer,-2^30to2^30 - 1(about ±1 billion). AHeapObjectis the other case: a pointer (low bit set) to an object on the heap. Any number that doesn't fit aSmiis boxed as aHeapNumber.
The distinction is that untagged values use all the bits to represent the values themselves, while tagged values use the least significant bit to mark the value as an object or an integer.
Maglev doesn't read those bits to decide tagged versus untagged. A value's representation is a static property the compiler assigns to each node and tracks through the graph, so a wrong representation is dangerous: no bit in the word can catch it.
Regarding the one-value-multiple-representation relations, Maglev has a term called "alternative", implemented by the AlternativeNodes class. Alternatives of a node record the representations the compiler has already produced for that value, and they double as a cache: the first time a node is needed in some representation, Maglev emits the conversion and stores the result as that node's alternative, so later uses reuse it instead of converting again. Because the cache lives on the value node, a conversion emitted for one operation becomes a fact that any later use of the same value can pick up.
For example:
The first store needs x as an int32, so Maglev converts it and caches the result on x. Now x has two views, tagged and int32, and the second store reuses the cached int32 instead of converting x again.
Additional reading: Maglev - V8’s Fastest Optimizing JIT
The V8 JS engine uses a generational garbage collector (GC), in which allocations are divided into spaces based on how many times they survive a garbage collection iteration: freshly allocated objects and objects surviving one GC reside in the Young Space, while objects surviving two or more GCs are evacuated and reside in the Old Space.
The GC process is divided into 2 subprocesses: the Minor GC, which collects only in the Young Space, and the Major GC, which collects the whole heap. The Minor GC runs much more frequently than the Major GC. This is based on the Generational Hypothesis, which states that most objects die young, so collecting only the young generation reclaims most of the garbage while staying cheap.
To collect, the GC must first identify which objects are still live. It does so by traversing the object graph, starting from a known set of live objects called the roots, and whatever it cannot reach is considered dead and freed. This traversal is expensive, so its scope, and therefore the set of roots, differs between Minor GC and Major GC.
This is where the Minor GC hits a problem. It only wants to scan the Young Space, but a young object can be kept alive by a pointer that lives in the Old Space.
If the Minor GC only looks inside the Young Space, it never sees that Old-to-Young pointer, wrongly concludes youngObj is dead, and frees it, leaving oldObj with a dangling reference. The obvious fix, scanning the Old Space to find such pointers, is exactly the whole-heap traversal a Major GC does, so it defeats the purpose of having a cheap Minor GC in the first place.
To solve this, V8 maintains remembered sets that record Old-to-Young references, and the Minor GC treats them as an additional set of roots. That way it learns about these references without scanning the Old Space.
The remembered sets have to be kept accurate, and this is where write barriers come in. In V8, they are pieces of code that run after a pointer store into a heap object and record the reference into the remembered sets if the store created an Old-to-Young pointer:
While this seems minor compared to traversing the whole heap, write barriers are still an expensive cost in optimized code, so Maglev (as well as other optimizing compilers) tries its best to skip them whenever they are proven unnecessary. A store of a Smi, for instance, never needs a barrier, because a Smi is not a pointer.
Security issues often arise when write barriers are incorrectly skipped, or in V8's terms, "elided". If a barrier that was actually needed is elided, the Old-to-Young pointer never makes it into the remembered set. The Minor GC then frees a young object that is still referenced, leading to a use-after-free. This is precisely the class of bug that opens our exploit chain: an optimizer convinced a store is barrier-free when it is not.
Additional readings: Trash talk: the Orinoco garbage collector and Orinoco: young generation garbage collection
In JavaScript, where a variable is stored depends on how it is declared. A let and a var can produce different bytecode in V8. In particular, at the script's top-level:
A variable declared with the
varkeyword becomes a global property.A variable declared with the
letkeyword is stored in the script context.
At the top level, a var is literally a property of the globalThis object. In V8's terms, storing to a let goes through the ContextCell paths, while storing to a top-level var goes through the global property path backed by a PropertyCell.
When reviewing V8's source code, it is common to encounter type enums such as kConstant, kTagged, kSmi, and kInt32. The same names show up in two very different contexts, so it is easy to conflate them. The key is to keep straight which one describes the container (the variable) and which describes the contents (a single value):
Cell state describes the container. A
PropertyCell(backing a top-levelvar) or aContextCell(backing alet) is the storage slot for a variable, and its state records what the compiler has learned about that slot over time, across assignments. For example, aPropertyCellstate ofkConstantTypemeans the compiler expects future writes to this cell to keep being the same kind of value. The relevant enum classes areContextCell::StateandPropertyCellType.Value representation describes the contents. As mentioned above, a single value can be viewed in several ways, and a value representation is simply how the compiler views one value at a given moment, for example as a tagged
Smior as a raw untagged int32. The relevant enum class isValueRepresentation, which lists every representation a value can take.
The two meet when the compiler stores a value into a variable, and it helps to read that store as a handshake between a source and a destination:
The value representation is the source: it is where the compiler reads the value from, and it decides how the value gets extracted (say, pulling an int32 out of a node).
The cell state is the destination: it is the slot being written to, and it dictates what kind of value is legally allowed to land there.
So each store asks: "I have a value in this representation; is that legal to place into a cell in this state?" Getting that question wrong is exactly where the bug in the next section lives.
The bug is in MaglevGraphBuilder::BuildCheckSmi. At compile time, Maglev uses it to decide whether an optimized store needs a run-time CheckSmi, a guard that verifies a value really is a Smi (Small Integer). If it can prove the value is a valid Smi, it drops the guard. To reach that conclusion it has a shortcut for constants, and that shortcut is where the bug lives: it checks only whether a value's number fits Smi range and treats that as proof the value is a Smi. A HeapNumber holding a Smi-range value like 11.0 slips through, so Maglev treats a heap pointer as an integer and elides the write barrier on a store, breaking the GC's bookkeeping and opening a use-after-free.
Source: src/maglev/maglev-graph-builder.cc:4114
Lines 4129-4130 are the shortcut. This check is essentially saying:
If an int32 constant value can be extracted from this node, and this value falls into a valid Smi range (which is 31-bit integers), we don't need a runtime check for this node
A CheckSmi is meant to guarantee two things: that the value's type is actually Smi, and that its value fits in Smi range. This shortcut confirms only the range, via Smi::IsValid, and wrongly treats that as proof of the type.
The distinction matters because this is a compile-time decision about a run-time value. At compile time, Maglev sees a constant in Smi range and concludes the value is a Smi, so it removes the check. At run time, the value that actually arrives can be a HeapNumber: a heap object reached through a tagged pointer, which merely holds a Smi-range number like 11.0. It satisfies the range claim while failing the type, so it flows past with the Smi badge, and every later pass treats a live pointer as a plain integer.
This is dangerous at store time. Storing a real HeapObject normally requires a write barrier so the GC can track the reference, but Maglev now believes it stored a Smi and skips it.
The bug looks simple, but reaching a working trigger is not, at least not on the path we took. Keep in mind that our sole target here is to store a HeapNumber into an Old Space object with no CheckSmi and no write barrier.
The strategy. Maglev only elides the CheckSmi when it has, at compile time, convinced itself that the value being stored is a constant integer in Smi range. It comes together in three moves, one per section below:
Reach the buggy store
Skip the CheckSmi
Clear the check that's left
What follows is the real investigation behind that strategy: at each stage we try something, read the trace or the deoptimization it produces, and let what breaks point to the next move.
To start with, the bug results in an elided write barrier, which leads to UAF, so the first thing we need in the trigger is some sort of store operation on a supposedly HeapObject-turned-Smi.
The value that flows through BuildCheckSmi is x. For the bug to actually cause harm, four things have to line up at the store:
xlives in Young Space.The destination
vis a tagged field in Old Space, so eliding the write barrier lets the Minor GC freexwhile it's still referenced, leading to use-after-free.The stored value
xis aHeapObjectwhose number sits in Smi range, so it can be mistaken for aSmi.Maglev believes
xcan be aSmi(the Smi-valued warm-up gives it that), so the store takes the Smi-checking path whereBuildCheckSmilives.
Typically, we warm up the function to be optimized and provide hints to the compiler with specific type information. In our case, we want it to think x is a Smi, so we warm it up with a Smi value, and then, after it's optimized, we trigger the function with a HeapNumber parameter. So something along this line should trigger the bug:
As covered above, cT is a global var, so it is backed by a PropertyCell (a let would be a ContextCell), and the two take different store paths in Maglev. The store that reaches the buggy BuildCheckSmi is the PropertyCell one. cT's cell lives in Old Space, so the buggy store writes into a tagged value slot there, satisfying requirement (2).
cT also needs to be in a specific state: a cell that has held more than one value, but always of the same type. V8 calls this a kConstantType PropertyCell, and it's the state that sends the store to GetSmiValue → BuildCheckSmi. We set it up by declaring var cT = 0; then changing the value while keeping the type.
That type has to be Smi. If the cell's value were a HeapObject instead, the store would take a different branch and never reach the vulnerable BuildCheckSmi. And since a PropertyCell can only hold tagged values, initializing cT with a float or a non-Smi integer doesn't help: underneath, it's boxed as a HeapObject. You can watch this in %DebugPrint output:
n8: CheckSmi [n2] is emitted by BuildCheckSmi, so its presence means the store to cT reached the buggy function but didn't get the check elided. That CheckSmi still guards the barrier-free store at n10, so the naive PoC just deopts on the HeapNumber.
So why is the CheckSmi still there? In the trace, x is an Opcode::kInitialValue, a fresh parameter seen for the first time at the store to cT. To trigger the bug, TryGetInt32Constant has to extract an int32 constant from it, so let's see what it does:
Source: src/maglev/maglev-graph-builder.cc:4129 · src/maglev/maglev-reducer-inl.h:695
Walking that code with x: it matches none of the constant-opcode cases (lines 698-717), so it falls through to TryGetConstantAlternative, which looks for a constant alternative recorded on the node (recall: one node can carry several representations). None has been recorded on x yet, so TryGetInt32Constant returns nothing, the shortcut never fires, and BuildCheckSmi keeps the CheckSmi.
To get past this, we need to give Maglev a way to extract that int32 constant from x before the store. There are two ways to try:
Transform
xinto a constant node that Maglev can read an int32 from directly.Attach a constant alternative to
x, soTryGetConstantAlternativefinds one, without changingxitself.
The first option is awkward: keeping x a HeapObject all the way to the store while turning it into a constant node is hard, so we go with the second. From TryGetConstantAlternative above, what we need is a checked_value alternative on x that is a ConstantNode. A checked_value is a constant the compiler has proven the node equals, by emitting a runtime check for it (the CheckedSmiUntag guard we'll have to get past next), so optimized code may treat the node as that constant.
We need an operation that records a checked_value on x. Storing x into a kConst ContextCell does it. In JavaScript, that cell is a top-level let variable. To keep it kConst, we reuse its initial value during warm-up. Concretely, we add a let bT = 11 and store x into it before cT. Because bT starts at 11 and the warm-up passes 11 too, the cell stays kConst, and the bT = x store records 11 as x's checked_value. Now the cT = x store reaches BuildCheckSmi with an extractable constant, so it should drop the CheckSmi.
In full, the PoC is:
Running it and tracing deoptimization, the store to cT still fails:
The CheckSmi is gone, so planting the constant worked. But a new node took its place, n9: CheckedSmiUntag, and it deopts on the HeapNumber (reason: not a Smi). That's the check we clear next.
Because bT is kConst, the store bT = x first checks whether x equals bT's constant, and that check needs to convert x to a raw int32. The conversion Maglev picks, CheckedSmiUntag, produces one by untagging a Smi, which only works if x is physically a Smi, so the HeapNumber deopts. The fix is to steer Maglev to CheckedNumberToInt32 instead, which accepts any number and converts the HeapNumber without a deopt. Maglev uses it only under a precondition that has its own precondition, so we work backward through the chain until it reaches something we can set from JavaScript:
xmust have akInt32view before thebTstore, and that view is created only by storingxinto akInt32ContextCell.A
kInt32ContextCellexists only if we make one, by assigning it a number outside Smi range.
We handle these over the next two steps, then store x into that kInt32 cell before bT.
Step 1: give x a kInt32 view.
The conversion happens inside GetInt32, which first calls TryGetInt32 to reuse an int32 form x might already have:
Source: src/maglev/maglev-reducer-inl.h:603
But x is a fresh kTagged parameter, so all three checks fail: it isn't already an int32 (line 660), has no int32 constant (line 662), and has no kInt32 alternative (line 666). With nothing to reuse, GetInt32 falls back to the Smi untag. The fix is to give x a kInt32 alternative before the bT store: then TryGetInt32 returns it at line 666 and skips the untag (any kInt32 view will do, unlike the constant we planted for cT).
To create that view, GetInt32 itself has a branch that accepts a HeapNumber, the kTagged case:
Source: src/maglev/maglev-reducer-inl.h:603
It emits CheckedNumberToInt32 and saves the result as x's kInt32 alternative (set_int32), but only when can_be_heap_number is true. That flag is false by default; the only caller that sets it true is EnsureInt32, which runs when storing into a kInt32 ContextCell. So the fix is another let variable: let aT = ...; aT = x; before bT, where aT is a kInt32, which is the remaining obstacle.
Step 2: make a kInt32 ContextCell.
A cell reaches kInt32 through TransitionContextCellToUntagged; the other transitions require it to already be kInt32:
Source: src/objects/contexts.cc:501
Context::Set calls it when a kConst or kSmi cell is assigned a HeapNumber that fits in int32:
Source: src/objects/contexts.cc:544
So assigning an out-of-Smi-range number to a kConst or kSmi cell flips it to kInt32. That gives us the aT we need, and the full trigger becomes:
The trace confirms it: no CheckSmi, no CheckedSmiUntag, and the store to cT is n15: StoreTaggedFieldNoWriteBarrier writing n2 (our parameter x) with no barrier:
On a debug build, the missing write barrier is caught immediately:
Here's a summary of the trigger we built:
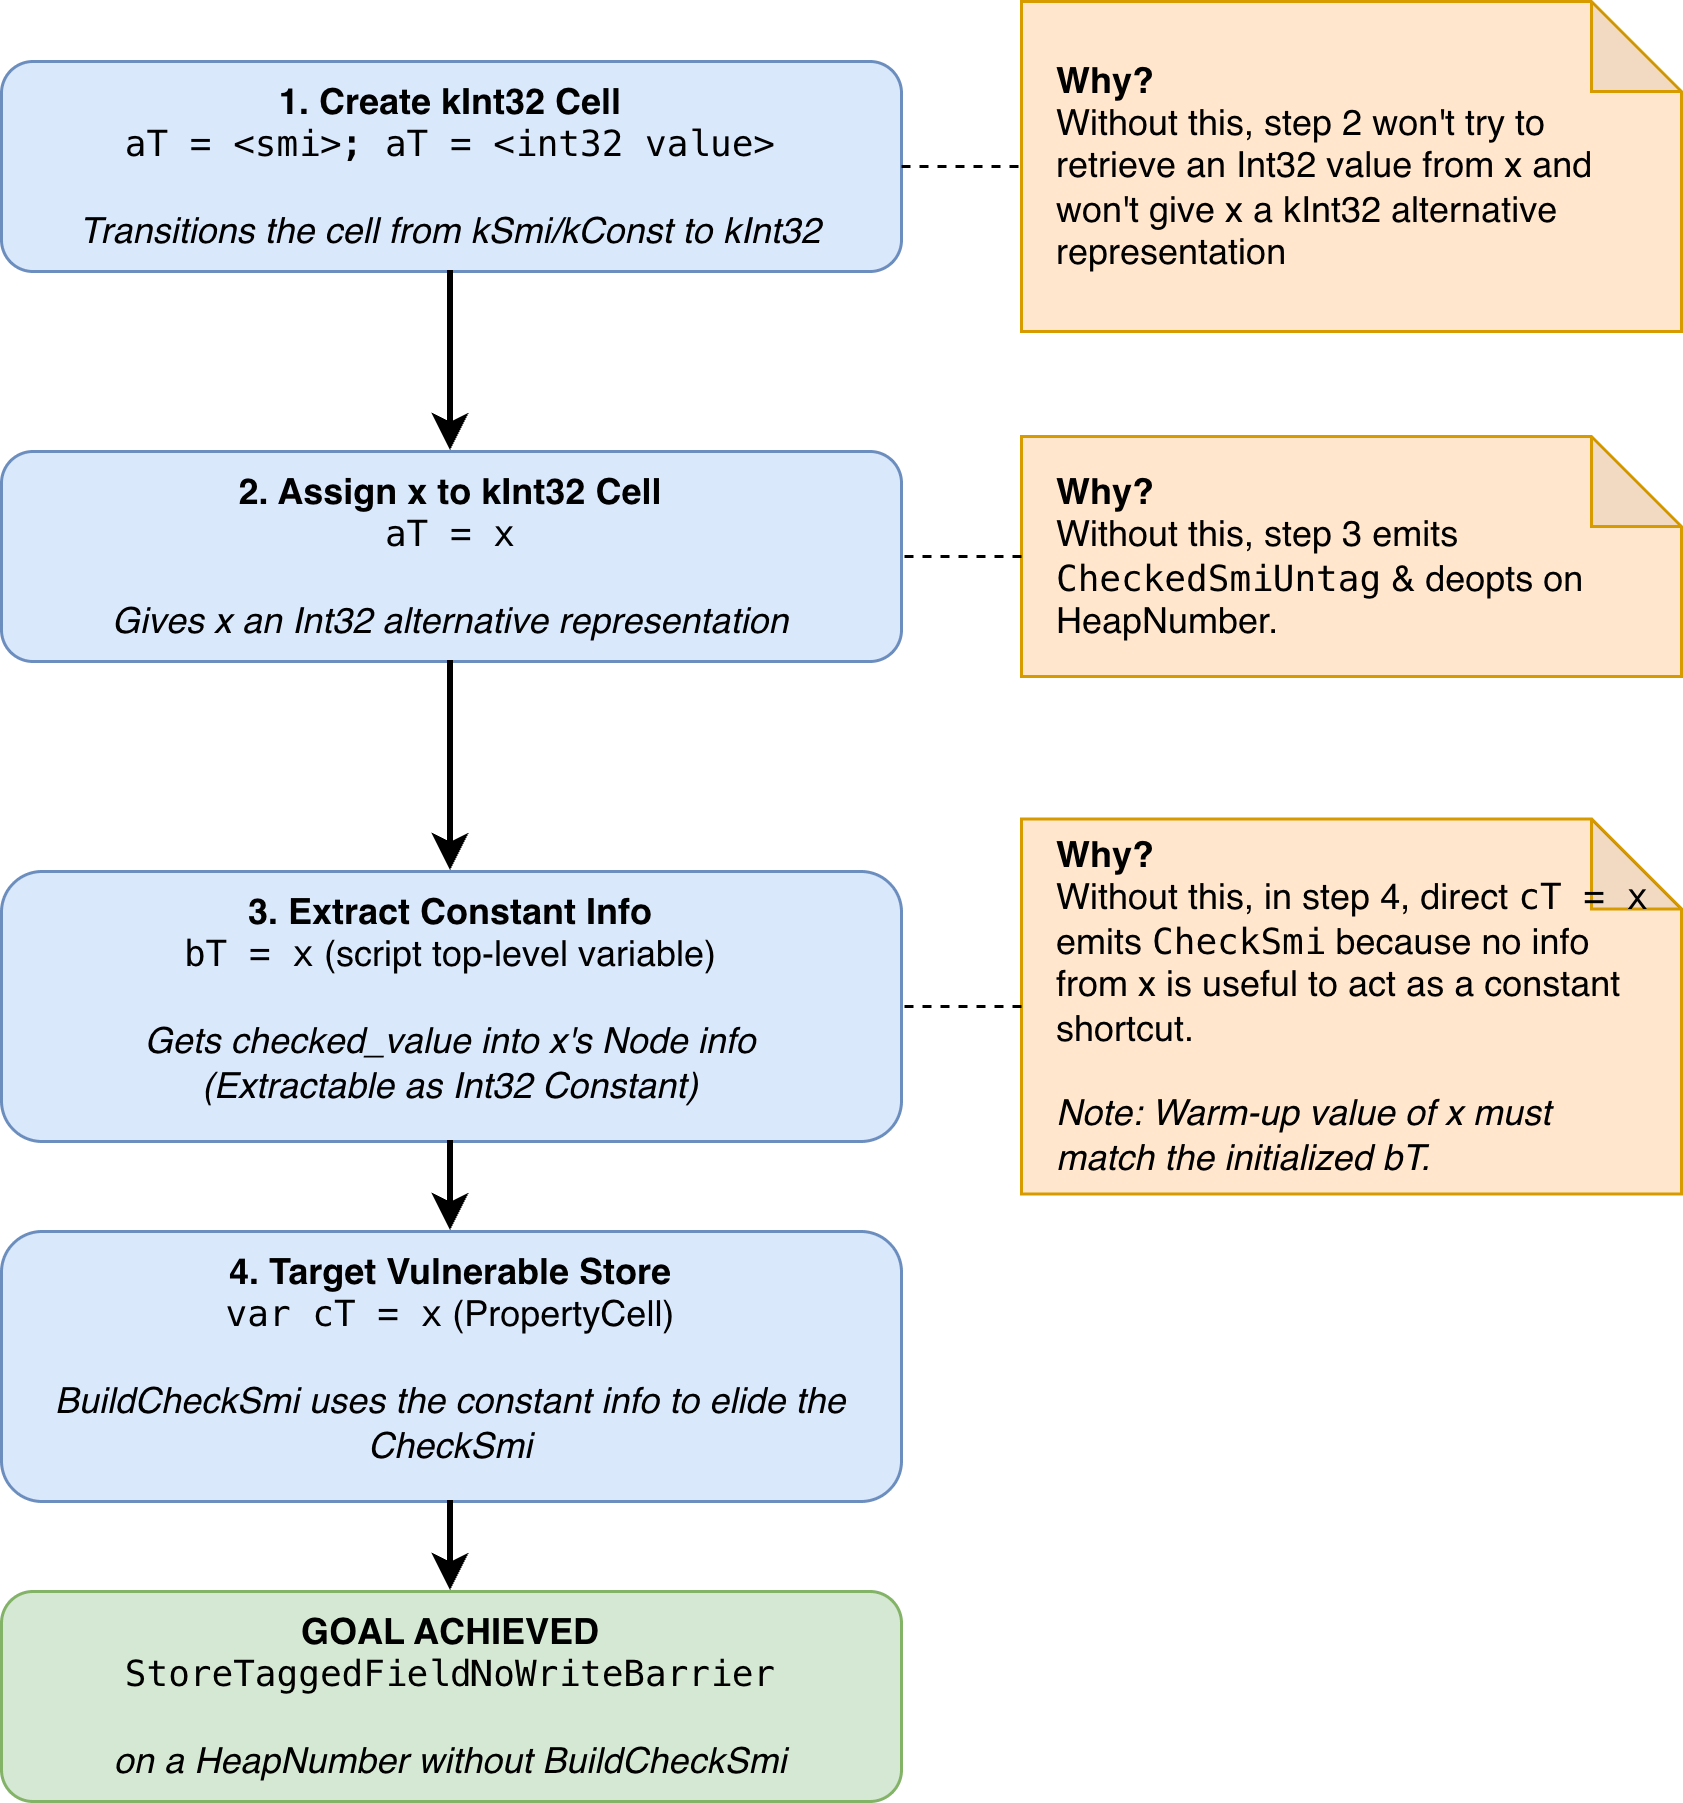
Step-by-step construction of the trigger
Before building on the trigger, it's worth spelling out what the elided barrier actually bought us. Our store put a young-space HeapNumber (the boxed f64src[0]) into cT, a PropertyCell that lives in Old Space, and skipped the write barrier that store needed. As the write-barrier section explained, that barrier is the only thing that would have recorded the new Old-to-Young pointer into the remembered set. With no record, the next Minor GC frees the still-referenced HeapNumber and reuses its memory, leaving cT holding a compressed pointer to memory V8 has already handed out. That stale pointer is the dangling reference the rest of Act I is built on.
From here the goal is to turn it into a small, reusable set of memory primitives that every later step of the chain stands on. All of this work stays inside the V8 cage, also called the V8 heap sandbox.
The V8 cage is designed to limit damage to the renderer process and the browser in the exact case we are working on here: memory corruption in JS HeapObjects. The V8 cage assumes that an attacker can freely corrupt V8 HeapObjects within a 1TB address space, yet cannot cause further damage outside it. It does so by translating pointer access to V8 HeapObjects from absolute addresses to relative addresses, using an offset from a fixed base address that is transparent to objects within this sandbox.
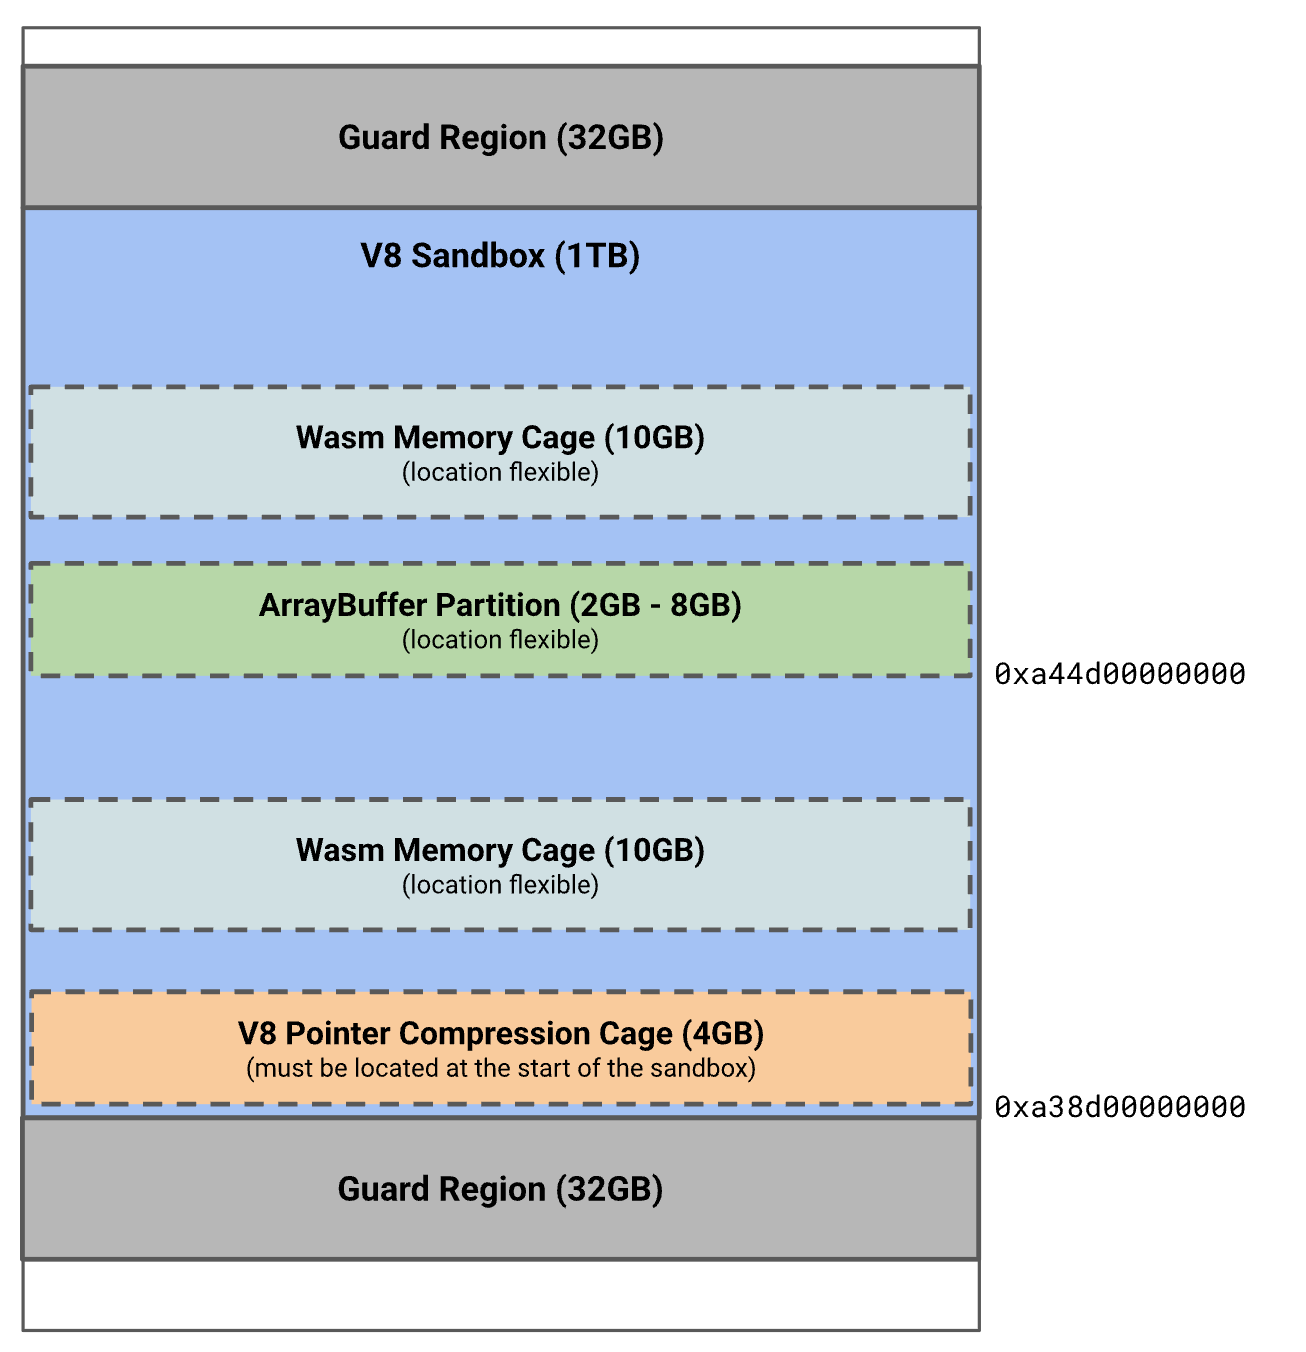
V8 heap sandbox address space
There are two slightly different addressing mechanisms, corresponding to two types of cages within this 1TB sandbox:
The V8 Pointer Compression Cage: Contains V8
HeapObjects such asJSArray,JSObject,String,HeapNumber, etc. It’s called “Pointer Compression” because V8 uses only 32-bit values to represent the addresses of theseHeapObjects, known as compressed pointers. This has existed since before the V8 heap sandbox came to life. The base address of this cage is the same as the start address of the V8 sandbox itself.Other Sandboxed Pointer Cages: These cages house WebAssembly memory and ArrayBuffer backing stores, which often contain raw bytes. Their addresses are sandboxed pointers because, even though they are 40-bit addresses, they are still accessed as offsets from fixed cage bases. The difference between this kind of cage and the V8 Pointer Compression Cage is that there can be multiple cages of this kind, starting at random addresses.
This matters to our exploitation plan because, as of right now, we can only work within the V8 Pointer Compression Cage using 32-bit addresses. Therefore, primitives achieved at this stage are often called caged primitives, such as caged read or caged write, implying 32-bit address read/write.
Building exploit primitives at this point is fairly straightforward. The goal is to ultimately have some, or at best all, of the primitives' holy grail: caged read, caged write, addrof, fakeobj.
The addrof/fakeobj pair at the center of that list goes back to Samuel Groß's Attacking JavaScript Engines, which introduced the duality we lean on here. A JavaScript number and an object reference are both just bits in a slot, and the engine tells them apart by the slot's declared type, not by inspecting the bits. Read a slot that holds a pointer as if it were a number and the raw address falls out, which is addrof. Write a number we picked into a slot the engine will later treat as a pointer and it follows us to an object of our making, which is fakeobj.
This is why the four primitives are not interchangeable. Caged read and write let us reach memory within the cage, but on their own they cannot tell us where a given JS object lives, nor hand us a usable reference to a forged one. addrof supplies the first by leaking the address of any object, and fakeobj supplies the second by turning an address back into an object the engine will operate on. Combined in the way Groß laid out, the two bootstrap a clean arbitrary read/write: fake a JSArray whose backing store pointer you control, point it anywhere, and reading or writing its elements reads or writes that memory. That fully controlled read/write is the product we are after in Act I. Act II is where we spend it to get to code execution.
The dangling HeapObject reference through cT gives us a two-way view into the same underlying memory, so we can obtain a valid JS Object reference through cT while manipulating the internal representation of this HeapObject to turn it into virtually whatever we can forge.
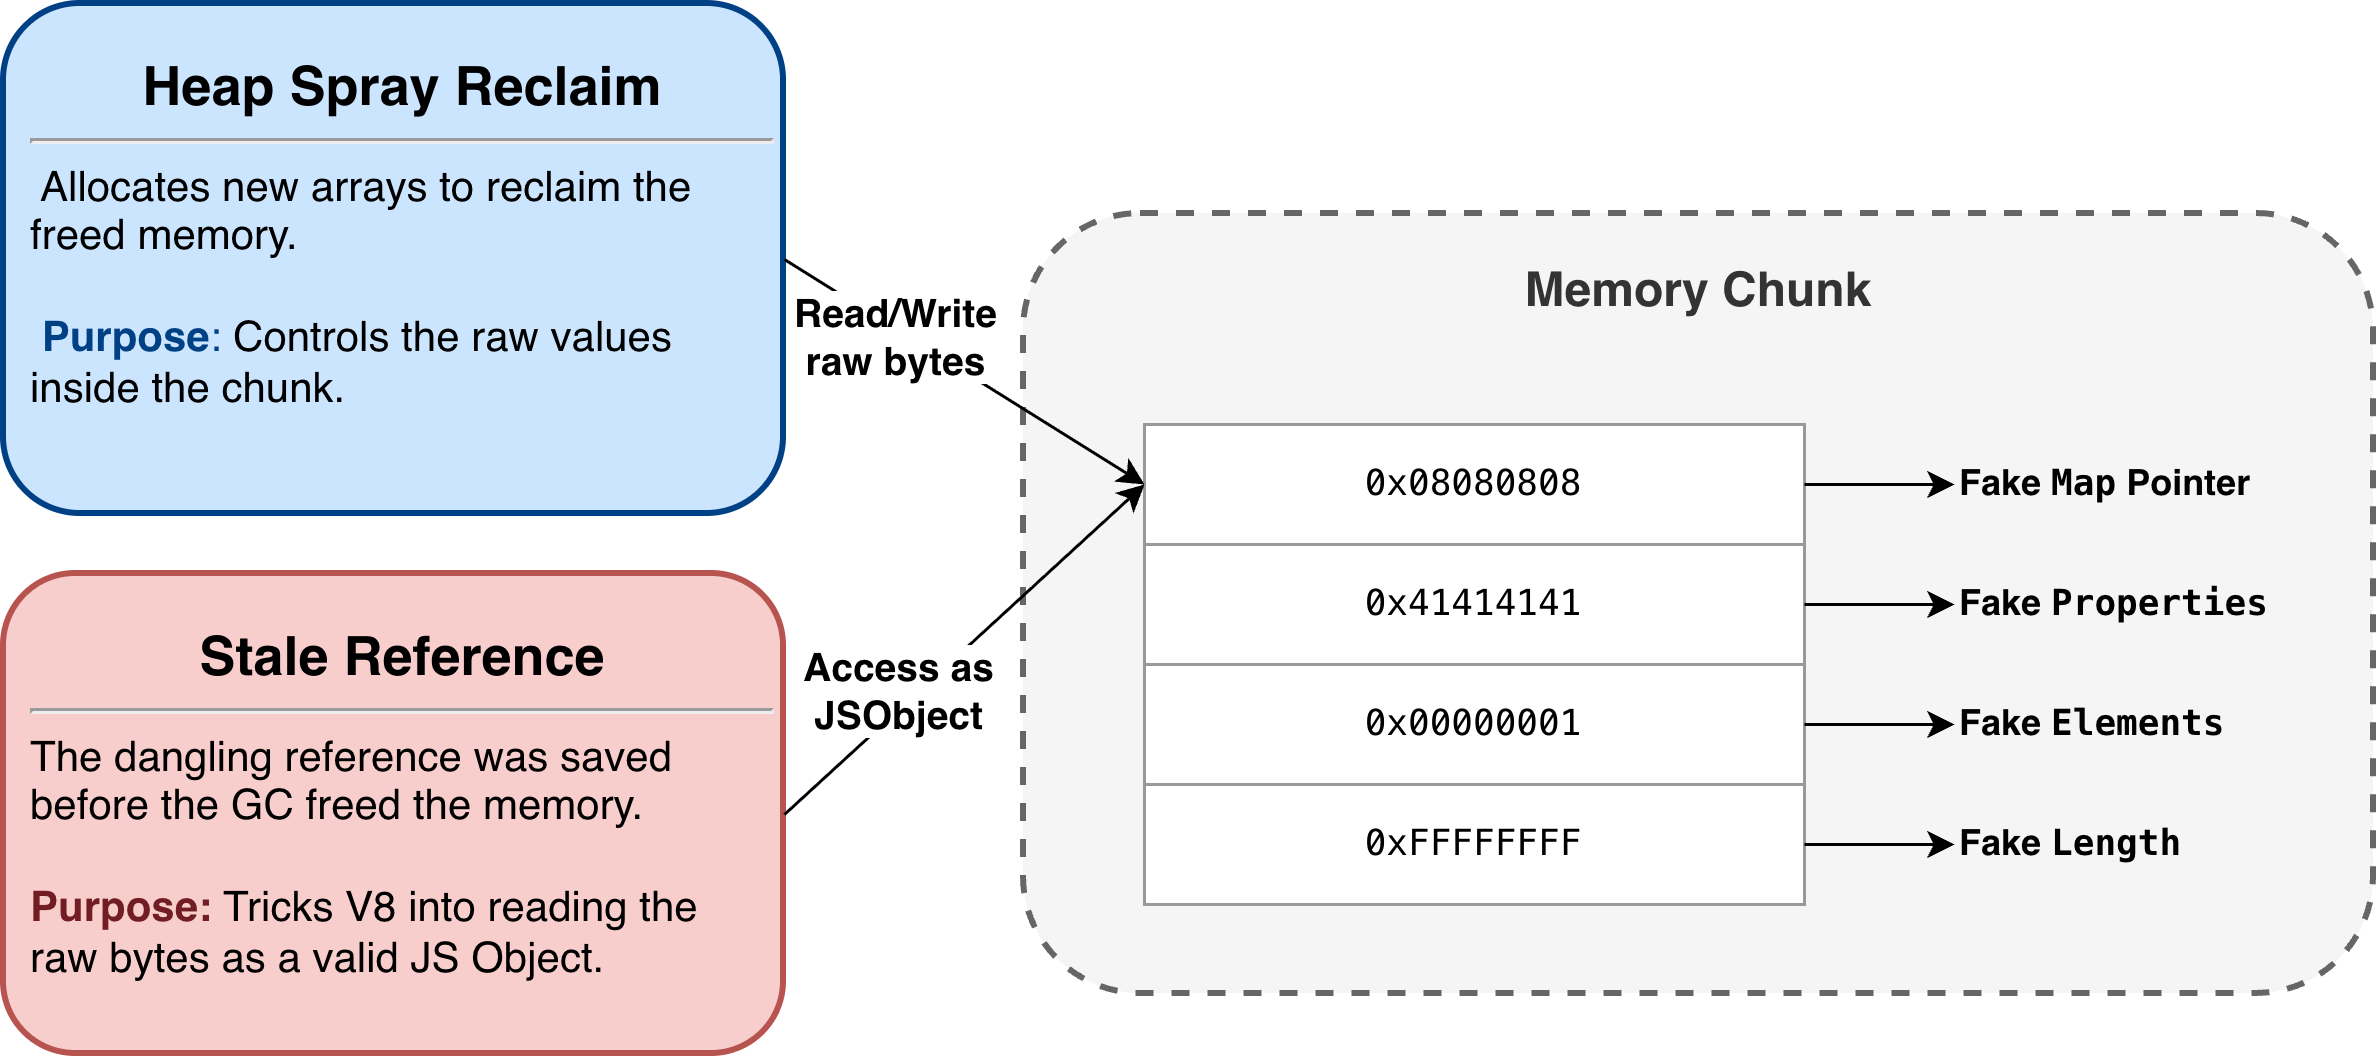
Forging a fake JSArray in the reclaimed HeapNumber memory
The plan is essentially:
Free and reclaim the
HeapNumberthatcTpoints toForge a fake
JSArraywith attacker-controlled length and elements pointer at the reclaimed memory to achieve cage-wide read/write primitivesAllocate a special
JSArraythat contains an object along with a marker value to achieve addrof/fakeobj using the caged read/write primitives above.
To reliably facilitate the construction of addrof and fakeobj in step 3, we need to handle step 2 differently from a normal cage-wide primitive. This is because constructing addrof/fakeobj involves scanning the cage memory for the marker value we put in step 3’s JSArray, so we can read the address of the object put in that array for addrof, and do the reversal for fakeobj. This can unpredictably trigger garbage collection and change the heap layout, reducing the reliability of the scan.
The key to overcoming this issue is by reducing the variables in the scanning process, and avoiding triggering GC by reducing the number of scan iterations. For example:
In step 2, we forge a
JSArrayof length 0, and store 1 element to it to trigger legitimate array backing store allocation from V8. We then immediately allocate step 3’sJSArrayso it has a high chance of being allocated right after step 2’sJSArray. The closer these two backing stores are, the fewer scan iterations we would need to reach the marker.We can further reduce uncertainty by anchoring the scan range instead of scanning indefinitely from step 2’s
JSArray. By reading back the backing store pointer of step 2’sJSArray, we get a start offset in the cage to start the scan. We will only try to scan at most 1 page of committed memory (4KB) from here and bail out if we do not find the marker.
We illustrated one way the primitives can be constructed in the diagram below:
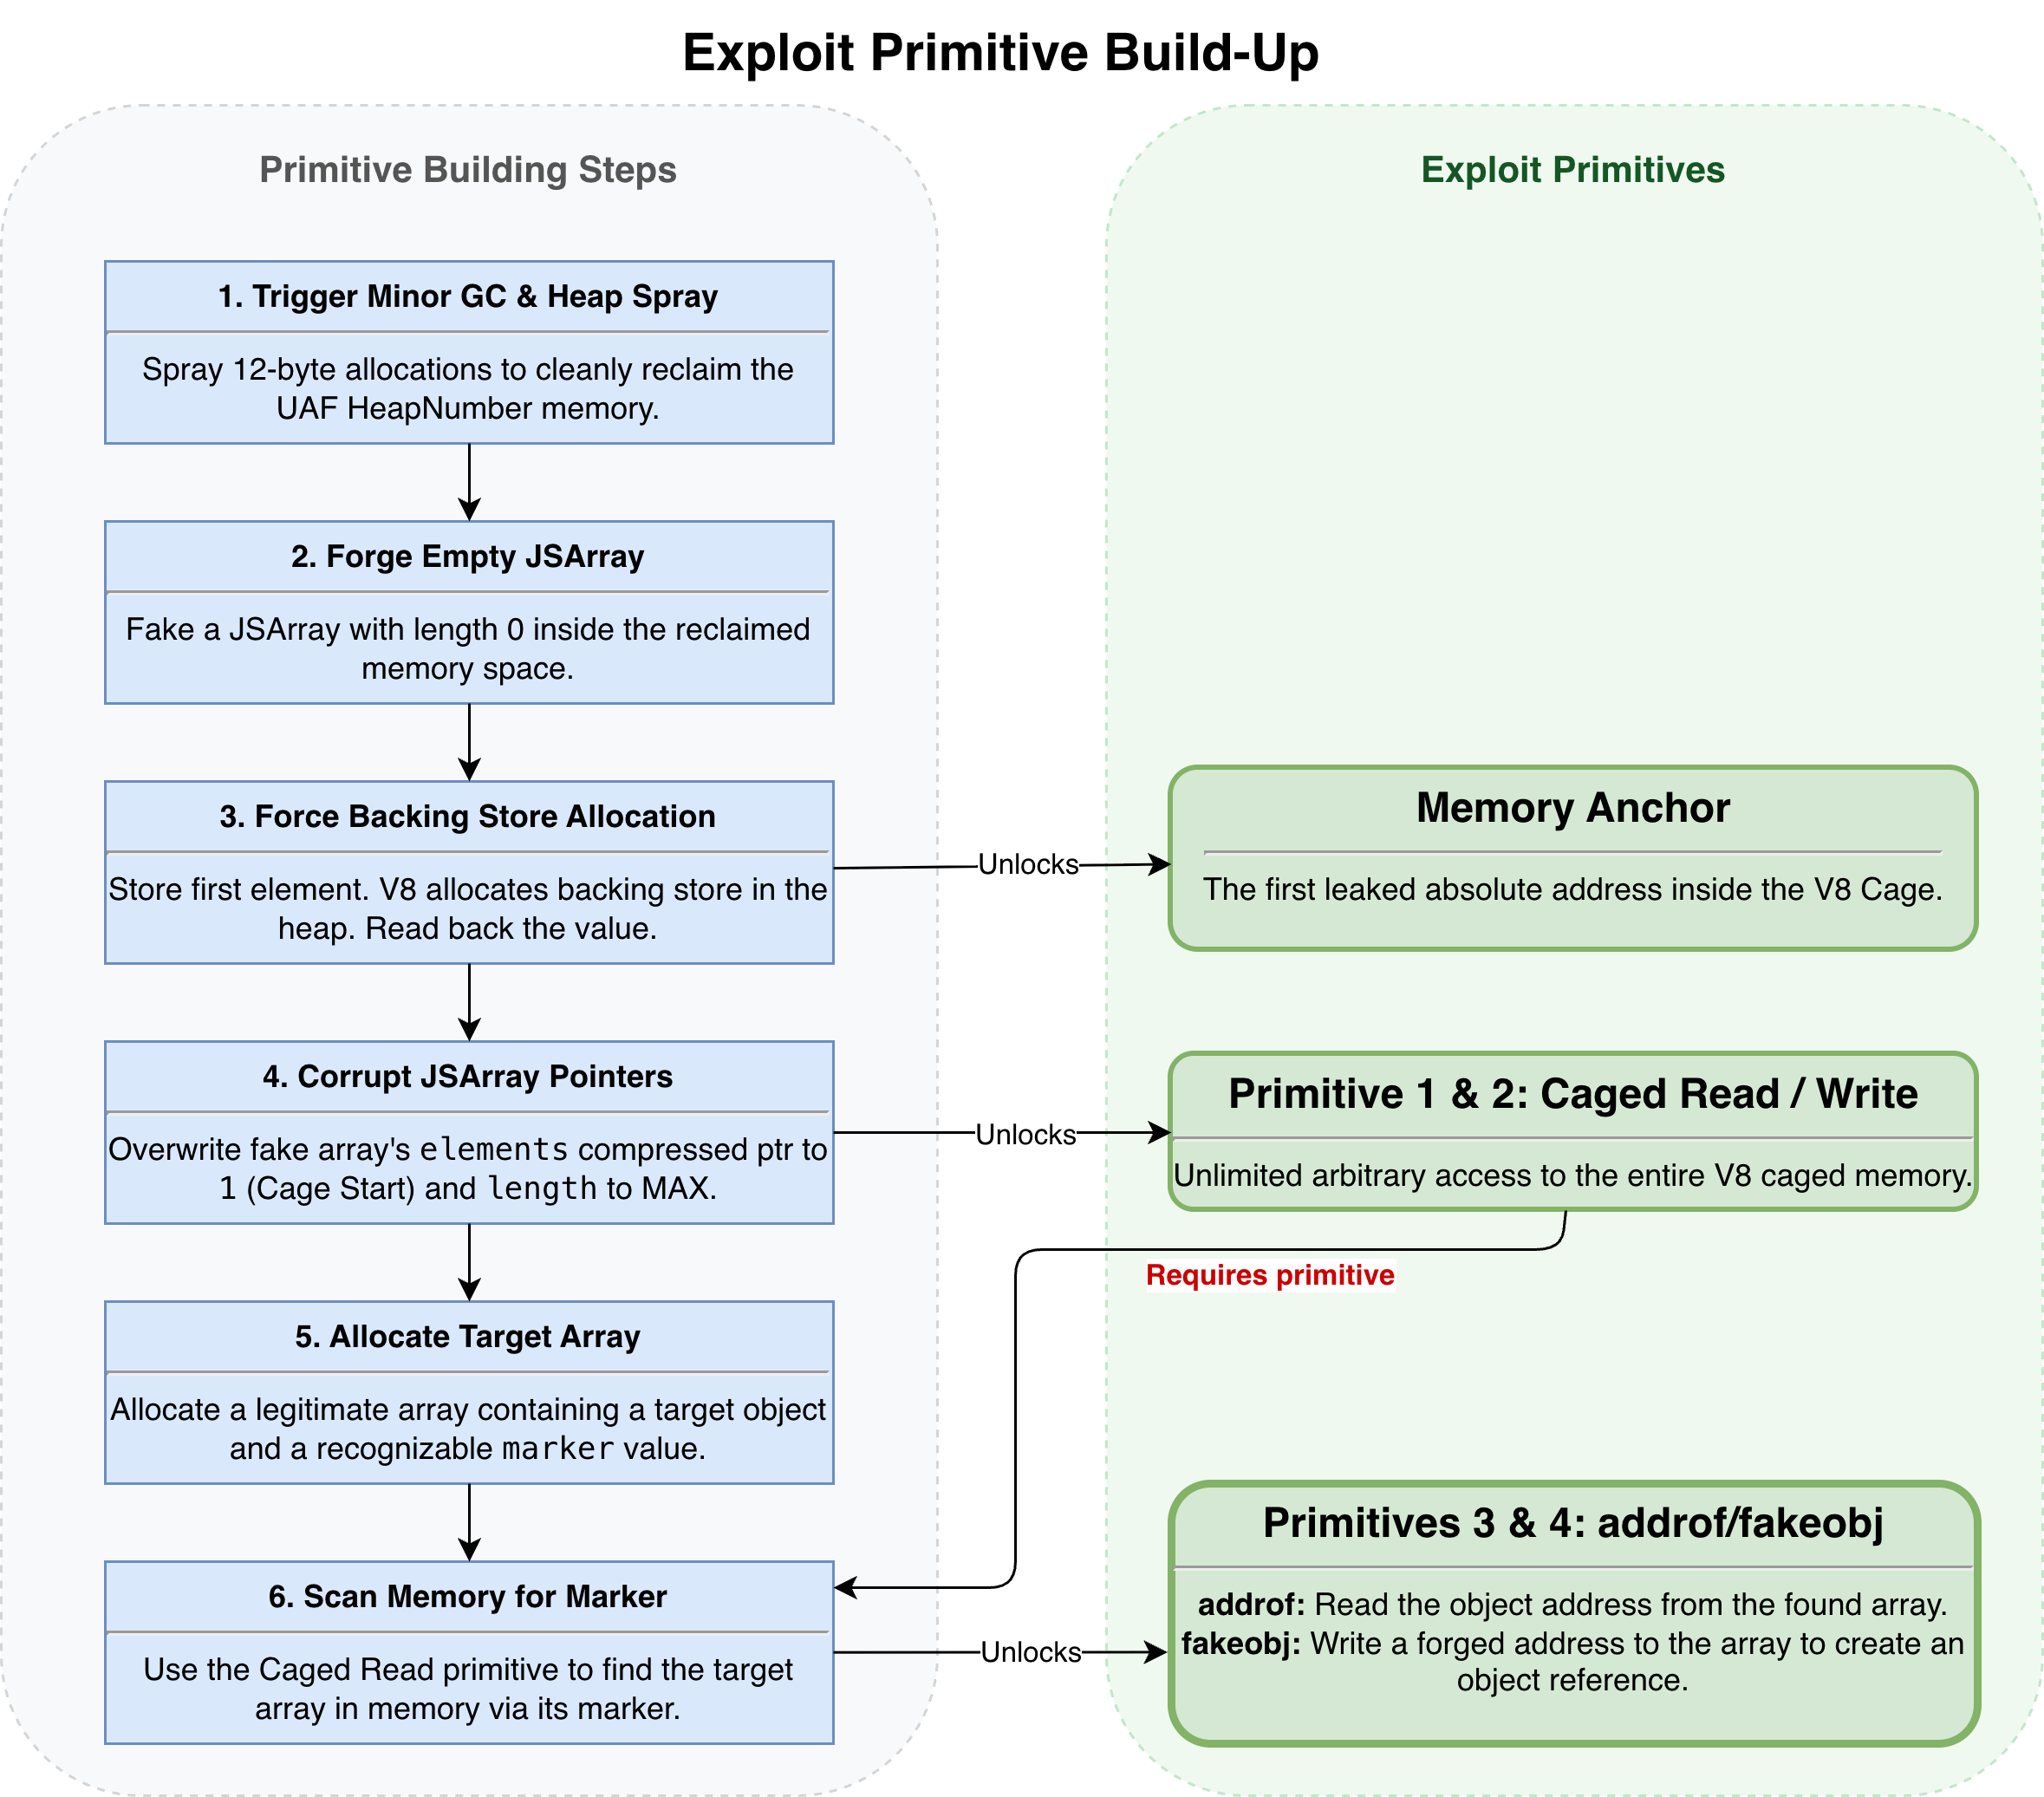
Building the exploit primitives
This is a fairly common exploit flow, so for now it's left as an exercise for readers interested in building this chain. The hard part has already been done before this :) This part of the exploit chain is among the most fragile, though, due to how noisy the small HeapNumber-sized allocation is and how sensitive the heap spraying is to garbage collection. Claude and Codex handled this well, since they are good at looping toward a concrete goal until it is reached.
While the primitives we've built up to this point are powerful, they are all inside the V8 sandbox. We can't touch or see anything outside the cage. For that, we need more bugs.
To escape the V8 sandbox, we exploited a use-after-free vulnerability in JavaScript Promise Integration (JSPI). This feature has been known as a can of worms, which can literally enable control-flow hijacking. Let's see how it fails to hold up against us this time.
Before the deep dive, here is the escape end to end. Act I left us with addrof, fakeobj, and caged read/write, all trapped inside the V8 cage. Act II leverages them to break out and run native code in the renderer:
The bug: a use-after-free in JSPI. When an uncatchable exception unwinds a WebAssembly stack, V8 retires the backing
StackMemorybut forgets to clear theWasmSuspenderObject's pointer to it, leaving a dangling reference.A leak to aim by: caged read/write stay inside the cage, so we borrow an out-of-bounds read from a legacy
chrome.loadTimesstring to leak thechrome.dlland cage base addresses our ROP chain will need.Free and reclaim: we
fakeobjthe termination exception, throw it through WASM to reach the buggy unwind path, then force a GC and spray to reclaim the freedStackMemorywith a fakejmpbufholding our own stack, frame, and instruction pointers.Hijack: we drive JSPI to resume the suspended stack, and the stack switch loads our
jmpbuf, handing usrspandrip. A ROP chain does the rest.
The rest of this section works through each step, but the bug hides in the details of how JSPI runs and how V8 implements it, so we start there.
JSPI is a fairly new feature that, in a nutshell, makes WebAssembly (WASM) asynchronous!
Yeah, that's basically it. Before this feature, JavaScript and WASM were executed on the same stack. When JavaScript code calls WASM exports, it suspends JavaScript execution, starts executing in WASM, and only returns to JavaScript when it's done. For that reason, WASM had no way to transparently await async JS and then resume execution on the same stack, because that would require unwinding the entire WASM stack to return to JS.
JSPI solves this problem by introducing a secondary stack for WASM execution, so JS and WASM execution don’t have to fight each other on the same stack anymore.
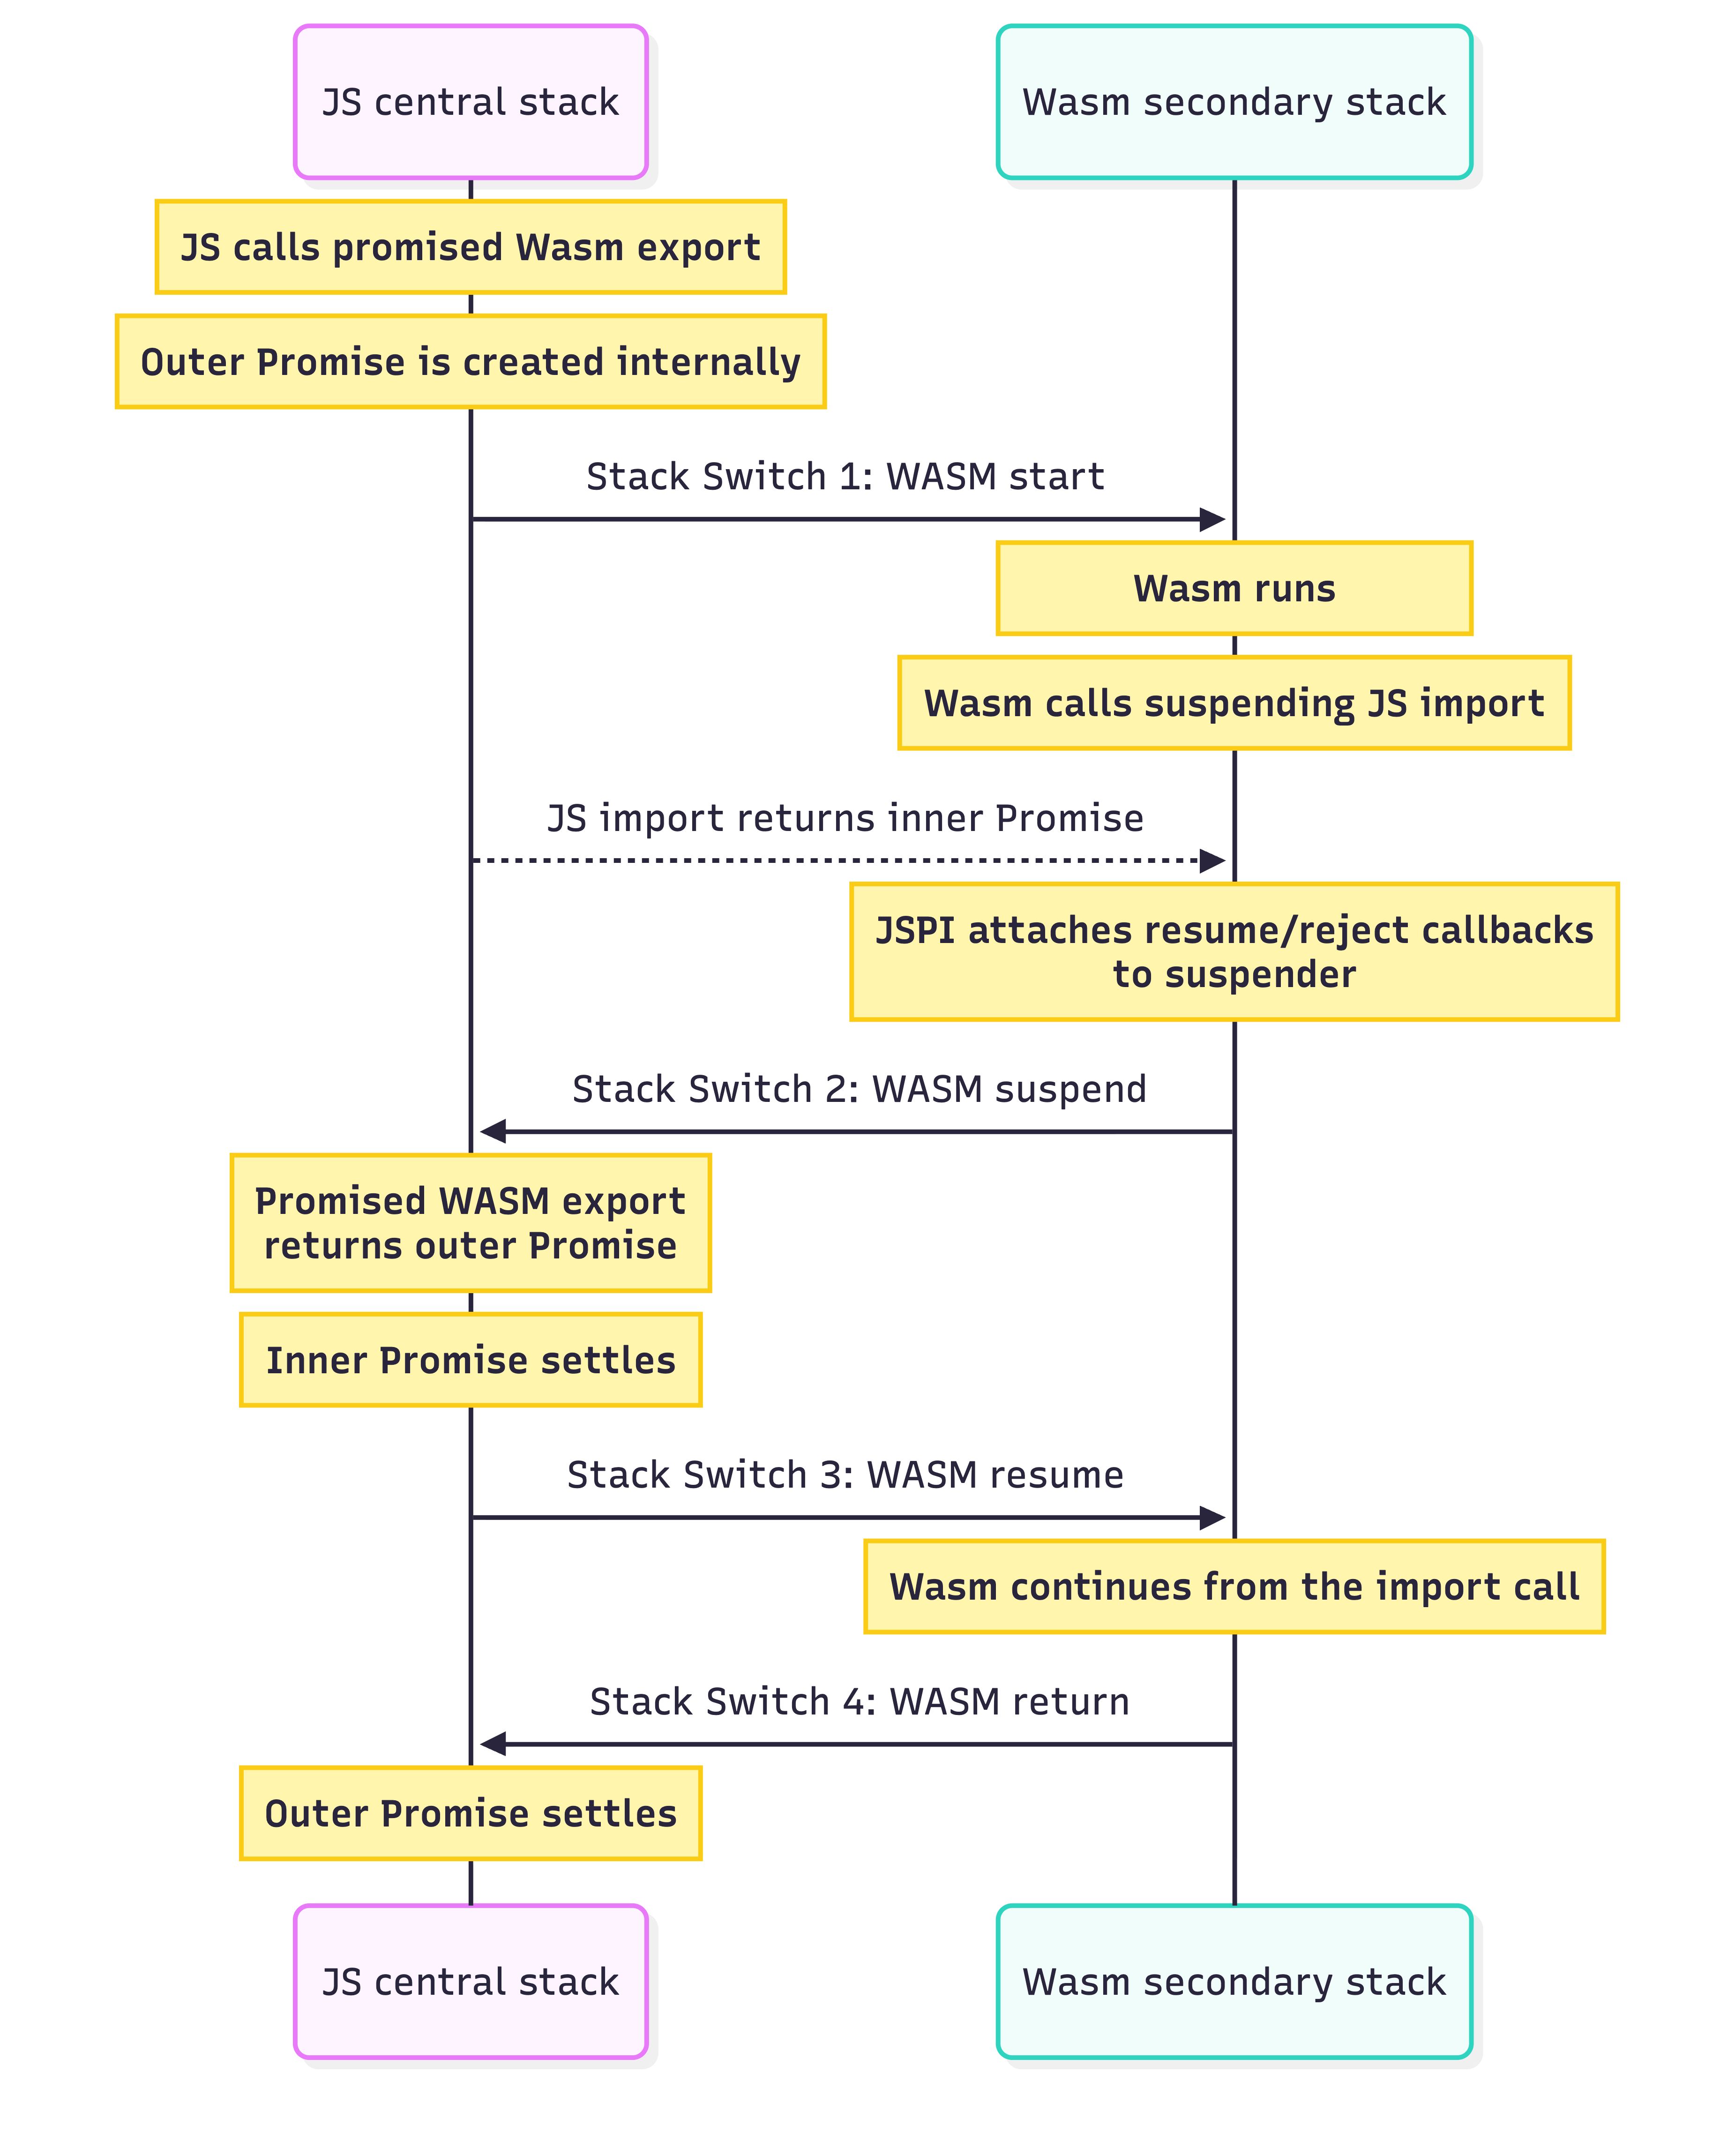
WASM stack suspending and resuming in JSPI
With JSPI, the JS caller receives a promise (the outer promise) from the WASM export. That promise settles after the async JS called by that WASM settles (the inner promise). Execution is transferred back and forth between the 2 stacks to ensure the order of promise resolution.
In JSPI, there are a few important concepts around the execution stack:
When the promised WASM export is called from JS, a stack switch is performed to transfer execution from the central JS stack to the secondary WASM stack.
When WASM awaits async JS, JS suspends the secondary WASM stack (also called "parking" the stack).
After the inner JS promise that WASM obtained settles, the WASM stack resumes.
When WASM execution finishes or terminates for some reason, JS retires the secondary WASM stack.
With this much switching, JSPI has to be handled very carefully.
V8 execution environment (an isolate) has a stack_pool that holds allocated finished StackMemory objects that are reusable. Stack retirement moves the StackMemory object into the stack_pool, where it waits, still allocated, to be used again. Only under sufficient memory pressure does ReleaseFinishedStacks actually deallocate these finished stacks.
Source: src/wasm/stacks.h:290 · src/heap/heap.cc:1122
In V8, a WasmSuspenderObject is used to control execution of the secondary stack:
Source: src/wasm/wasm-objects.h:1601
The root cause of this vulnerability lies in the improper cleanup of JSPI-related objects after WASM execution terminates. The excerpt below shows a proper cleanup order of the WasmSuspenderObject and the encapsulated StackMemory object:
Line 1108: Clear the
stackfield of theWasmSuspenderObjectLine 1099: Switch the execution stack to the correct one from the current WASM stack
Line 1101: Retire the current WASM stack, eventually returning it to the
stack_pool
Source: src/wasm/wasm-external-refs.cc:1104 · src/execution/isolate.cc:4215
Besides normal execution termination, JSPI can also terminate execution on a thrown exception. In this case, the cleanup process will be handled by one of the most complex functions, UnwindAndFindHandler, which handles stack unwinding. In short, when an exception is thrown, V8 has to find the closest execution stack that can handle this exception. It does so by traversing the stack tree upward until it encounters the handler and passes the exception information to it. All the stack frames along this traversal are invalidated.
In this cleanup path, V8 does not clear the now-invalid stack field like step 1 of the proper cleanup order above. The following code excerpt shows how this can be achieved:
Line 2606: When walking up the stack from the current exception position, if it encounters a WASM JSPI stack and the exception is deemed uncatchable by JS, it does not retire that stack properly. It simply skips over it.
Line 2659 onward: When the exception handler has been found, the
FoundHandlerlambda function is run. The loop starting at line 2523 retires every stack between the throw site and the found handler, including the now-inactive stacks.
We can see that nowhere in this process is the stack field of the WasmSuspenderObject cleared, even when the stack has been retired. Therefore, the suspender still holds a reference to the stale StackMemory object, which now belongs to the stack_pool and will be garbage-collected under sufficient memory pressure.
Source: src/execution/isolate.cc:2488 · src/execution/isolate-inl.h:190
In this process, V8 assumes that in the case of JSPI WASM stack unwinding, the suspender object can no longer be reachable at this point because it encountered a special internal exception identified by the is_catchable_by_javascript predicate. This can be broken for two reasons:
This special internal exception can be triggered using the built-in function
%TerminateExecution, but under normal JS execution, users should not be able to trigger it. This may not be true for a compromised V8 cage.There is no guarantee that the suspender object is unreachable by a compromised V8 cage.
Supposedly, the JSPI vulnerability gives us execution-flow control, but where to? We still only have caged read/write, so we need an information leak outside the cage.
For this part, we used an obscure leak coming from a legacy feature in Chrome. chrome.loadTimes is a native function that provides performance statistics. It was deprecated, but the code is still present. The important thing is that it has prebuilt JS source code attached, and this code is outside the V8 cage, in the .rdata section. The reference to this source code is an ExternalOneByteString whose header is inside the compromised V8 cage, which we can freely manipulate. There is no direct memory pointer in this header, but since it is a string, we can modify the length field. Using the fakeobj primitive, we can obtain a direct JS reference to this string and use it to read data past the end of the chrome.loadTimes source string.
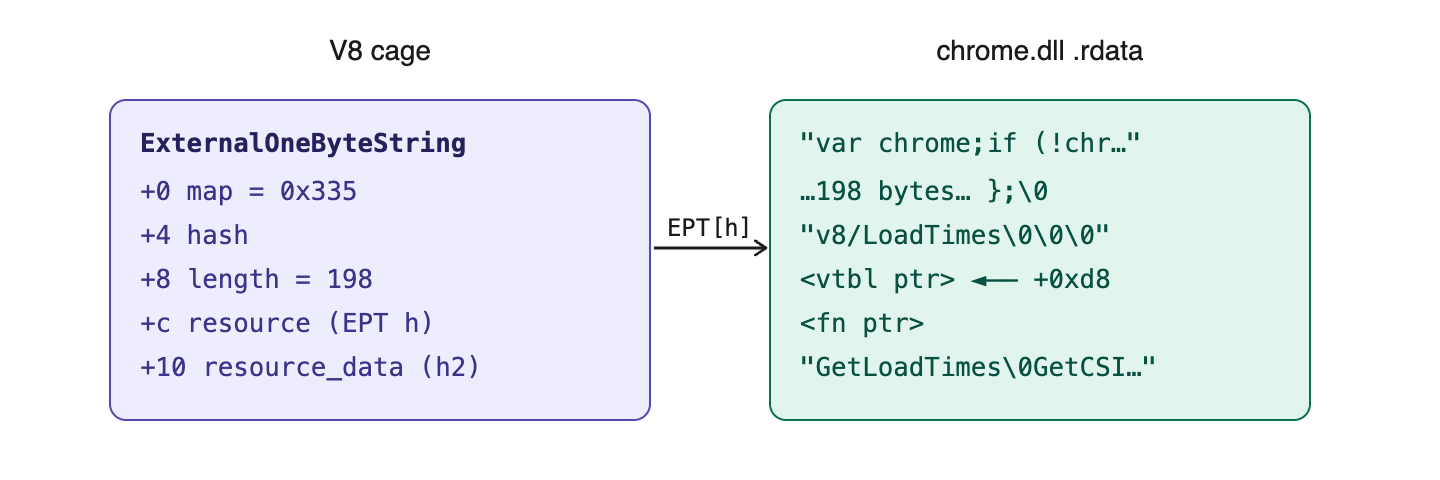
Reading past a .rdata string into chrome.dll's .data through a corrupted ExternalOneByteString
This second-hand out-of-bound read helps us reach the .data section, where we can leak the V8 cage base, and recover the base address of chrome.dll from a vtable pointer located only 96 bytes after the end of this source string. These will be used to determine where we direct execution and to build our ROP chain.
Now let's circle back to the JSPI world to see how we can control execution. We need to do 2 things:
Trigger the free and reclaim of the dangling
StackMemoryobjectUse the
WasmSuspenderObjectto perform a stack switch to WASM, which uses the now attacker-controlledStackMemoryin step 1
Recall that during stack unwinding, this dangling reference situation can occur only if an internal exception is thrown, specifically kTerminationException. While this is not normally accessible to JS (only via the built-in %TerminateExecution), it is a valid JS root object located at a static address inside the cage:
Source: src/roots/static-roots-intl-wasm.h:1068
Getting a JS reference to this object is as simple as calling fakeobj(0xefffd), and we can throw this exception like any other. Now, we only need to create a JS import that throws this exception and call it from WASM code. Afterward, we trigger a Major GC to collect the objects in stack_pool and perform a spray to reclaim this memory.
This fake-the-exception step is the nudge we mentioned earlier: on the Chrome port, Claude couldn't reach it on its own.
StackMemory has a struct member jmpbuf, which is:
Source: src/wasm/stacks.h:32
If we can manipulate this information and bypass any verification by WASM, we effectively control the execution flow: the instruction pointer and stack pointer all belong to us! Now we only need to find a way to make JSPI use this information. Recall how JSPI works: JS can resume WASM execution after suspending it, once the inner JS Promise settles. This inner Promise has the WASM resuming callback attached. Using our primitives to trace the path from a JS Promise to the WasmSuspenderObject, this is what we get.
We can then forge a JSFunction reference to this callback using fakeobj. When we trigger the callback, it reaches the WasmSuspenderObject with the stale StackMemory, and WASM execution resumes using our fake instruction pointer and stack pointer.
With all that information, let's revisit the plan to exploit the bug successfully:
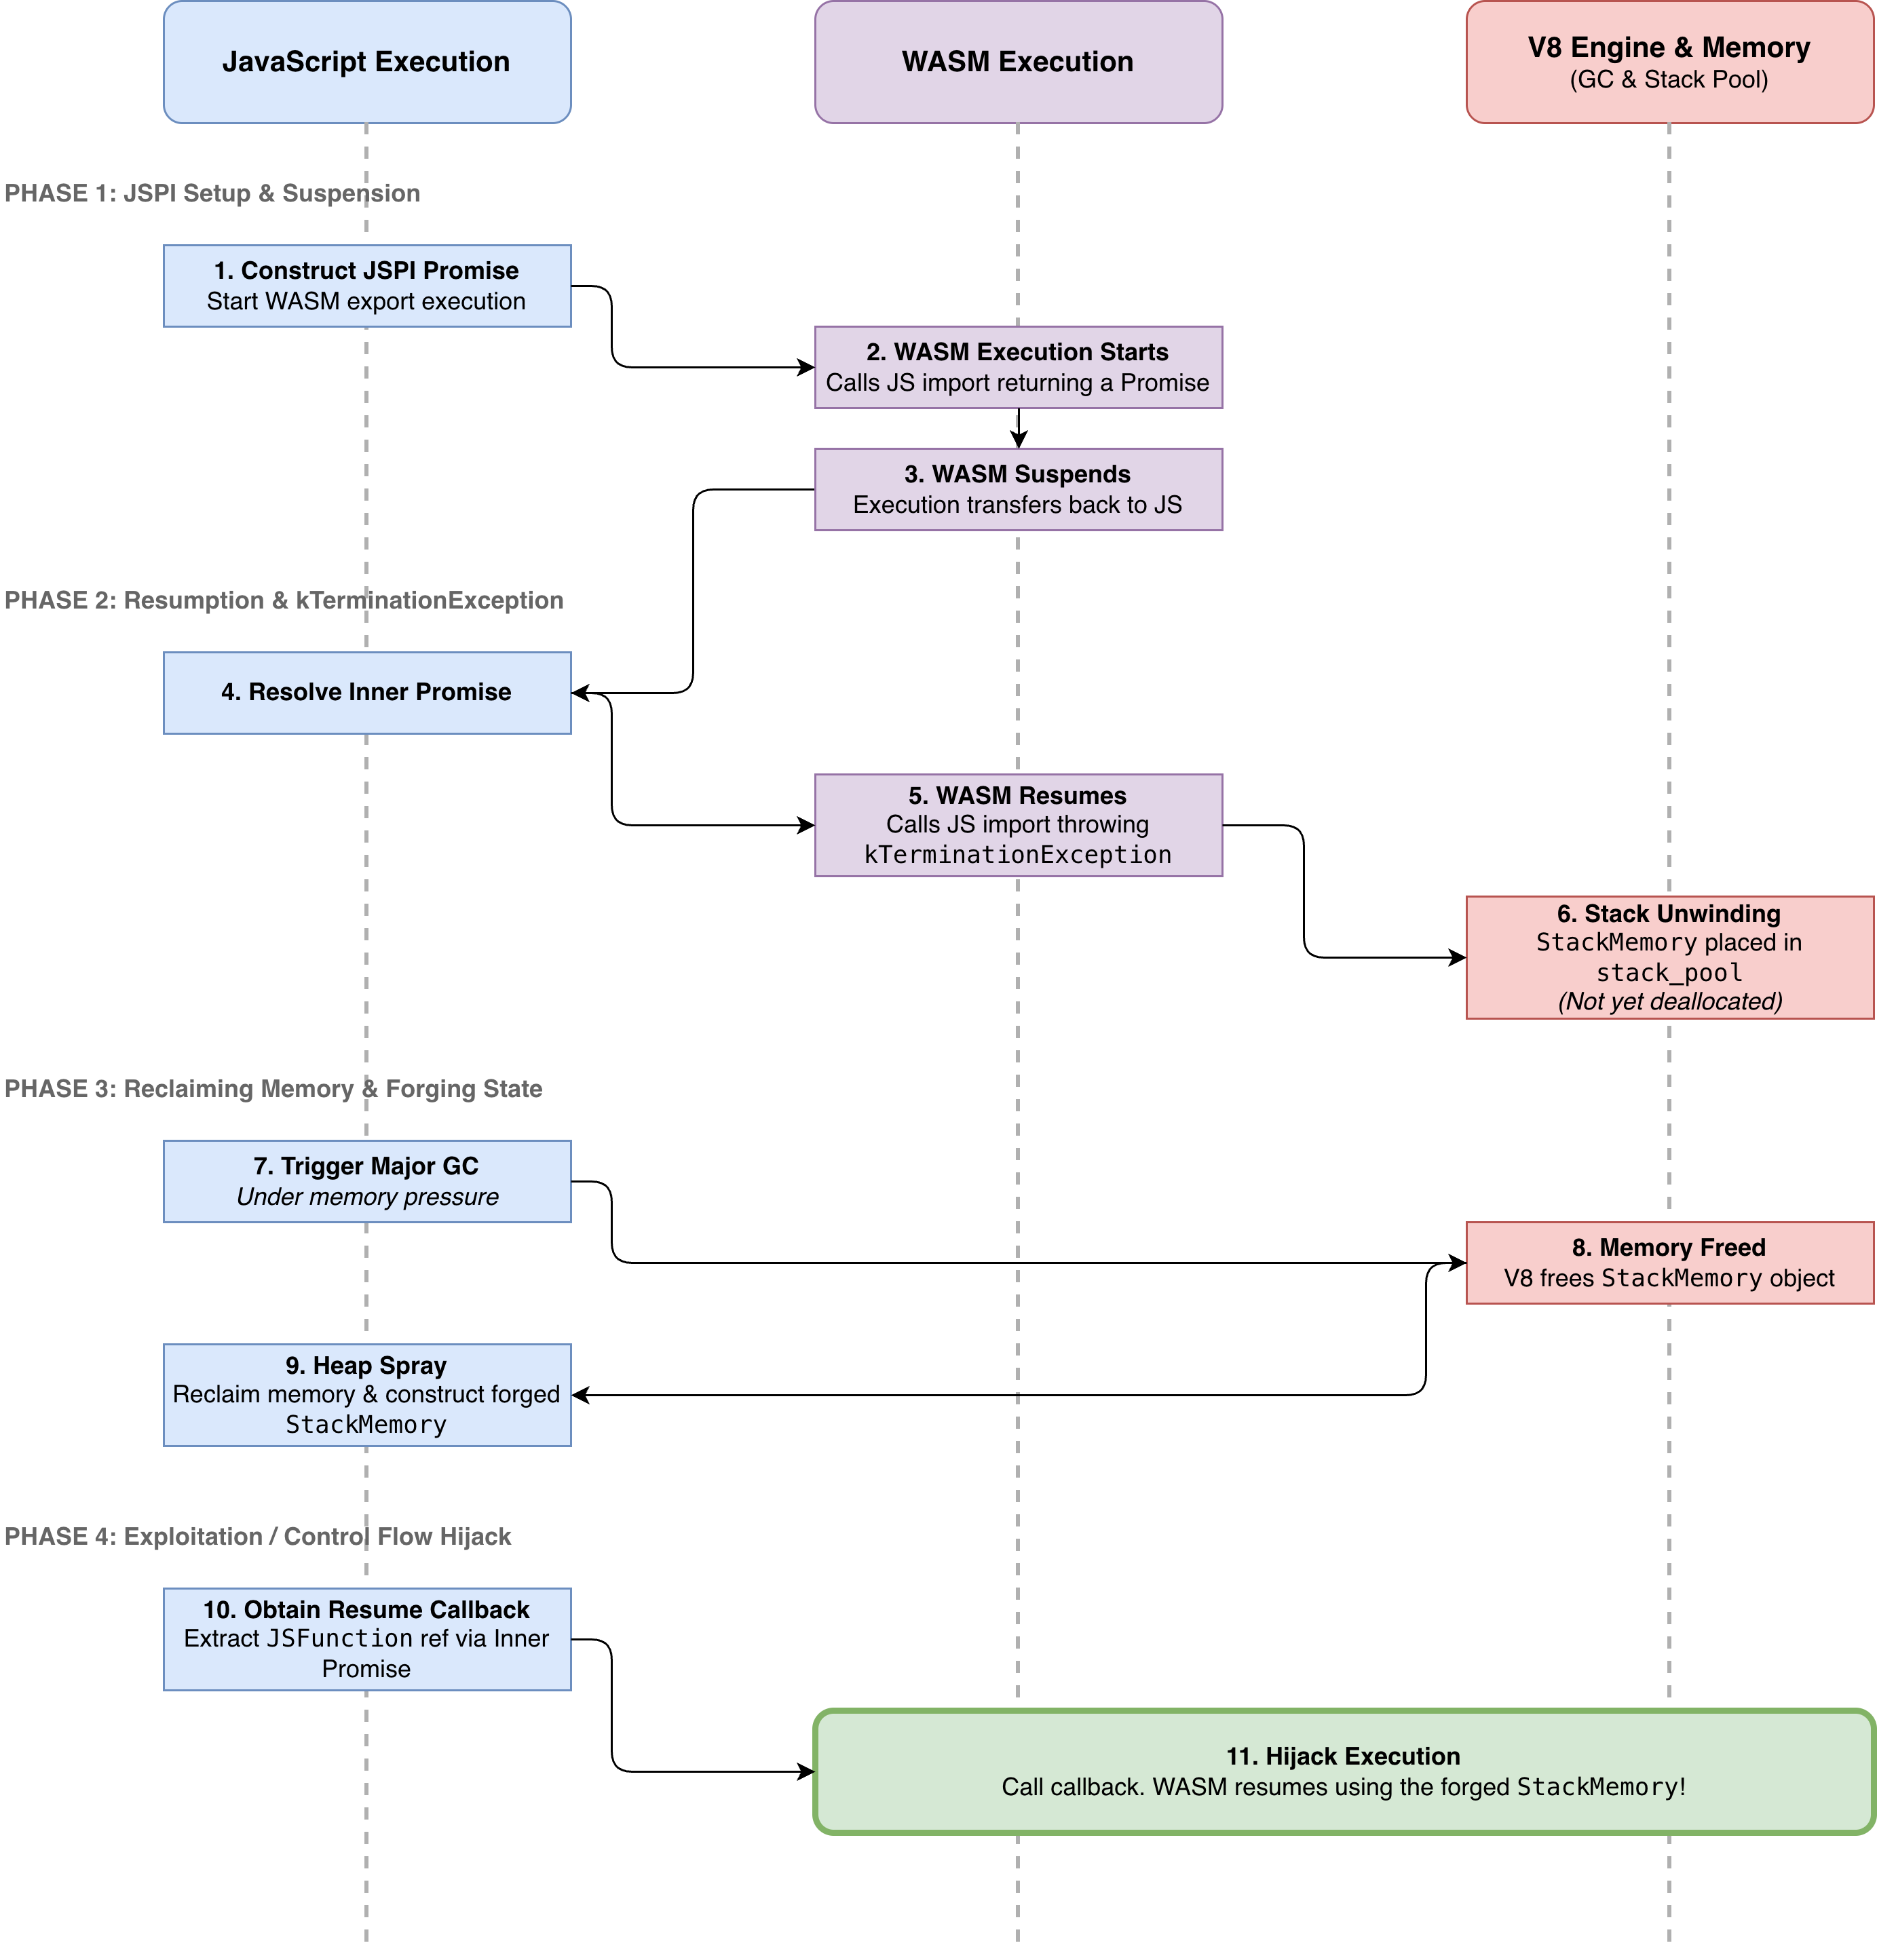
Exploiting the JSPI StackMemory use-after-free to hijack execution
Note that calling this WASM resume callback triggers a stack switch. There is verification of the jmpbuf struct, but it can be bypassed by simply forging its fields during the StackMemory spray.
Source: src/execution/isolate.cc:4115
In the snippet above, from is the central JS stack, which is active at that time. Since we are resuming, the expected state of the to stack is Suspended. During our spray to reclaim the StackMemory, we simply forge this value to bypass this check.
Everything in this episode comes together in poc/poc.html.
Its four stages map onto the two Acts:
Stage 1 is the Maglev write-barrier elision in Act I.
Stage 2 is the
chrome.loadTimesleak.Stages 3 and 4 are the JSPI use-after-free.
It targets Chrome for Testing 146.0.7680.208 on Windows x64, and the offsets, map constants, and ROP gadgets are all specific to it. To run it:
The --no-sandbox flag is there because this episode stops at the renderer. The exploit already has native execution inside the renderer process, and dropping the OS sandbox simply lets the shellcode spawn a visible notepad.exe. Breaking out of that outer sandbox is the GPU-process story we save for a later episode.
That's it for the renderer. Next episode, we break out of the sandbox into the GPU process, with a novel Linux technique and more of what these machines can pull off. Until next time!
2026-03-10: Found and reported heap out-of-bound write vulnerability in Skia (crbug.com/491191118)
2026-03-12: Skia vulnerability fixed in https://skia-review.googlesource.com/c/skia/+/1184756
2026-04-08: Discovered the BuildCheckSmi vulnerability in Maglev and the UAF vulnerability in JSPI
2026-04-08: Reported the Maglev bug to Google (crbug.com/500880819)
2026-04-09: Reported the JSPI bug to Google (crbug.com/501147587)
2026-04-14: Fix for Maglev bug landed in commit b9be4feb
2026-04-15: Fix for JSPI bug landed in commit 13c76294
2026-05-08: Submitted first exploit to Google
2026-05-12: Submitted second exploit to Google
2026-07-16: Published this blog entry
Disclaimer: No in-the-wild threat actors or exploit shops were harmed during the process. Some may be extremely frustrated because their vulnerabilities got burned for no particular reason rather than for fun and peanuts.