Main
AD is the most common cause of dementia, affecting tens of millions of people worldwide and projected to more than double by 20501. Current disease-modifying treatments for AD typically target only one aspect of its pathology: amyloid-β aggregates. However, these have shown limited efficacy in alleviating symptoms7. Further insight into disease aetiology may highlight other mechanisms that could lead to more effective drugs. Given the large twin-based heritability of AD (\({h}_{{\rm{twin}}}^{2}\) = 60–80%)2, genetic studies can provide valuable insights into its underlying biological mechanisms. Moreover, polygenic scores (PGSs) may improve clinical risk prediction models and help to identify individuals for early intervention before the onset of neurodegenerative processes.
Recent genome-wide association studies (GWAS) of AD have successfully identified approximately 80 risk loci, highlighting the central role of microglia and suggesting immune function, amyloid catabolism and lipid function as important biological processes4,5. Despite these discoveries, the PGSs generated from these studies have had limited predictive performance4, and liability-scale summary-statistics-based heritability (\({h}_{{\rm{SNP,liab}}}^{2}\)) estimates have been low (approximately 5%)8. This discrepancy has prompted the suggestion that there may be little additional genetic risk that can be identified with GWAS6 beyond the strongest genetic risk factor for AD: APOE. Others, however, have proposed that approximately 1,200 causal loci are expected to influence genetic risk for AD3. To reconcile these differences, larger studies leveraging improved, well-calibrated methodologies will be critical. Such efforts may yield more accurate heritability estimates, enhance the predictive power of PGSs and, importantly, uncover additional risk genes informing disease mechanisms. Moreover, including individuals of non-European (EUR) ancestry can further improve PGS prediction in underrepresented populations.
Here we report a large multi-ancestry GWAS of AD, encompassing a total of 109,479 cases, 74,141 proxy cases, 2,131,799 controls and 499,708 proxy controls. Proxy cases are genotyped individuals who reported that their parents had AD (Methods). Using this sample, we identified 118 loci in a multi-ancestry analysis and 9 additional loci in ancestry-specific analyses, 48 of which are new. We estimated a \({h}_{{\rm{SNP,liab}}}^{2}\) of 16% and improved the out-of-sample prediction. We also found enrichment in microglia and in neuronal cell types, and highlighted relevant biological processes and potential drug targets. To maximize the utility of our results, we have provided publicly available summary statistics from the main analyses, as well as from multiple stratified analyses.
Data overview
Our study included 109,479 AD cases, 74,141 proxy AD cases, 2,131,799 controls and 499,708 proxy controls across 30 cohorts (Fig. 1, Extended Data Fig. 1 and Supplementary Data 1), resulting in a total effective sample size (Neff; Methods) of 416,493. The total effective sample size consisted of 91% individuals of EUR, 5% African (AFR), 3% East Asian (EAS), less than 1% admixed American (AMR) and less than 1% South Asian (SAS) ancestry (Extended Data Fig. 1). A subset of this dataset was available for sex-stratified analyses, with 20,402 female cases and 261,889 female controls, and 15,689 male cases and 214,956 male controls. Another subset with a Neff of 196,822 was available for a GWAS on the X chromosome. A full description of each cohort is available in the Supplementary Methods.
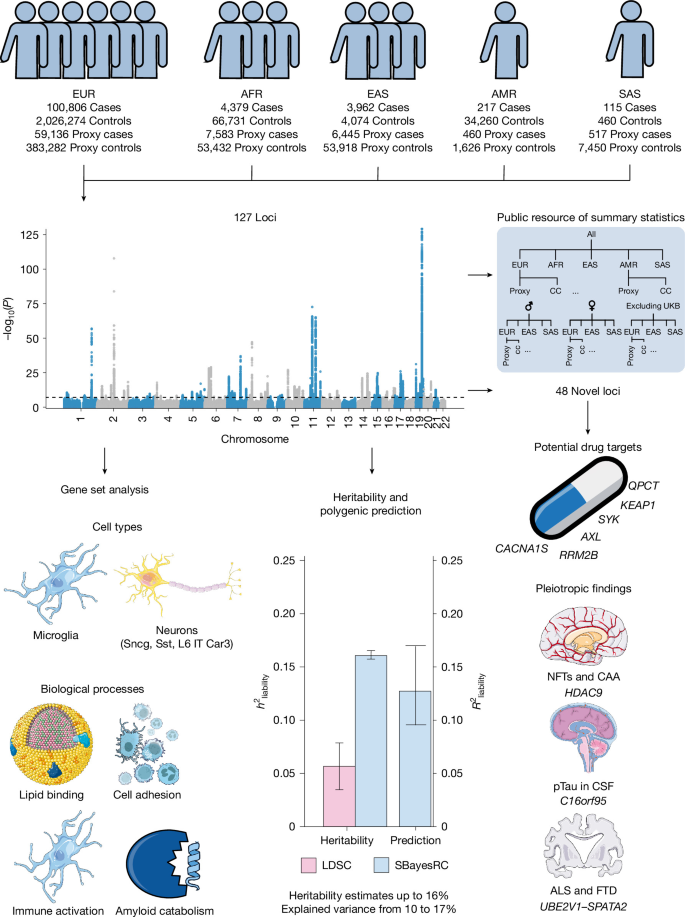
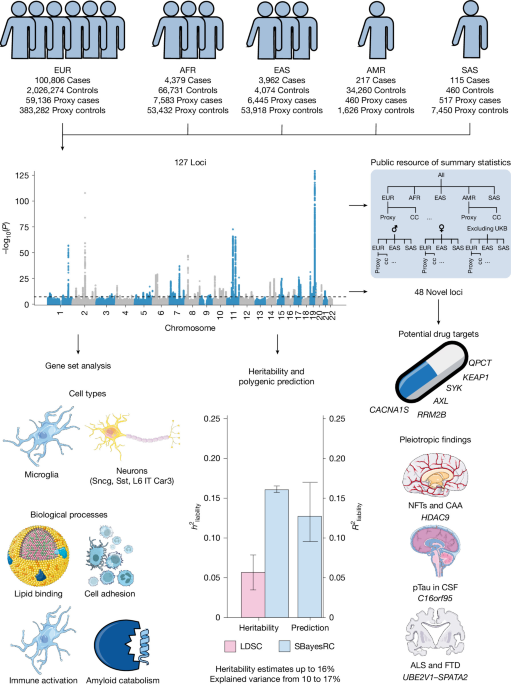
Flowchart summarizing the workflow and main results, including genome-wide association analysis (Manhattan plot from our multi-ancestry GWAS), gene set enrichment, SNP heritability and polygenic risk prediction, and characterization of new loci. ALS, amyotrophic lateral sclerosis; CAA, cerebral amyloid angiopathy; CC, case–control; CSF, cerebrospinal fluid; FTD, frontotemporal dementia; NFT, neurofibrillary tangle; pTau, phosphorylated tau. Schematics were generated using Servier Medical Art (Servier, under a Creative Commons license CC BY 4.0) and from NIAID Visual & Medical Arts: immune cells (https://bioart.niaid.nih.gov/bioart/253), glycoprotein (bioart.niaid.nih.gov/bioart/468), pill (https://bioart.niaid.nih.gov/bioart/407) and unisex icon (https://bioart.niaid.nih.gov/bioart/13), NIAID NIH BioArt Source.
GWAS meta-analyses identify new loci
We conducted a multi-ancestry GWAS of AD, including five broad ancestry groups: EUR (Neff = 379,465), AFR (Neff = 21,163), EAS (Neff = 13,790), AMR (Neff = 1,222) and SAS (Neff = 852; Fig. 2 and Supplementary Data 1). After quality control, this resulted in 8,152,095 SNPs with a minimum minor allele frequency (MAF) of 0.004 and a mean of 0.17. We identified 118 significant loci (P < 5 × 10⁻⁸), 41 of which are new. We did not identify risk loci on the X chromosome.
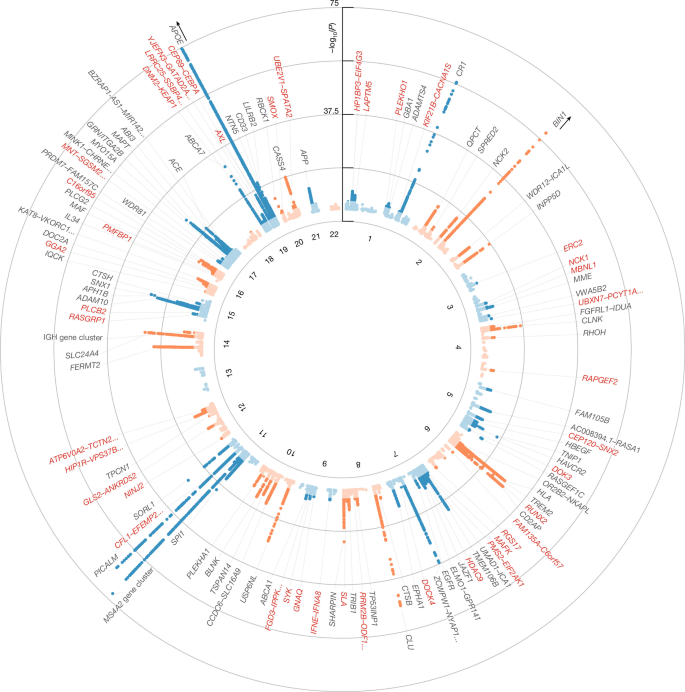
Results from an inverse-variance-weighted fixed-effects meta-analysis of 30 cohorts (109,479 cases, 74,141 proxy cases, 2,131,799 controls and 499,708 proxy controls; maximum effective sample size of 416,493) of 5 ancestry groups, comprising 8,152,095 SNPs after quality control. Association was tested per cohort using logistic regression with the covariates described in the Methods; P values are two-sided and were not adjusted for multiple comparisons, with genome-wide significance defined by the conventional threshold of P < 5 × 10⁻⁸. The x axis represents the chromosomal position of SNPs, and the y axis shows their strength of association measured as −log10(P). Genome-wide significant loci (darker points) are annotated with their predicted effector gene. New genes are in red. The lighter-shaded points correspond to SNPs not reaching genome-wide significance. Only SNPs with P < 0.00005 are plotted. The y axis is capped at 75 for visual clarity; however, the APOE locus reaches −log10(P) ~ 5,697 and the BIN1 locus reaches −log10(P) = 108. Exact P values and sample sizes are available in Supplementary Data 2.
In the ancestry-specific analyses, we identified 114 significant loci (38 new) in the EUR GWAS, 3 loci in AFR GWAS (TREM2, SORL1 and APOE), 2 loci in EAS GWAS (SORL1 and APOE) and no loci in SAS or AMR GWAS (Extended Data Fig. 2). The discrepancy in identified loci is as expected based on differences in sample size, with more than 90% of the total sample consisting of EUR individuals. After meta-analysing the ancestry-specific results, we identified 118 loci. By meta-analysing the ancestries, an additional 13 loci were identified, whereas 9 of the loci identified in the EUR-only analysis dropped below the significance threshold (TMEM163, MAP3K13, GPAM, MCF2L, KIAA0125–IGH gene cluster, GLCE, MCTP2, MNT–SGSM2–DPH1–RAP1GAP2 and AC104532.2–VMAC). These nine loci were still suggestive (at least P < 1 × 10⁻⁵) in the multi-ancestry meta-analysis. Overall, we identified 127 loci across all meta-analyses; 118 in the multi-ancestry analysis and an additional 9 in the EUR-only analysis (Supplementary Data 2; forest plots for each locus can be found on Zenodo9). Of the 127 loci, 48 were new (see Supplementary Data 3 and 4 for previously published studies and loci). As a sensitivity analysis to address potential heterogeneity in effect sizes across ancestries for all loci except APOE, we conducted a random-effects meta-analysis between ancestries using METASOFT after performing a fixed-effects meta-analysis within each ancestry with METAL. The P values of the lead SNPs remained almost unchanged (Methods and Supplementary Fig. 1).
We also meta-analysed the data stratified by sex (male versus female) and phenotype definition (case–control versus proxy). The sex-stratified GWAS (excluding proxy cases) identified 12 loci in the female-only GWAS (CR1, BIN1, OR2B2–NKAPL, TREM2, CLU, MS4A2, PICALM, APH1B, MAPT, ABCA7, APOE and LILRB2). We identified six loci in the male-only GWAS (CR1, BIN1, MS4A2, PICALM, APOE and NTN5; Extended Data Fig. 3). The relatively low number of associated loci compared with the overall GWAS was expected given the much smaller effective sample size of the sex-stratified analyses (Neff, female = 64,771; Neff, male = 49,748). The APOE-ε4 tagging SNP had a 13% larger odds ratio (OR) in female individuals than male individuals (2.85 versus 2.52, P = 9 × 10⁻⁸). We estimated the genetic correlation (rg) between EUR male individuals and female individuals with linkage disequilibrium score regression (LDSC) at 0.77 (95% confidence interval (CI) 0.48–1.06). Probably owing to small sample size and insufficient heritability, LDSC failed to compute genetic correlations for all other ancestries. Because the standard error of LDSC’s rg scales inversely with the SNP heritabilities of the contributing traits, and LDSC appears to underestimate the \({h}_{{\rm{SNP,liab}}}^{2}\) of AD (see below), we also approximated a more precise lower bound of the genetic correlation of 0.82 (95% CI 0.76–0.88) between male and female individuals of EUR ancestry using SBayesRC (Methods).
The case–control-only meta-analysis across all ancestries (Neff = 353,189) identified 95 unique significant loci, and the proxy-only meta-analysis (Neff = 60,826) identified 12 significant loci (Extended Data Fig. 4). Ten of the 12 proxy loci were also genome-wide significant in the case–control meta-analysis, whereas the other 2 loci were suggestive (P = 6 × 10⁻⁸ and P = 9 × 10⁻⁶). The LDSC-computed genetic correlation between the case–control and proxy meta-analysis was 0.99 (s.e. = 0.14, P = 3 × 10⁻¹³), indicating high similarity (Supplementary Note 1). A summary of association across the 127 loci in the ancestry, sex and phenotype stratified meta-analyses is available in Supplementary Figs. 2 and 3 and Supplementary Data 5. The multi-ancestry meta-analysis incorporated several cohorts not included in previous AD GWAS4,5, allowing us to assess the replication of recent GWAS findings in samples independent from previously included samples. Overall, we found high replicability of loci (Supplementary Note 2 and Supplementary Data 6 and 7), and that lead-SNP effect sizes correlated strongly (r = 0.98; Supplementary Fig. 4). To maximize the value of the data collected, we have made the summary statistics from the primary and stratified meta-analyses publicly available (after the exclusion of 23andMe Research Institute data). A summary table of the available summary statistics can be found in Supplementary Data 8. We observed heterogeneous APOE-ε4 effect sizes across ancestries (Extended Data Fig. 5), ranging from the smallest OR in AFR (OR = 1.7) to the largest in EAS (OR = 3.4). We note that the APOE-ε4 variant was not present in All of Us, the source of all AMR participants (Supplementary Methods). This variation is not explained by differences in proxy case representation: we found no consistent relationship between proxy case definitions and APOE-ε4 effect size, with proxy-based estimates larger than genotyped case estimates in EUR and AFR, but smaller in EAS and SAS ancestry. However, interpretation is complicated by substantial cross-cohort heterogeneity in APOE-ε4 effect sizes even within EUR cohorts (I2 = 97.7%, P = 8.19 × 10−210; Supplementary Fig. 5), suggesting that cohort-level differences may account for much of the observed variation rather than true differences in APOE-ε4 penetrance across ancestries.
To assess the effect of three cohorts that did not adjust for genotyping array or batch, we repeated the meta-analysis excluding them. Although 29 loci were lost, all were near the significance threshold both before and after exclusion, consistent with reduced power rather than false-positive signal in the primary analysis (Supplementary Note 3).
Effector gene prediction for 127 loci
For each locus, we predicted the most likely effector genes based on several methodologies and sources of evidence. We nominated genes in a locus based on associations in previous exome-wide association studies (ExWAS) of AD (Supplementary Data 4), effector gene predictions from a machine learning model (FLAMES), colocalization and Mendelian randomization results using expression, splicing and protein quantitative trait loci datasets (Supplementary Data 9), and gene nominations from previous GWAS (Supplementary Data 3 and Methods). We aimed to select a single gene per locus, prioritizing ExWAS-identified genes followed by FLAMES predictions. If these were not available for a locus, we selected the genes reported in previous GWAS. For new loci without ExWAS and FLAMES predictions, we selected genes from the colocalization and Mendelian randomization analysis and assessed their evidence in previous literature. A full description of the new loci is available in Supplementary Note 4. For loci with conflicting evidence, we additionally searched the literature for experimental evidence for the implicated genes (Supplementary Note 5). A summary of the experimental evidence from the literature for these genes is available in Supplementary Data 10. For some loci, this approach did not consistently resolve the conflicting predictions; in such cases, we report multiple genes (Table 1 and Supplementary Data 2).
Druggable and pleiotropic new genes
Among the 48 new loci identified, we found 17 genes that interacted with non-AD-approved drugs (Methods and Supplementary Data 11). Five of these genes have been evaluated for their potential as drug targets for AD in previous research; three showed promise in animal models (RRM2B10, SYK11,12 and KEAP113), whereas drugs targeting the other two genes (CACNA1S and AXL) were unsuccessful in improving AD symptoms in humans14 and mice14,15 (Supplementary Note 6).
Among the known loci, there were ten instances in which the gene predicted by FLAMES differed from the gene reported in previous literature (Supplementary Note 5). One of these genes (QPCT) is a potential drug target and was selected as an effector gene in locus 8 instead of two genes listed in previous GWAS (PRKD3 and NDUFAF7). QPCT catalyses the formation of pyroglutamate on position 3 of amyloid-β (AβpE3-X)16, which is the specific modification of amyloid-β targeted by an approved anti-amyloid antibody drug (donanemab); QPCT inhibitors are in development for several other neurodegenerative disorders as well17. Overall, multiple new genes, as well as newly prioritized genes in known loci, represent potential targets for drug development.
We next asked how the new genes interact with each other and fit into known AD-affected pathways (Supplementary Fig. 6 and Supplementary Note 7). Five new genes (SNX2, DOK3, SYK, GGA2 and CEBPA) interacted with known AD genes across two pathways, amyloid processing and microglial response to amyloid-β18,19,20,21,22, reinforcing the central importance of these mechanisms and showing that newly discovered risk factors converge on them. We could not link 8 of the 48 novel loci to a significantly associated gene set, suggesting that these loci may highlight new AD disease processes.
Across the 48 new loci identified, 5 have been associated with endophenotypes of neurodegeneration or another neurodegenerative disease (HDAC9, C16orf95, HIP1R, MBNL1 and UBE2V1–SPATA2). The HDAC9 locus has been previously associated with neurofibrillary tangles and cerebral amyloid angiopathy23. HDAC9 encodes a histone deacetylase, a family of genes associated with multiple diseases and neurodegeneration24. C16orf95 has been previously associated with phosphorylated tau levels in cerebrospinal fluid25, but the function of C16orf95 is not well characterized. Although this locus harbours genome-wide significant SNPs in both AD and phosphorylated tau, the local genetic correlation was not significant between them (rg = −0.31, P = 0.12; Supplementary Data 12), which suggests there may be independent mechanisms of association. The HIP1R and MBNL1 loci have been previously associated with Parkinson’s disease26, but colocalization analysis suggested that these loci are unlikely to be driven by shared causal variants across AD and Parkinson’s disease (Supplementary Data 12). The UBE2V1–SPATA2 locus has been previously identified as a shared locus between amyotrophic lateral sclerosis and frontotemporal dementia27. We identified a nominally significant positive local genetic correlation between AD and amyotrophic lateral sclerosis at this locus (rg = 0.47, P = 0.006; Supplementary Data 12). Excluding cohorts that defined AD based on ICD code F03 (unspecified dementia), which are the same cohorts that also screened controls for other neurodegenerative disorders, did not change this result (Supplementary Note 8). Colocalization analysis indicated that this locus was driven by a shared causal variant (PP.H4 = 0.95), with the lead SNP (rs113558364) being the most likely shared variant (Supplementary Note 9). This suggests that this may be a shared locus for multiple neurodegenerative diseases. UBE2V1 encodes a ubiquitin-conjugating enzyme and has been suggested to regulate protein aggregation28,29, and SPATA2 is a part of a signalling network that regulates apoptosis30. Both of these processes are relevant to multiple neurodegenerative diseases, and there is evidence in this study for both of these genes as potential effector genes (Supplementary Note 9).
Among known loci, we identified that the GBA1 locus was shared between AD and Parkinson’s disease, and the TMEM163 locus had opposite effects driven by distinct variants in AD and Parkinson’s disease, and probably mediated through different cell types (Supplementary Note 9). Overall, this analysis highlights seven loci (HDAC9, C16orf95, HIP1R, MBNL1, UBE2V1–SPATA2, GBA1 and TMEM163) that may be involved in fundamental processes leading to neurodegeneration.
Immune, lipid and amyloid pathways
We performed gene set enrichment analyses using MAGMA to highlight biological mechanisms relevant to AD. We identified 72 significant MSigDB and SynGO gene sets at a false discovery rate of 5% (Benjamini–Hochberg; Supplementary Note 10 and Supplementary Data 13). After clustering these gene sets (Methods), 13 clusters of more than one gene set were identified. These clusters reflected four biological processes identified in previous GWAS4,5,31: lipid binding, immune activation, amyloid catabolism and cell adhesion. The immune activation and amyloid catabolism gene sets were still significant when we repeated the analysis using a meta-analysis of cohorts not included in the previous meta-analyses (Supplementary Note 10 and Supplementary Data 13). In addition to the clusters, 21 gene sets were independent from any other gene set. These gene sets highlighted five biological processes that have been connected to AD pathology but not through GWAS gene set analysis: EphrinB reverse signalling32, glutathione metabolism33, RAS signalling34, sphingolipid metabolism35 and synapse endocytosis36. EphrinB has been suggested to influence amyloid-β toxicity32; glutathione metabolism influences oxidative stress, which has been linked to AD33; RAS signalling regulates blood pressure and fluid balance and has been linked to multiple aspects of AD34; sphingolipid metabolism has been linked to AD through regulation of cell death35; and synapse endocytosis has been shown to be impaired in AD36. Overall, we have highlighted multiple pathways that influence AD development through a range of biological mechanisms.
Enrichment in microglia and neurons
We aimed to identify cell types relevant to AD by examining the association between cell-type-specific gene expression and GWAS signal. Using gene expression data in healthy controls, we identified a significant positive association between overexpression in microglia and the GWAS gene association (Supplementary Fig. 7 and Supplementary Data 14). This suggests that these genes are preferentially active in microglia compared with other brain cell types, implicating the role of microglia in AD. This finding was in line with our previous GWAS of AD4. The association was robust to the removal of chromosome 19 and the proxy phenotype data (Supplementary Data 14). On the basis of this finding, we also performed gene set analysis to identify specific microglial states associated with the AD GWAS signal. Although no state was significantly associated with AD, inflammatory states showed the strongest association (Supplementary Fig. 7, Supplementary Note 11 and Supplementary Data 15).
Next, we used cell-type-specific differential gene expression between AD cases and controls37 for a MAGMA gene property analysis. We tested whether there was an association between the GWAS gene association and differential expression in a cell type. We identified a significant association between differential upregulation of genes in microglia and the AD GWAS signal. We also identified a significant association with differential downregulation of genes in two types of GABAergic neurons (small neuropeptide (Sncg)-expressing neurons and somatostatin (Sst)-expressing inhibitory interneurons) and one type of glutamatergic neuron (layer 6 intratelencephalic projection neurons (L6 IT Car3); Fig. 3 and Supplementary Data 16). The microglia and neuronal associations were robust to the exclusion of chromosome 19 and proxy data (Supplementary Data 16). After correction for the average differential gene expression across all cell types, the association of microglia remained significant (P = 1.58 × 10⁻⁶), whereas the neuronal associations were rendered only nominally significant (P < 0.05; Supplementary Data 16). This suggests that the associations of Sncg, Sst and L6 IT Car3 neurons may not be specific and could instead represent a general association with downregulated genes in neurons. Together, these results support the known involvement of microglia in AD. In addition, we found an enrichment of AD GWAS signal in genes underexpressed in neuronal cell types of AD cases compared with controls.
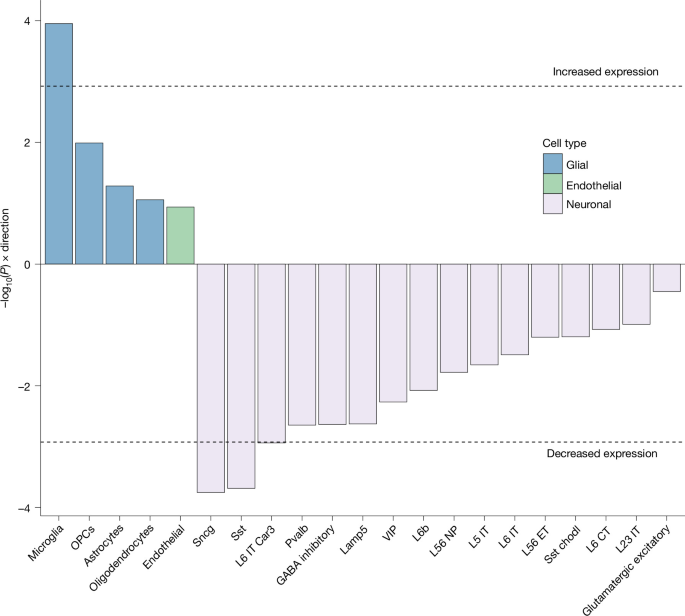
MAGMA gene property analysis testing the association between gene-level association statistics from the multi-ancestry GWAS (maximum effective sample size of 416,493) and cell-type-specific differential expression between AD cases and controls, taken from Nakatsuka et al.37. Both genes upregulated in microglia and genes downregulated in several neuronal subtypes in AD cases compared with controls are enriched for GWAS signal. Tests are one-sided, considering only a positive relationship between differential expression and AD association. The dashed line marks the Bonferroni-corrected significance threshold for 42 tests (21 cell types × 2 directions; P < 0.05/42). For each cell type, only the more significant direction of effect (upregulation or downregulation) is displayed. After additional correction for average differential gene expression across all cell types, microglia remained significant (P = 1.58 × 10⁻⁶), whereas the neuronal associations were only nominally significant (P < 0.05; Supplementary Data 16). Exact P values and sample sizes are available in Supplementary Data 16. Chodl, chondrolectin; CT, corticothalamic; ET, extratelencephalic; NP, neuropeptide; OPC, oligodendrocyte precursor cell; Pvalb, parvalbumin; VIP, vasoactive intestinal peptide.
Cell-type-specific gene prioritization
To support translation of the GWAS results, we prioritized genes that influence AD through specific biological processes and cell types. We used colocalization, Mendelian randomization and cell-type enrichment analyses to link genes to individual cell types, then drew on experimental literature to connect these genes to biological processes (Supplementary Note 12). Colocalization and Mendelian randomization indicated that increased astrocytic expression of KIF21B and decreased oligodendrocytic expression of MAF may increase AD risk, implicating aberrant astrocyte activation and reduced myelination, respectively38,39,40,41. The same analyses linked multiple genes to microglial expression, eight of which are relevant in microglial phagocytosis (INPP5D, SYK, BLNK, HAVCR2, PICALM, AXL, FCER1G and PLCG2)41,42,43,44,45. Among genes contributing to the neuronal enrichment, three (ZKSCAN1, APH1B and SPRED2) were nominally underexpressed in neurons and significantly associated with AD; APH1B encodes part of the γ-secretase complex46, and SPRED2 has been implicated in neural repair47. In summary, we prioritized four biological processes acting through specific cell types and mediated by a small set of genes, providing targets for future experimental models.
Polygenic prediction and heritability
We used the meta-analysis results to estimate \({h}_{{\rm{SNP,liab}}}^{2}\) and improve polygenic prediction. We used SBayesRC with the EUR meta-analysis (excluding proxy cases) and estimated \({h}_{{\rm{SNP,liab}}}^{2}\) at 16% (s.e. = 0.2%; Fig. 4a and Supplementary Data 17). The \({h}_{{\rm{SNP,liab}}}^{2}\) estimate for the proxy-case phenotype was nearly identical. The estimates for the EAS and AFR meta-analyses were 13% (s.e. = 4%) and 10% (s.e. = 6%), respectively (Supplementary Data 17). The APOE-ε4 tagging variant rs429358 alone contributed 6% in EUR and EAS, but only 2% in AFR. These empirical results for APOE in EUR closely match theoretical derivations based on the liability threshold model (Supplementary Note 13). These estimates were based on a commonly used population prevalence of 5%; when using a population prevalence of 20% (for example, in individuals older than 84 years of age2), the \({h}_{{\rm{SNP,liab}}}^{2}\) increased to approximately 25% in EUR (Supplementary Fig. 8). Although the heritability point estimates differ between the populations for both LDSC and SBayesRC, the error bars in AFR and EAS ancestry contain the point estimates for all three populations, preventing conclusions about statistical differences between populations. Both LDSC and SBayesRC heritability estimates for AFR were not significantly different from zero, probably because of reduced power from smaller AFR sample sizes. Despite the larger AFR sample size relative to EAS, AFR populations showed larger standard errors under both methods, probably reflecting the greater genetic diversity and shorter linkage disequilibrium blocks characteristic of AFR ancestry populations, which impose a more complex correlation structure that existing linkage disequilibrium reference panels may incompletely capture. Previous EUR GWAS of AD estimated the \({h}_{{\rm{SNP,liab}}}^{2}\) at approximately 5%4,48 using LDSC and a population prevalence of 5%. Using the EUR case–control meta-analysis, we arrived at a similar estimate of 6% when using LDSC (s.e. = 1%; Fig. 4a).
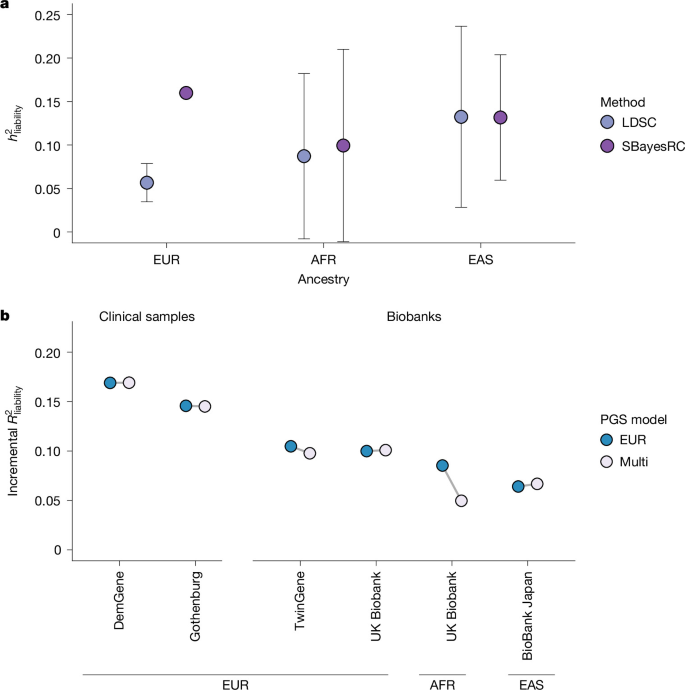
a, Summary-statistics-based analysis of heritability of AD on the liability scale (\({h}_{{\rm{SNP,liab}}}^{2}\)) using LDSC and SBayesRC, assuming a population prevalence of 5%. Estimates are based on the case–control meta-analyses (excluding proxy cases) of EUR (effective sample size of 329,373), AFR (14,555) and EAS (8,034) ancestry. Points are the estimate: for LDSC, the regression estimate with jackknife standard error, and for SBayesRC, the posterior mean across Markov chain Monte Carlo iterations with the posterior standard deviation as standard error. The error bars represent 95% CIs derived from these standard errors. Exact estimates are available in Supplementary Data 17. b, Polygenic prediction performance in held-out clinical and biobank samples (excluding proxy cases). The base model included the first ten principal components, and the model to be evaluated additionally included the PGS. We computed the incremental \({R}_{{\rm{liability}}}^{2}\) as the difference between the models; values are point estimates without empirical standard errors, so no error bars are shown. Two EUR clinical samples (DemGene, and Gothenburg H70 Birth Cohort Studies and Clinical AD from Sweden) and two EUR biobank samples (TwinGene and UKB) were available for prediction. One sample (UKB) was available for prediction in AFR ancestry, and one (BioBank Japan) in EAS ancestry. Sample sizes for each tuning and testing cohort are given in Supplementary Data 20. We applied a leave-one-cohort-out approach, in which the PGS for each testing cohort was constructed using GWAS summary statistics that excluded that cohort. Exact estimates are available in Supplementary Data 19.
The difference in \({h}_{{\rm{SNP}}}^{2}\) estimates between SBayesRC and LDSC was further investigated using simulations based on UK Biobank (UKB) data, mimicking the genetic architecture of AD (Methods). SBayesRC without annotations (as no annotation effects were simulated) showed a small upwards bias when fitting all SNPs as random effects, but produced unbiased estimates when excluding SNPs in linkage disequilibrium with the APOE-ε4 variant (Supplementary Data 18). By contrast, LDSC estimates were substantially downwards biased, consistent with the result from the real data analysis. On the basis of the simulation findings, we conducted real data analysis (as reported above) using the same strategy, that is, fitting the APOE-ε4 variant as a fixed effect and all other SNPs outside the APOE linkage disequilibrium block as random effects in SBayesRC. On the basis of these results, we conclude that LDSC severely underestimates the \({h}_{{\rm{SNP,liab}}}^{2}\) for AD.
We compared the predictive performance of a multi-ancestry (EUR, AFR and EAS) PGS (Methods) to that of a EUR-only PGS. We evaluated the PGSs in hold-out samples of EUR, AFR and EAS ancestry, as well as in clinical samples and biobanks (excluding proxy cases; Methods). We excluded the AMR and SAS ancestries due to admixture, the unavailability of linkage disequilibrium reference panels and small sample sizes. The multi-PGS achieved a maximum incremental \({R}_{{\rm{liability}}}^{2}\) of 16.9% with an average of 12.8% in the EUR cohorts. The prediction in the two clinical samples (14.5% and 16.9%) was higher than in the two biobank samples (9.8% and 10.1%; Fig. 4b and Supplementary Data 19). A PGS based only on EUR proxy cases achieved an average \({R}_{{\rm{liability}}}^{2}\) of 9.6% (Supplementary Fig. 9). We note the \({R}_{{\rm{liability}}}^{2}\) values represent point estimates without empirical standard errors.
The multi-ancestry PGS performed similarly to the EUR PGS in most cohorts, except in the AFR sample of the UKB. This is probably due to heterogeneous APOE effect sizes across ancestries (Extended Data Fig. 5). Because the APOE effect size is smallest in the AFR ancestry, the inclusion of PGSs based on ancestries with larger APOE effects, particularly the EAS ancestry, negatively affects prediction in the AFR ancestry. However, we also note that the AFR sample from the UKB was particularly small (N = 550; Supplementary Data 20).
As expected, both PGSs performed worse in non-EUR cohorts. We note that the majority of the samples in the multi-PGS were of EUR ancestry. Furthermore, we found that the SBayesRC-based PGS is a better predictor than the combined APOE-ε2 and APOE-ε4 counts for all EUR cohorts (Methods and Extended Data Fig. 6).
When applying the PGS (UKB excluded) to unrelated individuals 65 years of age and older of EUR ancestry in the UKB, we found a sevenfold increase in case prevalence in the top 10% PGS group compared with the bottom 10% and a threefold increase when comparing the top 10% to the case prevalence of the whole sample (Extended Data Fig. 7 and Supplementary Data 19). This suggests that individuals with high PGS are at considerably higher risk of developing AD than the general population. Moreover, we found that the PGS is a better predictor of AD in the PGS extremes (top and bottom 10%, area under the curve of 0.74) than in the full sample (area under the curve of 0.69), as has been previously observed49,50.
In conclusion, when compared with previous studies, we obtained higher estimates of \({h}_{{\rm{SNP,liab}}}^{2}\) and demonstrated that a PGS derived from our meta-analysis explains a substantial and larger proportion of this heritability.
Discussion
We conducted a large common variant analysis of AD and identified 127 independent loci, of which 48 were new. We applied multiple methodologies to prioritize genes in each locus, many of which were linked to pathways previously implicated in AD, most notably immune processes, microglia function and amyloid catabolism.
Our cell-type analyses using RNA sequencing data showed enrichment in microglia, a well-established finding4,5. However, we also found that genes overexpressed in microglia and genes underexpressed in neurons in cases compared with controls were enriched for GWAS signal, expanding earlier work4. This suggests that AD risk variants may lead to overexpression of microglia genes and underexpression of neuronal genes. This is supported by previous transcriptomic and epigenomic studies that have identified downregulation of neuronal functions and upregulation of innate immune response as relevant to AD51,52. Of the three types of neurons significantly underexpressing AD genes in cases (Sncg, Sst and L6 IT Car3), Sncg and Sst neurons have been previously shown to be vulnerable early on in the AD disease process53,54. This suggests that the variants associated with AD in this GWAS may influence gene expression in vulnerable neuronal subtypes, leading to neuronal cell death. Among the genes prioritized for the neuronal enrichment signal, we identified one linked to App processing (APH1B)46 and another implicated in post-brain injury repair in zebrafish (SPRED2)47. It is unclear whether the neuronal enrichment reflects a primary or secondary disease process.
AD remains a challenging disease to treat. Although new disease-modifying drugs have recently been approved, their effectiveness remains a subject of dispute7, and new avenues need to be explored that go beyond amyloid clearance. Here we highlighted five potential drug targets among the new genes that we identified. Two of these (SYK and AXL) are involved in the immune response to amyloid-β. Existing treatments targeting these genes have shown promise in AD mouse models11,55. These genes, along with other known AD genes (BLNK, INPP5D, FCER1G and PLCG2)42 and a new gene prioritized in this study (CEBPA)22, have been suggested to have a role in microglial phagocytosis, a potential therapeutic avenue complementary to amyloid clearance. In addition, we identified that UBE2V1 and SPATA2 may be relevant to multiple neurodegenerative diseases, pointing to shared mechanisms of neurodegeneration as therapeutic targets.
The SBayesRC estimate of \({h}_{{\rm{SNP,liab}}}^{2}\) (16%) in EUR is substantially higher than the LDSC estimate (6%). LDSC is downwards biased for AD: the APOE-ε4 variant alone explains 6% of the variance on the liability scale, and the regression framework of LDSC implicitly assumes a highly polygenic architecture with normally distributed effect sizes, an assumption poorly suited to the more oligogenic architecture of AD. SBayesRC instead models a mixture of effect-size distributions that accommodates the large-effect APOE locus, and additionally incorporates functional annotations; we expect this to be the principal reason for the higher estimate. After excluding SNPs in linkage disequilibrium with APOE-ε4, our SBayesRC estimate was unbiased in simulations, providing a conservative estimate of \({h}_{{\rm{SNP,liab}}}^{2}\) under the assumption of no additional genetic variation in linkage disequilibrium with APOE. Our PGS achieved an average incremental \({R}_{{\rm{liability}}}^{2}\) of 13%, which exceeds the LDSC \({h}_{{\rm{SNP,liab}}}^{2}\) estimate, its theoretical upper limit, and further underscores that LDSC substantially underestimates \({h}_{{\rm{SNP,liab}}}^{2}\) in AD.
Our multi-ancestry study encompassed 2.8 million individuals, including 8,673 cases, 15,005 proxy cases, 105,525 controls and 116,426 proxy controls of non-EUR ancestry. Nonetheless, the proportion of non-EUR samples was still relatively low, which made the findings of ancestry-specific effects and the PGS prediction performance in non-EUR samples less precise. Future studies including more individuals of non-EUR ancestry are essential to improve equity in AD genomic research. To accelerate this process, we have made the summary statistics from our ancestry-specific meta-analyses publicly available, as well as sex-stratified and phenotype-stratified (case–control versus proxy) summary statistics, X chromosome summary statistics, and data excluding the UKB and cohorts included in previous GWAS.
Our study included 74,141 proxy cases (40% of total cases) with the goal of boosting power, which yielded 32 additional genome-wide significant loci. The use of proxy cases is particularly valuable for AD, given its late-onset nature: biobanks predominantly recruit participants younger than the typical age of AD onset (most cases occur after 65 years of age) but can report parental diagnoses through family history questionnaires. Although a recent study has suggested that including such AD proxy cases can introduce some statistical bias, this appears to be limited to genetic correlation analyses, particularly for educational attainment, with no observed effect on locus discovery, which is our primary aim. The proportion of proxy cases varied by ancestry: 37% in EUR samples, 63% in AFR, 62% in EAS, 68% in AMR and 82% in SAS. This disparity reflects differential data accessibility: non-EUR samples were derived primarily from national biobanks with family history data and liberal data access policies, whereas established clinical networks in Europe facilitated direct case ascertainment in EUR populations from hospitals and memory clinics.
In conclusion, we identified 127 AD risk loci that implicate several new genes, reveal new molecular and cellular mechanisms with potential for future drug development, and improve PGS prediction and heritability estimates.
Methods
Ethics statement
The GWAS meta-analyses used de-identified summary-level data contributed by participating cohorts. Individual-level data were analysed for polygenic prediction (DemGene, the Gothenburg H70 Birth Cohort Studies and Clinical AD from Sweden, TwinGene, UKB and BioBank Japan) and for the simulation study (UKB), in each case under the data access approvals of the relevant cohort; UKB data were accessed under application nos. 16406 and 18177. Ethics approval was obtained by each cohort that collected data and contributed to this study, and the approving committee for each cohort is presented in Supplementary Methods. All participants consented to the research, and this research was performed in accordance with all relevant guidelines and regulations.
Quality control of individual-level data
Newly participating cohorts received an analysis plan detailing quality control, principal component analysis, imputation, phenotype definitions, GWAS models and results formats (Supplementary Methods). In brief, pre-imputation quality control followed RICOPILI56 guidelines, namely, removal of SNPs with a call rate lower than 0.98, palindromic SNPs with MAF higher than 0.3, invariant and multi-allelic SNPs, SNPs with Hardy–Weinberg equilibrium P value in controls smaller than 1 × 10⁶, and SNPs with Hardy–Weinberg equilibrium P value in cases smaller than 1 × 10¹⁰. Individuals were removed if their call rate was smaller than 0.98, their inbreeding coefficient was outside the range of −0.2 to 0.2, or where the genetic sex was not concordant with the reported sex. We note that many cohorts performed quality control independently from this analysis plan. Detailed descriptions and divergences are provided in the Supplementary Methods.
Quality control of GWAS summary statistics
Every set of summary statistics underwent a standardized quality control protocol. Because the majority of summary statistics were on genomic build 37, we used this as the consensus build. All other summary statistics on build 38 were lifted to 37 using the snp_modifyBuild() function in the bigsnpr package57. snp_modifyBuild() does not account for strand changes between genomic builds, which we manually corrected. We removed SNPs with missing values, indels, duplicated, multi-allelic or monomorphic SNPs, SNPs with MAF below 0.001, SNPs with nonsense values, palindromic SNPs with MAF larger than 0.4, SNPs with allele frequency differences larger than 0.2 with a reference sample, or SNPs with INFO scores below 0.6 for dosage and 0.8 for hardcall data.
Case and control definitions
We applied the following AD definition for most cohorts; however, there was heterogeneity in how AD was ascertained across studies. Details on the specific definition used in each cohort are provided in the Supplementary Methods. AD cases were defined based on ICD-10 codes (G30, F00* and F03) or clinical diagnosis. When possible, to minimize the inclusion of familial (Mendelian) AD cases, individuals with an age of onset of younger than 40 years of age were excluded. If age-of-onset data were unavailable, we used age at assessment, prioritizing the earliest visit at which the individual was identified as a case. Detailed age and sex information can be found in Supplementary Data 21. Controls (coded as 0) were defined as individuals with no diagnosis or self-reported history of AD, dementia or mild cognitive impairment (ICD-10: G30, F00*, F03 and F06.7), nor any other neurodegenerative disorders (ICD-10: G20–G26, G31–G32, G35–G37, G10–G14 and F02). Parental diagnoses were also considered, and individuals with a parent affected by any of these conditions were excluded from the study. Wherever possible, we aimed to include at least four times as many controls as cases in each GWAS to maximize power. This strategy resulted in several cohorts including controls below the typical age of onset, which risks misclassifying future cases as controls and may attenuate statistical power. However, published simulation work has demonstrated that, at a population prevalence of 5%, a large set of unscreened controls yields greater power than a smaller set of screened controls at half the sample size58.
Proxy-case analysis
Individuals with first-degree relatives with AD will, on average, carry half of the alleles that affect the risk of AD. As such, genotyped individuals can be used as proxies for their affected first-degree relatives, even though they are not affected themselves. In the present study, a participant was designated a proxy case (coded as 1) if either their mother or father was reported to have AD or dementia. If the genotyped individuals are themselves AD cases, we excluded them from this analysis. We ran the GWAS separately in individuals who reported their mothers versus their fathers to have AD, and meta-analysed the resulting summary statistics59. If genotyped individuals reported both their parents to have AD, one-half were randomly assigned to the paternal, and the other half to the maternal GWAS. Resulting GWAS effect sizes and standard errors were multiplied by 2 to correct for proxy status and transform them to the same scale as the case–control GWAS60. We found the proxy GWAS effect sizes after transformation to be well calibrated (Supplementary Fig. 10).
GWAS analysis
A GWAS was run if at least 100 cases or 200 proxy cases were available for analysis. When several ancestries were available, a GWAS was run separately in each ancestry. In the main analysis, we used the following regression model correcting for sex, age, principal components (PCs) and other study-specific covariates:
$${\rm{AD}} \sim {\rm{variant}}+{\rm{sex}}+{\rm{age}}+{{\rm{age}}}^{2}+{\rm{age}}\times {\rm{sex}}+{{\rm{PCs}}}_{1-20}+{\rm{study}}-{\rm{specific}}\,{\rm{covariates}}$$
In the sex-stratified analyses, we use the following regression model:
$${{\rm{AD}}}_{{\rm{males}}|{\rm{females}}} \sim {\rm{variant}}+{\rm{age}}+{{\rm{age}}}^{2}+{{\rm{PCs}}}_{1-20}+{\rm{study}}-{\rm{specific}}\,{\rm{covariates}}$$
Not all cohorts had the same information available for every individual. As such, slightly different models were applied in some cohorts. Details for each cohort can be found in the Supplementary Methods.
GWAS meta-analysis
We used METAL (v2020-05-05) to run all inverse-variance weighted fixed-effect meta-analyses. For the main analyses, we first ran ancestry-stratified and phenotype-stratified (that is, case–control versus proxy) meta-analyses. Subsequently, we meta-analysed all ancestries within the same phenotype definitions. Finally, we meta-analysed the case–control and proxy summary statistics within and across all ancestries. After having performed all meta-analyses on unfiltered summary statistics, the results were filtered for SNPs with at least 60% of the maximum effective sample size in a given set.
Effective sample size
The effective sample size (Neff) is the size of a balanced case–control study (ratio 1:1) that would yield the same statistical power as the actual study with an imbalanced case–control ratio. It is calculated as the sum of Neff for each cohort61, where \({N}_{\mathrm{eff}}=\,\frac{4}{\frac{1}{{N}_{\mathrm{case}}}\,+\,\frac{1}{{N}_{\mathrm{control}}}}\). For samples with proxy cases, Neff was further divided by 4 (ref. 60).
FLAMES
We fine-mapped genome-wide significant loci with the PolyFUN (v1.0.0)62 implementation of SuSiE63. Because of the nature of large meta-analyses and the sharing restrictions present on raw genetic data, the generation of in-sample linkage disequilibrium reference panels is infeasible. We therefore restricted fine-mapping to a single causal variant per locus. MAGMA64 scores were generated using the SNP-wise mean model with an ancestry-matched reference panel from the UKB and with a reference panel of all individuals included in the 1000 Genomes Project (analysis implemented in FUMA v1.8.3). The UKB reference panels consisted of random sets of 10,000 individuals of each ancestry in the UKB65. For ancestries with fewer individuals, all were used. For the multi-ancestry UKB reference panel, 10,000 individuals were selected such that the proportion of each ancestry matched that of the multi-ancestry GWAS. PoPS (v0.1)66 scores were generated for each ancestry, using their corresponding MAGMA scores as input. Credible set annotation and effector gene prediction were performed using FLAMES (v1.1.2). Credible sets were annotated with the MAGMA and PoPS scores matching the ancestry of the summary statistics from which the credible set was derived. Genes selected by FLAMES for each locus were reported from four FLAMES analyses: multi-ancestry summary statistics using 1000 Genomes and UKB reference panel, and EUR-only summary statistics using the 1000 Genomes and UKB reference panel.
Colocalization and Mendelian randomization
To identify potential risk genes driven by GWAS signals in non-coding regions, we implemented a multi-faceted approach integrating molecular quantitative trait loci (QTL) colocalization analysis and Mendelian randomization67. First, we defined the boundaries of each GWAS locus by identifying all SNPs in linkage disequilibrium (r2 > 0.1) with the lead GWAS SNP. This linkage disequilibrium analysis was based on the EUR population from the 1000 Genomes Project phase 3, utilizing LDlink68. Next, for each locus, we performed colocalization analysis to assess whether the GWAS signal shared a causal variant with molecular QTLs (eQTLs for gene expression, sQTLs for splicing and pQTLs for protein abundance). We considered all genes for which QTL association data were available for the SNPs within the defined locus boundaries. This analysis was conducted using the coloc R package69 under the assumption of a single causal variant per signal. We leveraged a comprehensive set of QTL datasets from relevant human brain tissues or cell types70,71,72,73,74,75,76,77,78,79,80,81. Following colocalization, we performed two-sample Mendelian randomization to infer a potential causal relationship between the gene’s expression, splicing or protein level and AD. For each gene that showed evidence of colocalization, the top associated eQTL, sQTL or pQTL from the respective study was used as the genetic instrument. A gene was considered a high-confidence candidate if it met three stringent criteria: (1) strong evidence of colocalization between the GWAS signal and the gene’s expression, splicing or protein level, defined as a posterior probability of a shared signal (PP.H4.abf) of 0.8 or greater; (2) a statistically significant Mendelian randomization result after correcting for multiple testing across all genes with PP.H4 ≥ 0.8 (false discovery rate < 0.05); and (3) the transcription start site of the gene was located within 500 kb of the lead GWAS SNP. We performed the same colocalization and Mendelian randomization analyses on the loci shared with amyotrophic lateral sclerosis and Parkinson’s disease using summary statistics from van Rheenen et al.82 and Nalls et al.26, respectively.
Common and rare variant GWAS literature search
To identify which loci and genes have been reported in previous literature, we conducted a literature search of all GWAS of AD listed in the GWAS Catalog, which yielded 206 studies (https://www.ebi.ac.uk/gwas/efotraits/MONDO_0004975; accessed 7 October 2024). We then filtered these for common variant GWAS where AD was the primary phenotype, resulting in 49 studies (Supplementary Data 3). Next, we extracted all significant lead SNPs (P < 5 × 10⁻⁸) reported in these studies and the genes assigned to them. We defined 250-kb windows around the lead SNPs and merged overlapping windows into single loci. This yielded a final set of 174 non-overlapping loci identified in previous AD GWAS (Supplementary Data 3). We were also interested in whether our common variant GWAS implicated the same genes as previous rare variant studies of AD. We created a list of rare variant studies of AD (largely based on two reviews83,84). We identified 32 studies that highlighted 25 genes (Supplementary Data 4).
Drug–gene interaction analysis
To investigate the potential translational relevance of genes prioritized in our AD GWAS, we performed a systematic drug–gene interaction analysis using the Drug–Gene Interaction Database (DGIdb; ref = 82)85, a curated compendium of interactions collated from multiple evidence sources. The input comprised prioritized effector genes derived from our genetic and post-GWAS annotation pipeline. These genes were queried against DGIdb to retrieve all reported drug–gene interaction pairs, yielding an initial set of 1,525 interactions.
To focus on interactions of potential therapeutic significance, we applied the following criteria. First, we retained only drugs with documented approval by major regulatory agencies, specifically the US Food and Drug Administration or the European Medicines Agency; approval status was taken from DGIdb annotations and cross-referenced with authoritative regulatory records. Second, we filtered on DGIdb’s interaction confidence metric, retaining pairs with an interaction score ≥ 0.1 to exclude low-confidence associations while preserving interactions supported by at least minimal evidence. The final curated set comprised 220 approved drug–gene interactions (Supplementary Data 11), representing drugs with established regulatory status and evidence for interaction with prioritized AD-implicated genes.
For interpretative context, drugs in the curated set were assigned to broad mechanistic categories reflecting their primary mode of action or their relevance to biological processes implicated in AD (for example, cholinergic signalling, amyloid homeostasis, lipid metabolism, vascular regulation and neuroinflammation) based on documented mechanism-of-action information and literature review. Full interaction results and drug categorizations are provided in Supplementary Data 11.
Polygenic prediction using SBayesRC
SBayesRC86 is a Bayesian hierarchical mixture model for polygenic prediction, jointly fitting genome-wide SNPs and incorporating various functional genomic annotations into the estimation of SNP effects. We applied SBayesRC to GWAS summary statistics of AD from different ancestry groups, along with linkage disequilibrium matrices derived from reference samples of the same ancestry in the UKB65, and 96 functional annotations from the BaselineLD model (v2.2)87. These annotations include evolutionary conservation, functional roles of DNA sequence (for example, coding, promoters and enhancers), and linkage disequilibrium or MAF-related features. In SBayesRC, the annotations inform the probabilities that a SNP has zero, small or large effects, with both annotation and SNP effects estimated using Markov chain Monte Carlo (MCMC). We ran SBayesRC using 4 independent MCMC chains, each with 5,000 iterations, discarding the first 3,000 as burn-in. The SNP effect estimates were obtained as posterior means across iterations and chains. As SBayesRC accounts for linkage disequilibrium between SNPs, all SNPs were included in the prediction equation. For cross-ancestry prediction, we first estimated SNP effects separately within each ancestry group, then linearly combined the ancestry-specific effect estimates using a tuning sample from the target ancestry and finally applied the combined SNP effects to the testing data (see Supplementary Data 20 for the tuning and testing sample sizes).
We computed PGSs based on the SBayesRC posterior means using PLINK1.9 (version Linux 64-bit 6 June 2021; command ‘--score <variant ID column> <effect allele column> <posterior mean beta> sum center’). To evaluate prediction, we used the coefficient of determination on the liability scale (\({R}_{\mathrm{liability}}^{2}\)). We converted the R2 from the observed scale to the liability scale based on the transformation introduced in Lee et al.88. The base model included the first ten principal components, and the model to be evaluated additionally included the PGS. We computed the incremental \({R}_{\mathrm{liability}}^{2}\) as the difference between the models. Note that we did not include other covariates, such as age and sex, in the PGS analyses because doing so can lead to collider bias and reduce power in ascertained samples89,90 (the case ratio in the clinical samples was up to 43%).
We evaluated the PGSs in five cohorts: DemGene, Gothenburg H70 Birth Cohort Studies and Clinical AD from Sweden, TwinGene, UKB and BioBank Japan. DemGene and Gothenburg H70 Birth Cohort Studies and Clinical AD from Sweden are clinical samples, where AD status was ascertained in memory clinics in Norway and Sweden. TwinGene, UKB and BioBank Japan are biobanks with limited phenotypic appraisal. A sixth cohort available for prediction, STSA, was excluded because it did not clearly fall into either the clinical or biobank category, representing a mixture of both. We applied a leave-one-cohort-out approach, in which the PGS for each testing cohort was constructed using GWAS summary statistics that excluded that cohort. More details for each cohort can be found in the Supplementary Methods.
We compared the prediction of the PGS to APOE counts. APOE-ε4 dosage is fully determined by the count of the T allele at SNP 19:45411941:C:T (rs429358). Similarly, the number of T alleles at SNP 19:45412079:C:T (rs7412) determines the dosage of APOE-ε2. We included both counts as predictors in a regression.
SNP-based heritability estimation using SBayesRC
Besides SNP effects, SBayesRC provides estimates of genetic architecture parameters, including SNP-based heritability (\({h}_{\mathrm{SNP}}^{2}\)). To estimate \({h}_{\mathrm{SNP}}^{2}\) on the liability scale, we first converted GWAS marginal effects obtained from logistic regression (blogit) to the liability scale using \({b}_{l}={b}_{\mathrm{logit}}\times K\times (1-K)/z\), where K is the population lifetime prevalence (set to 0.05), and z = dnorm(qnorm(K)). Given the allele frequency (p) in the linkage disequilibrium reference samples, we estimated the sample size on the liability scale by \({n}_{l}=(1-2p(1-p)\times {b}_{l}^{2})/(2p(1-p)\times {\mathrm{se}}_{l}^{2})\) for each SNP. We then ran SBayesRC using bl, nl and p as input. The SNP-based heritability (\({h}_{\mathrm{SNP}}^{2}\)) on the liability scale was calculated in each MCMC iteration as β′Rβ, where β is the vector of sampled SNP effects and R is the linkage disequilibrium correlation matrix. As shown in the simulation study, a small inflation in the \({h}_{\mathrm{SNP}}^{2}\) estimation could occur when including SNPs in linkage disequilibrium with the APOE-ε4 tagging SNP (rs429358), probably due to a combination of the large effect of the APOE-ε4 allele and the imperfect approximation of linkage disequilibrium correlation to the correlation between logistic regression coefficient estimates. To avoid the potential inflation, we therefore fit rs429358 as a fixed effect and all other SNPs as random, excluding SNPs in the same linkage disequilibrium block of rs429358 from the model. Linkage disequilibrium blocks were defined based on the quasi-independent linkage disequilibrium blocks in the human genome91, merging small blocks to have a minimum size of 2 cM. We estimated the total \({h}_{\mathrm{SNP}}^{2}\), fixed-effect \({h}_{\mathrm{SNP}}^{2}\) and random-effect \({h}_{\mathrm{SNP}}^{2}\). The posterior mean across MCMC iterations was reported as the estimate of \({h}_{\mathrm{SNP}}^{2}\), and the posterior standard error was calculated as the standard deviation of the MCMC samples. To assess convergence, we computed the potential scale reduction factor92 based on four independent chains.
Simulation based on UKB data
To investigate the difference in \({h}_{\mathrm{SNP}}^{2}\) estimate between LDSC and SBayesRC, we simulated a phenotype whose genetic architecture mirrors that of AD and controls in 348,494 unrelated participants of the European ancestry in the UKB with a disease prevalence of 5% (that is, 17,424 cases and 331,070 controls) and an \({h}_{\mathrm{SNP}}^{2}\) of 12% with the APOE-ε4 tagging SNP (rs429358) accounting for 6% of the \({h}_{\mathrm{SNP}}^{2}\) and another 1,000 SNPs randomly selected across the autosomes for the other 6% of the \({h}_{\mathrm{SNP}}^{2}\). Under the additive model, individual liabilities were computed as the sum of allelic effects across all causal variants, plus Gaussian noise scaled to achieve the target heritability. The 5% of individuals with the highest liabilities were classified as cases. Simulations were replicated five times using the GCTA software (v1.95.1)93. GWAS were performed on the simulated binary phenotype using logistic regression implemented in PLINK2 (ref. 94). We first converted GWAS marginal effects and standard errors from logistic regression and sample size to the liability scale using \({b}_{l}={b}_{\mathrm{logit}}K(1-K)/z\), \({\mathrm{se}}_{l}={\mathrm{se}}_{\mathrm{logit}}K(1-K)/z\) and \({n}_{l}=\mathrm{348,494}\times {z}^{2}/(K(1-K))=\mathrm{78,040}\) following Yang et al.95. Then, we ran SBayesR to estimate \({h}_{\mathrm{SNP}}^{2}\) of the simulated phenotypes of the five replicates. We also ran SBayesR by considering the APOE-ε4 tagging SNP (rs429358) as fixed effects and skipping SNPs with a linkage disequilibrium r2 > 0.001 with rs429358 or skipping all variants in the same linkage disequilibrium block containing rs429358 while taking all other variants as random effects. We used 10,000 unrelated individuals of EUR ancestry in the UKB as a linkage disequilibrium reference sample, same as in the empirical analysis. For LDSC, we first estimated \({h}_{\mathrm{SNP}}^{2}\) of the simulated phenotypes using linkage disequilibrium scores of the HapMap3 variants; as rs429358 is absent in the HapMap3 linkage disequilibrium scores files, we also ran LDSC using the full linkage disequilibrium scores (not restricted to the HapMap3 variants) prepared by the pan-UK Biobank Project96 (https://pan-dev.ukbb.broadinstitute.org/).
Global genetic correlation analysis using SBayesRC
We performed sex-stratified SBayesRC analyses and obtained posterior means of SNP effect sizes. During each MCMC iteration, we computed the correlation between these SNP effects in male and female individuals, and estimated the posterior mean and standard deviation of the global genetic correlation as the mean and standard deviation of these correlations across all iterations. This approach may underestimate the true correlation because linkage disequilibrium can lead to different but correlated SNPs being selected in male and female individuals within a given iteration. Thus, the estimated correlation should be regarded as a lower bound of the true global genetic correlation.
Local genetic correlation analysis
We aimed to use local genetic correlations with traits relevant for AD to help explain the associations of the new loci with AD. We first lifted over the locus boundaries of the new loci to build GRCh37 from GRCh38 using the UCSC liftover tool97. Next, we queried the GWAS Catalog98 (version e114_r2025-05-1) to find neurodegenerative phenotypes reported as having an association within the locus. We used the available summary statistics from EUR ancestry individuals for these traits for a local genetic correlation analysis with AD using LAVA99. For each summary statistics file, we removed SNPs with a sample size smaller than 60% of the maximum sample size. For dichotomous disease traits, we used the effective sample size (Neff) as input in the summary statistic file, and defined the case and control sample sizes in the LAVA info files as \(\frac{{N}_{\mathrm{eff}}}{2}\). To account for potential sample overlap, we supplied the intercepts from cross-trait LDSC100 to LAVA. We used the European 1000 Genomes sample as a linkage disequilibrium reference panel and defined the LAVA locus file based on the GWAS loci. We only computed local genetic correlations for locus pairs with sufficient genetic signal. To this end, we applied a \({h}_{\mathrm{local}}^{2}\) threshold of P < 0.05.
Gene set and cell-type analyses
We used MAGMA (v1.10)64 to perform gene set enrichment and cell-type enrichment analyses. We performed these analyses using the gene-level associations from the FLAMES analysis using the UKB reference panel. As a sensitivity analyses, we also reported the P value of all significant findings when using the gene-level associations derived from using the 1000 Genomes data as a reference panel. The gene-level analysis results used for gene set and cell-type enrichment analyses were the same gene-level analysis results (snp-wise = mean) used for gene prioritization (FLAMES).
We performed gene set enrichment analyses for all of the gene sets included in MSigDB101 (v2024.1.Hs) C2 (curated), C5 GO (Gene Ontology), C7 (immunological) gene set groups, and the SynGO102 (v20231201) gene sets. The MSigDB gene sets were downloaded as gene symbols and converted to Ensembl gene IDs using BioMart103. We excluded gene sets with fewer than 10 genes; this resulted in a total of 18,782 tested gene sets. We then selected gene sets based on a false discovery rate of 5% using the Benjamini–Hochberg procedure. As a sensitivity analysis for the effect of APOE, we performed the gene set analysis with the whole of chromosome 19 excluded. We performed pairwise conditional analysis with MAGMA to calculate how much of each association could be explained by the other gene sets \(\frac{-{\log }_{10}({P}_{{\rm{m}}\text{arg}\mathrm{inal}})--{\log }_{10}({P}_{\mathrm{conditioned}})}{-{\log }_{10}({P}_{{\rm{m}}\text{arg}\mathrm{inal}})}\).
This proportion of explained association was then used to cluster the gene sets by edge betweenness (cluster_edge_betweenness in the R package igraph104). Only connections between gene sets in which more than 30% of the marginal association was explained by the other gene set were included in the clustering. Clusters of gene sets were assigned names based on the function of the gene sets that make up the cluster.
We performed MAGMA gene property analysis using FUMA (v1.7)105 to highlight cell types relevant to AD. We tested whether the gene expression pattern of a cell type was significantly correlated with the association of the genes with AD. This regression model included the average gene expression for that tissue as a covariate. The association test was one-sided, only considering a positive relationship between gene expression and AD association. We tested this across four brain datasets: Siletti et al.106 hippocampus (datasets 59−69 level 2); Allen Human Brain Atlas107 (Allen_human_MTG_level2); GSE168408 human prefrontal cortex108 (GSE168408_human_prefrontal_cortex_level2_adult); and PsychENCODE109 (PsychENCODE_adult). We performed the full three-step procedure outlined by FUMA to identify cell types associated with AD after conditioning on associations within and between datasets. We selected significant cell types in step 1 using Bonferroni correction for 337 cell-type dataset pairs. As a sensitivity analysis for the effect of APOE, we performed gene property analysis excluding the whole of chromosome 19.
We also used MAGMA gene property analysis to highlight cell types where differentially expressed genes across AD cases and controls were enriched for AD GWAS signal. We extracted gene differential expression P values per cell type from Nakatsuka et al.37 (SumRank upregulation and downregulation from supplementary data 3 of that study). We used the −log10(P) of the differential upregulation and downregulation analyses from each cell type as the gene property for the MAGMA gene property analysis. As with the FUMA cell-type analysis, we tested whether more significant differential expression was associated with increased association in the AD GWAS. As a sensitivity analysis, we included the average association of each gene across all cell types as a covariate. Differential expression P values of 0 were converted to 1 × 10⁻¹⁰ to avoid infinite values of −log10(P). The differential expression P values were originally calculated with permutations leading to some values being capped at 0, so 1 × 10⁻¹⁰ was chosen as a P value small enough to be beyond the calculation of the permutations but close to the boundary. Gene symbols were converted to Ensembl gene ID using BioMart103. As a sensitivity analysis for the effect of APOE, we performed the gene property analysis with the whole of chromosome 19 excluded.
We performed MAGMA gene set enrichment analyses to determine whether genes linked to specific microglia states were enriched for AD GWAS association. We extracted the gene sets that were used to define the 12 microglial states from Sun et al.110 (extracted from supplementary data 2 of that study). Again, we removed chromosome 19 as a sensitivity analysis. Gene sets associated with clusters identified from StringDB analysis of the genes listed in Table 1 is available in Supplementary Data 22.
METASOFT
To assess whether effect sizes were heterogeneous across ancestries, we applied METASOFT (v2.0.1)111 to genome-wide significant loci identified in the primary meta-analysis. METASOFT is a random-effects meta-analysis framework specifically designed to detect and quantify heterogeneity in genetic associations across multiple studies or populations. Unlike fixed-effects approaches that assume a single true effect size shared across all studies, METASOFT’s RE2 (random effects) model allows effect sizes to vary across populations and explicitly models this between-study heterogeneity using a random-effects variance component (τ2). The RE2 model estimates the probability that an effect exists in each individual study while simultaneously testing for overall association across all studies, making it particularly well-suited for identifying ancestry-specific or population-stratified genetic effects.
Reporting summary
Further information on research design is available in the Nature Portfolio Reporting Summary linked to this article.
Data availability
Summary statistics are available for download (https://cncr.nl/research/summary_statistics/). This includes the multi-ancestry meta-analysis and ancestry-specific meta-analyses (EUR, AFR, EAS, AMR and SAS), each additionally stratified by sex (male, female) and by phenotype definition (case–control, proxy), as well as X chromosome summary statistics, versions excluding the UKB and a meta-analysis restricted to cohorts not included in previous AD GWAS. All summary statistics exclude data from the 23andMe Research Institute. The majority of individual-level genotype and phenotype data analysed in this study cannot be made publicly available, as they are governed by the consent, data protection and data transfer agreements of the contributing cohorts. Access to individual-level data must be requested directly from each cohort; details for each cohort are provided in the Supplementary Methods. This study used the following publicly available resources: DGIdb v5.0 (https://dgidb.org/); FUMA v1.8.3 (https://fuma.ctglab.nl/); the GWAS Catalog (https://www.ebi.ac.uk/gwas/efotraits/MONDO_0004975, accessed 7 October 2024); MSigDB v2024.1.Hs (https://www.gsea-msigdb.org/gsea/msigdb); SynGO v20231201 (https://www.syngoportal.org/); the BaselineLD model v2.2; 1000 Genomes Project phase 3; HapMap3 and pan-UKB linkage disequilibrium scores (https://pan-dev.ukbb.broadinstitute.org/); and Ensembl BioMart. Cell-type expression data were obtained from Siletti et al.106, the Allen Human Brain Atlas, GSE168408 and PsychENCODE; differential expression data from Nakatsuka et al.37; and microglial state gene sets from Sun et al.110. Summary statistics for amyotrophic lateral sclerosis and Parkinson’s disease were obtained from van Rheenen et al.82 and Nalls et al.26, respectively. UKB data were accessed under application nos. 16406 and 18177. Forest plots for each locus are available on Zenodo9 (https://doi.org/10.5281/zenodo.22791372).
References
Nichols, E. et al. Estimation of the global prevalence of dementia in 2019 and forecasted prevalence in 2050: an analysis for the Global Burden of Disease Study 2019. Lancet Public Health 7, e105–e125 (2022).
Gatz, M. et al. Role of genes and environments for explaining Alzheimer disease. Arch. Gen. Psychiatry 63, 168–174 (2006).
Holland, D. et al. Beyond SNP heritability: polygenicity and discoverability of phenotypes estimated with a univariate Gaussian mixture model. PLoS Genet. 16, e1008612 (2020).
Wightman, D. P. et al. A genome-wide association study with 1,126,563 individuals identifies new risk loci for Alzheimer’s disease. Nat. Genet. 53, 1276–1282 (2021).
Bellenguez, C. et al. New insights into the genetic etiology of Alzheimer’s disease and related dementias. Nat. Genet. 54, 412–436 (2022).
Zhang, Q. et al. Risk prediction of late-onset Alzheimer’s disease implies an oligogenic architecture. Nat. Commun. 11, 4799 (2020).
Digma, L. A., Winer, J. R. & Greicius, M. D. Substantial doubt remains about the efficacy of anti-amyloid antibodies. J. Alzheimers Dis. 97, 567–572 (2024).
Baker, E. et al. What does heritability of Alzheimer’s disease represent? PLoS ONE 18, e0281440 (2023).
Uffelmann, E. PGC-ALZ3 v2.2. Zenodo https://doi.org/10.5281/zenodo.22791372 (2026).
Brokate-Llanos, A. M. et al. Ribonucleotide reductase inhibition improves the symptoms of a Caenorhabditis elegans model of Alzheimer’s disease. G3 14, jkae040 (2024).
Stuchbury, G., Ko, A. & Dymock, B. A brain penetrant small-molecule SYK inhibitor for the treatment of Alzheimer’s and neuroinflammatory diseases. Alzheimers Dement. 19, e082900 (2023).
Wang, S. et al. TREM2 drives microglia response to amyloid-β via SYK-dependent and -independent pathways. Cell 185, 4153–4169.e19 (2022).
Kerr, F. et al. Direct Keap1-Nrf2 disruption as a potential therapeutic target for Alzheimer’s disease. PLoS Genet. 13, e1006593 (2017).
Lawlor, B. et al. Nilvadipine in mild to moderate Alzheimer disease: a randomised controlled trial. PLoS Med. 15, e1002660 (2018).
Chen, G., Ozturk, G., Porta, S. & Lee, V. M.-Y. Evaluate the efficacy of the Axl inhibitor bemcentinib in the 5×FAD mouse model of Alzheimer’s disease. Alzheimers Dement. 20, e089525 (2024).
Bayer, T. A. Pyroglutamate Aβ cascade as drug target in Alzheimer’s disease. Mol. Psychiatry 27, 1880–1885 (2022).
Coimbra, J. R. M., Moreira, P. I., Santos, A. E. & Salvador, J. A. R. Therapeutic potential of glutaminyl cyclases: current status and emerging trends. Drug Discov. Today 28, 103644 (2023).
Zhang, H. et al. The retromer complex and sorting nexins in neurodegenerative diseases. Front. Aging Neurosci. 10, 79 (2018).
von Einem, B. et al. The Golgi-localized γ-ear-containing ARF-binding (GGA) proteins alter amyloid-β precursor protein (APP) processing through interaction of their GAE domain with the β-site app cleaving enzyme 1 (BACE1). PLoS ONE 10, e0129047 (2015).
Cai, X., Xing, J., Long, C. L., Peng, Q. & Humphrey, M. B. DOK3 modulates bone remodeling by negatively regulating osteoclastogenesis and positively regulating osteoblastogenesis. J. Bone Miner. Res. 32, 2207–2218 (2017).
Peng, Q., Long, C. L., Malhotra, S. & Humphrey, M. B. A physical interaction between the adaptor proteins DOK3 and DAP12 is required to inhibit lipopolysaccharide signaling in macrophages. Sci. Signal. 6, ra72 (2013).
Kim, S.-M. et al. TREM2 promotes Aβ phagocytosis by upregulating C/EBPα-dependent CD36 expression in microglia. Sci. Rep. 7, 11118 (2017).
Chung, J. et al. Genome-wide pleiotropy analysis of neuropathological traits related to Alzheimer’s disease. Alzheimers Res. Ther. 10, 22 (2018).
Didonna, A. & Opal, P. The promise and perils of HDAC inhibitors in neurodegeneration. Ann. Clin. Transl. Neurol. 2, 79–101 (2015).
Jansen, I. E. et al. Genome-wide meta-analysis for Alzheimer’s disease cerebrospinal fluid biomarkers. Acta Neuropathol. 144, 821–842 (2022).
Nalls, M. A. et al. Identification of novel risk loci, causal insights, and heritable risk for Parkinson’s disease: a meta-analysis of genome-wide association studies. Lancet Neurol. 18, 1091–1102 (2019).
Chen, K. et al. Identifying risk loci for FTD and shared genetic component with ALS: a large-scale multitrait association analysis. Neurobiol. Aging 134, 28–39 (2024).
Liu, H. et al. Ubiquitin–proteasome system in the different stages of dominantly inherited Alzheimer’s disease. Alzheimers Dement. 21, e70243 (2025).
Xu, N. et al. Ube2v1 positively regulates protein aggregation by modulating ubiquitin proteasome system performance partially through K63 ubiquitination. Circ. Res. 126, 907–922 (2020).
Masola, V., Greco, N., Tozzo, P., Caenazzo, L. & Onisto, M. The role of SPATA2 in TNF signaling, cancer, and spermatogenesis. Cell Death Dis. 13, 977 (2022).
Verheijen, J. & Sleegers, K. Understanding Alzheimer disease at the interface between genetics and transcriptomics. Trends Genet. 34, 434–447 (2018).
Cissé, M. & Checler, F. Eph receptors: new players in Alzheimer’s disease pathogenesis. Neurobiol. Dis. 73, 137–149 (2015).
Pocernich, C. B. & Butterfield, D. A. Elevation of glutathione as a therapeutic strategy in Alzheimer disease. Biochim. Biophys. Acta 1822, 625–630 (2012).
Laskovs, M., Partridge, L. & Slack, C. Molecular inhibition of RAS signalling to target ageing and age-related health. Dis. Model. Mech. 15, dmm049627 (2022).
Li, S. & Kim, H.-E. Implications of sphingolipids on aging and age-related diseases. Front. Aging 2, 797320 (2022).
Musardo, S. et al. The development of ADAM10 endocytosis inhibitors for the treatment of Alzheimer’s disease. Mol. Ther. 30, 2474–2490 (2022).
Nakatsuka, N. et al. Improving reproducibility of differentially expressed genes in single-cell transcriptomic studies of neurodegenerative diseases through meta-analysis. Nat. Commun. 16, 7436 (2025).
Kreft, K. L. et al. Abundant kif21b is associated with accelerated progression in neurodegenerative diseases. Acta Neuropathol. Commun. 2, 144 (2014).
Rodríguez-Giraldo, M. et al. Astrocytes as a therapeutic target in Alzheimer’s disease—comprehensive review and recent developments. Int. J. Mol. Sci. 23, 13630 (2022).
Kim, M. et al. Maf links neuregulin1 signaling to cholesterol synthesis in myelinating Schwann cells. Genes Dev. 32, 645–657 (2018).
Papuć, E. & Rejdak, K. The role of myelin damage in Alzheimer’s disease pathology. Arch. Med. Sci. 16, 345–341 (2020).
Sierksma, A. et al. Novel Alzheimer risk genes determine the microglia response to amyloid-β but not to tau pathology. EMBO Mol. Med. 12, EMMM201910606 (2020).
Kimura, K. et al. Immune checkpoint TIM-3 regulates microglia and Alzheimer’s disease. Nature 641, 718–731 (2025).
Wilson, E. N. & Andreasson, K. I. TAM-ping down amyloid in Alzheimer’s disease. Nat. Immunol. 22, 543–544 (2021).
Kozlova, A. et al. PICALM Alzheimer’s risk allele causes aberrant lipid droplets in microglia. Nature 646, 1178–1186 (2025).
Serneels, L. et al. γ-Secretase heterogeneity in the Aph1 subunit: relevance for Alzheimer’s disease. Science 324, 639–642 (2009).
Lim, F. T., Ogawa, S. & Parhar, I. S. Spred-2 expression is associated with neural repair of injured adult zebrafish brain. J. Chem. Neuroanat. 77, 176–186 (2016).
Jansen, I. E. et al. Genome-wide meta-analysis identifies new loci and functional pathways influencing Alzheimer’s disease risk. Nat. Genet. 51, 404–413 (2019).
Sims, R., Hill, M. & Williams, J. The multiplex model of the genetics of Alzheimer’s disease. Nat. Neurosci. 23, 311–322 (2020).
Leonenko, G. et al. Identifying individuals with high risk of Alzheimer’s disease using polygenic risk scores. Nat. Commun. 12, 4506 (2021).
Srinivasan, K. et al. Alzheimer’s patient microglia exhibit enhanced aging and unique transcriptional activation. Cell Rep. 31, 107843 (2020).
Mathys, H. et al. Single-cell transcriptomic analysis of Alzheimer’s disease. Nature 570, 332–337 (2019).
Gabitto, M. I. et al. Integrated multimodal cell atlas of Alzheimer’s disease. Nat. Neurosci. 27, 2366–2383 (2024).
Almeida, V. N. Somatostatin and the pathophysiology of Alzheimer’s disease. Ageing Res. Rev. 96, 102270 (2024).
Nitsch, L., Schneider, L., Zimmermann, J. & Müller, M. Microglia-derived interleukin 23: a crucial cytokine in Alzheimer’s disease? Front. Neurol. 12, 639353 (2021).
Lam, M. et al. RICOPILI: rapid imputation for consortias pipeline. Bioinformatics 36, 930–933 (2020).
Privé, F., Aschard, H., Ziyatdinov, A. & Blum, M. G. B. Efficient analysis of large-scale genome-wide data with two R packages: bigstatsr and bigsnpr. Bioinformatics 34, 2781–2787 (2018).
Peyrot, W. J., Boomsma, D. I., Penninx, B. W. J. H. & Wray, N. R. Disease and polygenic architecture: avoid trio design and appropriately account for unscreened control subjects for common disease. Am. J. Hum. Genet. 98, 382–391 (2016).
Marioni, R. E. et al. Assessing the genetic overlap between BMI and cognitive function. Mol. Psychiatry 21, 1477–1482 (2016).
Liu, J. Z., Erlich, Y. & Pickrell, J. K. Case–control association mapping by proxy using family history of disease. Nat. Genet. 49, 325–331 (2017).
Grotzinger, A. D., de la Fuente, J., Privé, F., Nivard, M. G. & Tucker-Drob, E. M. Pervasive downward bias in estimates of liability-scale heritability in genome-wide association study meta-analysis: a simple solution. Biol. Psychiatry 93, 29–36 (2023).
Weissbrod, O. et al. Functionally informed fine-mapping and polygenic localization of complex trait heritability. Nat. Genet. 52, 1355–1363 (2020).
Zou, Y., Carbonetto, P., Wang, G. & Stephens, M. Fine-mapping from summary data with the “sum of single effects” model. PLoS Genet. 18, e1010299 (2022).
de Leeuw, C. A., Mooij, J. M., Heskes, T. & Posthuma, D. MAGMA: generalized gene-set analysis of GWAS data. PLoS Comput. Biol. 11, e1004219 (2015).
Sudlow, C. et al. UK Biobank: an open access resource for identifying the causes of a wide range of complex diseases of middle and old age. PLoS Med. 12, e1001779 (2015).
Weeks, E. M. et al. Leveraging polygenic enrichments of gene features to predict genes underlying complex traits and diseases. Nat. Genet. 55, 1267–1276 (2023).
Evans, D. M. & Davey Smith, G. Mendelian randomization: new applications in the coming age of hypothesis-free causality. Annu. Rev. Genomics Hum. Genet. 16, 327–350 (2015).
Machiela, M. J. & Chanock, S. J. LDlink: a web-based application for exploring population-specific haplotype structure and linking correlated alleles of possible functional variants. Bioinformatics 31, 3555–3557 (2015).
Giambartolomei, C. et al. Bayesian test for colocalisation between pairs of genetic association studies using summary statistics. PLoS Genet. 10, e1004383 (2014).
Wingo, A. P. et al. Sex differences in brain protein expression and disease. Nat. Med. 29, 2224–2232 (2023).
Jang, B. et al. A meta-analysis of single-nucleus expression quantitative trait loci linking genetic risk to brain disorders. Nat. Genet. 58, 737–747 (2026).
Panousis, N. I. et al. Gene expression QTL mapping in stimulated iPSC-derived macrophages provides insights into common complex diseases. Nat. Commun. 16, 7204 (2025).
de Klein, N. et al. Brain expression quantitative trait locus and network analyses reveal downstream effects and putative drivers for brain-related diseases. Nat. Genet. 55, 377–388 (2023).
de Paiva Lopes, K. et al. Genetic analysis of the human microglial transcriptome across brain regions, aging and disease pathologies. Nat. Genet. 54, 4–17 (2022).
Kosoy, R. et al. Genetics of the human microglia regulome refines Alzheimer’s disease risk loci. Nat. Genet. 54, 1145–1154 (2022).
Jerber, J. et al. Population-scale single-cell RNA-seq profiling across dopaminergic neuron differentiation. Nat. Genet. 53, 304–312 (2021).
Humphrey, J. et al. Integrative transcriptomic analysis of the amyotrophic lateral sclerosis spinal cord implicates glial activation and suggests new risk genes. Nat. Neurosci. 26, 150–162 (2023).
Humphrey, J. et al. Long-read RNA sequencing atlas of human microglia isoforms elucidates disease-associated genetic regulation of splicing. Nat. Genet. 57, 604–615 (2025).
Haglund, A. et al. Cell state-dependent allelic effects and contextual Mendelian randomization analysis for human brain phenotypes. Nat. Genet. 57, 358–368 (2025).
Fujita, M. et al. Cell subtype-specific effects of genetic variation in the Alzheimer’s disease brain. Nat. Genet. 56, 605–614 (2024).
Bryois, J. et al. Cell-type-specific cis-eQTLs in eight human brain cell types identify novel risk genes for psychiatric and neurological disorders. Nat. Neurosci. 25, 1104–1112 (2022).
van Rheenen, W. et al. Common and rare variant association analyses in amyotrophic lateral sclerosis identify 15 risk loci with distinct genetic architectures and neuron-specific biology. Nat. Genet. 53, 1636–1648 (2021).
Hoogmartens, J., Cacace, R. & Van Broeckhoven, C. Insight into the genetic etiology of Alzheimer’s disease: a comprehensive review of the role of rare variants. Alzheimers Dement. 13, e12155 (2021).
Khani, M., Gibbons, E., Bras, J. & Guerreiro, R. Challenge accepted: uncovering the role of rare genetic variants in Alzheimer’s disease. Mol. Neurodegener. 17, 3 (2022).
Cannon, M. et al. DGIdb 5.0: rebuilding the drug–gene interaction database for precision medicine and drug discovery platforms. Nucleic Acids Res. 52, D1227–D1235 (2024).
Zheng, Z. et al. Leveraging functional genomic annotations and genome coverage to improve polygenic prediction of complex traits within and between ancestries. Nat. Genet. 56, 767–777 (2024).
Gazal, S. et al. Linkage disequilibrium-dependent architecture of human complex traits shows action of negative selection. Nat. Genet. 49, 1421–1427 (2017).
Lee, S. H., Goddard, M. E., Wray, N. R. & Visscher, P. M. A better coefficient of determination for genetic profile analysis. Genet. Epidemiol. 36, 214–224 (2012).
Choi, S. W., Mak, T. S.-H. & O’Reilly, P. F. Tutorial: a guide to performing polygenic risk score analyses. Nat. Protoc. https://doi.org/10.1038/s41596-020-0353-1 (2020).
Pirinen, M., Donnelly, P. & Spencer, C. C. A. Including known covariates can reduce power to detect genetic effects in case-control studies. Nat. Genet. 44, 848–851 (2012).
Berisa, T. & Pickrell, J. K. Approximately independent linkage disequilibrium blocks in human populations. Bioinformatics 32, 283–285 (2016).
Gelman, A. & Rubin, D. B. Inference from iterative simulation using multiple sequences. Stat. Sci. 7, 457–472 (1992).
Yang, J., Lee, S. H., Goddard, M. E. & Visscher, P. M. GCTA: a tool for genome-wide complex trait analysis. Am. J. Hum. Genet. 88, 76–82 (2011).
Chang, C. C. et al. Second-generation PLINK: rising to the challenge of larger and richer datasets. GigaScience 4, 7 (2015).
Yang, J., Wray, N. R. & Visscher, P. M. Comparing apples and oranges: equating the power of case-control and quantitative trait association studies. Genet. Epidemiol. 34, 254–257 (2010).
Karczewski, K. J. et al. Pan-UK Biobank genome-wide association analyses enhance discovery and resolution of ancestry-enriched effects. Nat. Genet. 57, 2408–2417 (2025).
Perez, G. et al. The UCSC Genome Browser database: 2025 update. Nucleic Acids Res. 53, D1243–D1249 (2025).
Cerezo, M. et al. The NHGRI-EBI GWAS Catalog: standards for reusability, sustainability and diversity. Nucleic Acids Res. 53, D998–D1005 (2025).
Werme, J., van der Sluis, S., Posthuma, D. & de Leeuw, C. A. An integrated framework for local genetic correlation analysis. Nat. Genet. 54, 274–282 (2022).
ReproGen Consortium et al. An atlas of genetic correlations across human diseases and traits. Nat. Genet. 47, 1236–1241 (2015).
Liberzon, A. et al. Molecular signatures database (MSigDB) 3.0. Bioinformatics 27, 1739–1740 (2011).
Koopmans, F. et al. SynGO: an evidence-based, expert-curated knowledge base for the synapse. Neuron 103, 217–234.e4 (2019).
Durinck, S. et al. BioMart and Bioconductor: a powerful link between biological databases and microarray data analysis. Bioinformatics 21, 3439–3440 (2005).
Csárdi, G. et al. igraph for R: R interface of the igraph library for graph theory and network analysis. Zenodo https://doi.org/10.5281/zenodo.14736815 (2025).
Watanabe, K., Umićević Mirkov, M., de Leeuw, C. A., van den Heuvel, M. P. & Posthuma, D. Genetic mapping of cell type specificity for complex traits. Nat. Commun. 10, 3222 (2019).
Siletti, K. et al. Transcriptomic diversity of cell types across the adult human brain. Science 382, eadd7046 (2023).
Hodge, R. D. et al. Conserved cell types with divergent features in human versus mouse cortex. Nature 573, 61–68 (2019).
Herring, C. A. et al. Human prefrontal cortex gene regulatory dynamics from gestation to adulthood at single-cell resolution. Cell 185, 4428–4447.e28 (2022).
Wang, D. et al. Comprehensive functional genomic resource and integrative model for the human brain. Science 362, eaat8464 (2018).
Sun, N. et al. Human microglial state dynamics in Alzheimer’s disease progression. Cell 186, 4386–4403.e29 (2023).
Han, B. & Eskin, E. Random-effects model aimed at discovering associations in meta-analysis of genome-wide association studies. Am. J. Hum. Genet. 88, 586–598 (2011).
Acknowledgements
We sincerely thank the individuals living with Alzheimer’s disease, their families and caregivers, and all other participants who gave their time, experiences and DNA to this research. We also thank the clinical and research teams who worked with them, and the investigators of the Alzheimer’s Disease Working Group of the Psychiatric Genomics Consortium (PGC-ALZ). Acknowledgements for each cohort can be found in the Supplementary Information.
Funding
This project was supported by the NWO Gravitation grant BRAINSCAPES: a roadmap from neurogenetics to neurobiology (grant no. 024.004.012), the European Research Council Advanced Grant (grant no. ERC-2018-ADG 834057), the Research Council of Norway (grants nos. 360793, 360794, 344121, 324499 and 353629), the European Union’s Horizon 2020 Research and Innovation Action (grant no. 964874), NordForsk (grant no. 164218) and the NIMH (awards 5R01MH124839-05 and R01MH124873). This research has been conducted using the UKB resource under application nos. 16406 and 18177. D.P.W. was supported by an Alzheimer Nederland Early Career Grant (WE.03-2025-18) and a VCAS/VU Talent fund 2025: Bridging grant. F.J.W. was supported by the Netherlands Organisation for Health Research and Development (ZonMw; project BIRD-NL, grant no. 1051003210005). T.F., L. Pålhaugen, B.-E.K. and K.N. were supported by Akershus University Hospital, the Research Council of Norway (NASATS (Dementia Disease Initiation), grant no. 217780/H10) and the EU Joint Programme – Neurodegenerative Disease Research (JPND; APGeM, grant no. JPND237250; PMI-AD, grant no. JPND311993). I.R. was supported by the Ministry of Health of the Czech Republic in cooperation with the Czech Health Research Council within the National Institute for Neurology Research (project no. NW26A-NEURIN) and by the Ministry of Education, Youth and Sports (MEYS) through the Czech National Node to the European Clinical Research Infrastructure Network (CZECRIN; LM2023049). K.H. was supported by a Humboldt Research Fellowship from the Alexander von Humboldt Foundation.
Ethics declarations
Competing interests
D. Rujescu served as consultant for Boehringer-Ingelheim and Janssen; received honoraria from Boehringer-Ingelheim, Gerot Lannacher, Indorsia, Janssen and Pharmagenetix; received research and/or travel support from Angelini, Boehringer-Ingelheim, Janssen and Schwabe; and served on advisory boards of AC Immune, Boehringer-Ingelheim, Indorsia, Roche and Rovi. S.J.v.d.L. is part of the GeneMINDS consortium, which is powered by Health~Holland, Top Sector Life Sciences & Health; and receives co-financing from Vigil Neuroscience, Prevail therapeutics and Brain Research Center; all funding is paid to his institution. W.M.v.d.F. has been an invited speaker at Biogen MA, Danone, Eisai, WebMD Neurology (Medscape), NovoNordisk, Springer Healthcare and European Brain Council; is consultant to Oxford Health Policy Forum CIC, Roche, Biogen MA, Eisai, Eli-Lilly, Owkin France, Nationale Nederlanden Ventures (all funding paid to her institution); participated in advisory boards of Biogen MA, Roche and Eli-Lilly; is a member of the steering committee of phase III EVOKE/EVOKE+ studies (NovoNordisk), the steering committee of a phase III trontinemab study (Roche), the steering committee of PAVE and Think Brain Health; is chair of the Scientific Leadership Group of InRAD; was an associate editor of Alzheimer, Research & Therapy in 2020–2021; is an associate editor at Brain; and is a member of Supervisory Board (Raad van Toezicht) of Trimbos Instituut. C. Benner and A.M. are holders of Roche stock. A.H.S. has received a one-time consulting fee from Eisai/BioArctic (2025), paid to her institution. S. Kern has served on scientific advisory boards, as a speaker and/or as a consultant for Roche, Eli-Lilly, Geras Solutions, Optoceutics, Biogen, Eisai, Merry Life, Triolab, Novo Nordisk and Bioarctic, unrelated to the content of the present study. J.B. is an employee of Roche. G. Selbæk has participated in advisory board meetings for Roche, Eli-Lilly and Eisai regarding disease-modifying drugs for AD; and has received honoraria for delivering lectures at symposia sponsored by Eisai and Eli-Lilly. B.-E.K. has previously served on an advisory board for Eisai and as a consultant for Biogen; and is currently a consultant and advisory board member for Eli-Lilly. O.F. is a consultant to Precision Health. B.H. is employed by Eli-Lilly and Company and owns publicly traded stocks of this company. H. Stefansson, G.B.W. and D. Gudbjartsson are employees of Amgen deCODE genetics. K.B. has served as a consultant and on advisory boards, has given lectures, and has produced educational materials and participated in educational programmes for AC Immune, ALZPath, AriBio, Beckman-Coulter, BioArctic, Eisai, Lilly, Neurimmune, Novartis, Roche Diagnostics, Sunbird Bio and Siemens Healthineers (all before September 2025), and is a co-founder of Brain Biomarker Solutions in Gothenburg AB (BBS), which is part of the GU Ventures Program, outside the work presented in this paper. Since September 2025, K.B. has been an employee of Lilly and has no other disclosures. M. Franc is employed by Janssen, a subsidiary of Johnson & Johnson, and owns publicly traded stock in Johnson & Johnson. K.H. is an employee of Bayer AG and a former employee of 23andMe, Inc. A.I.C., M. Ferreira, E.A.S. and R.W. are employees of Regeneron and may hold stock or stock options in Regeneron. A.-B.K. has, in the past five years, worked on clinical drug trials for Novo Nordisk (NN6535-4730) and GSK (219867). D.P. is a consultant for Temple Private Ltd. The remaining authors declare no competing interests.
Peer review
Peer review information
Nature thanks the anonymous reviewers for their contribution to the peer review of this work. Peer reviewer reports are available.
Additional information
Publisher’s note Springer Nature remains neutral with regard to jurisdictional claims in published maps and institutional affiliations.
Extended data figures and tables
Extended Data Fig. 1 Effective sample sizes and the publicly released summary statistics.
a, Effective sample size (Neff) per genetic ancestry group (EUR, European; AFR, African; EAS, East Asian; AMR, Admixed American; SAS, South Asian), split into case–control (CC) and proxy-phenotype (Proxy) contributions. The inset rescales the four smaller groups for visibility. Neff is defined in Methods. b, Summary statistics released as a public resource: cross-ancestry (ALL) and ancestry-specific analyses, each as separate case–control and proxy sets, with additional sex-stratified (♂, male; ♀, female) and UK Biobank–excluded (excl. UKB) meta-analyses. Ellipses (…) denote repetition of the CC/Proxy split across ancestry groups.
Extended Data Fig. 2 Ancestry-specific GWAS Manhattan plots.
Association results for each genetic ancestry group (EUR, European; AFR, African; EAS, East Asian; AMR, Admixed American; SAS, South Asian). For each SNP, chromosomal position is shown on the x-axis and strength of association as −log10(p) on the y-axis; the dashed line marks genome-wide significance (p < 5 × 10⁻⁸). Note the differing y-axis scales across panels. In EUR, the axis is capped at 125 for clarity; the APOE locus reaches −log10(p) ~ 5000.
Extended Data Fig. 3 Miami plot of the sex-stratified GWAS.
Association results for female (top) and male (bottom) participants, plotted back-to-back. For each SNP, chromosomal position is shown on the x-axis and strength of association as −log10(p) on the y-axis; the dashed line marks genome-wide significance (p = 5 × 10⁻⁸). The y-axis is capped at 30, truncating the APOE peak on chromosome 19.
Extended Data Fig. 4 Miami plot of the case–control and proxy GWAS.
Association results for the clinically ascertained case–control analysis (top) and the proxy-phenotype analysis (bottom), plotted back-to-back. For each SNP, chromosomal position is shown on the x-axis and strength of association as −log10(p) on the y-axis; the dashed line marks genome-wide significance (p = 5 × 10⁻⁸). The y-axis is capped at 100, truncating the APOE peak on chromosome 19.
Extended Data Fig. 5 APOE-e4 effect sizes across ancestries and analysis types.
Effect estimates (β, log odds ratio) with 95% confidence intervals for the APOE-e4-tagging variant rs429358 (chr19:45411941, C/T) in the case–control, proxy and combined meta-analyses, shown separately for East Asian (EAS), European (EUR), South Asian (SAS) and African (AFR) ancestries. Estimates are given for the T (non-ε4) allele; the ε4 risk allele is C, so negative β values indicate the expected increase in Alzheimer’s disease risk conferred by ε4.
Extended Data Fig. 6 Predicting AD using SBayesRC-based Polygenic Scores (PGS) and APOE genotype counts.
Incremental \({R}_{\mathrm{liability}}^{2}\) for four predictors (PGSexcl. APOE, APOE e2 + e4 counts, PGSfull, and APOE e2 + e4 + PGSexcl. APOE) across five cohorts (DemGene, Gothenburg, UK Biobank, TwinGene, STSA). The base model included the first 10 principal components, and the model to be evaluated additionally included the predictor. We computed the incremental \({R}_{\mathrm{liability}}^{2}\) as the difference between the models. We applied a leave-one-cohort-out approach, in which the PGS for each testing cohort was constructed using GWAS summary statistics that excluded that cohort. For PGSexcl. APOE), we excluded all variants within 5 Mb up- and downstream of position 19:45411941 on hg37 (a 10 Mb window).
Extended Data Fig. 7 Case prevalence across PGS percentile bins in the UK Biobank.
Alzheimer’s disease case prevalence within polygenic score (PGS) percentile bins (deciles, plus the top and bottom 1%), in unrelated individuals of EUR ancestry aged 65 and older in the UK Biobank (UKB). Bars compare the full PGS (Full) with a score excluding the APOE region (noAPOE); the grey bar shows the whole-sample prevalence and the dashed line marks that baseline. The PGS model did not include UKB data. For noAPOE, we excluded all variants within 5 Mb up- and downstream of position 19:45411941 on hg37 (a 10 Mb window).
Supplementary information
Supplementary Information (download PDF )
Supplementary Notes 1–13, Supplementary Methods, Supplementary Figs 1–10, Supplementary References and member lists for the contributing consortia.
Supplementary Data
Supplementary Data Tables 1–22 reporting the samples analysed, all identified loci and their summary statistics, gene prioritisation and drug-target evidence, gene-set, cell-type and microglial analyses, heritability and polygenic-prediction results, and supporting sample information. A table of contents is included within the file.
Rights and permissions
Open Access This article is licensed under a Creative Commons Attribution-NonCommercial-NoDerivatives 4.0 International License, which permits any non-commercial use, sharing, distribution and reproduction in any medium or format, as long as you give appropriate credit to the original author(s) and the source, provide a link to the Creative Commons licence, and indicate if you modified the licensed material. You do not have permission under this licence to share adapted material derived from this article or parts of it. The images or other third party material in this article are included in the article’s Creative Commons licence, unless indicated otherwise in a credit line to the material. If material is not included in the article’s Creative Commons licence and your intended use is not permitted by statutory regulation or exceeds the permitted use, you will need to obtain permission directly from the copyright holder. To view a copy of this licence, visit http://creativecommons.org/licenses/by-nc-nd/4.0/.
About this article
Cite this article
Uffelmann, E., Wightman, D.P., Bahrami, S. et al. Alzheimer’s disease genetics converges on microglial and neuronal dysregulation. Nature (2026). https://doi.org/10.1038/s41586-026-11206-y
Received: 13 October 2025
Accepted: 24 September 2026
Published: 28 October 2026
Version of record: 28 October 2026
DOI: https://doi.org/10.1038/s41586-026-11206-y