Local changes in tx01: observations, reanalysis, and CMIP6 data
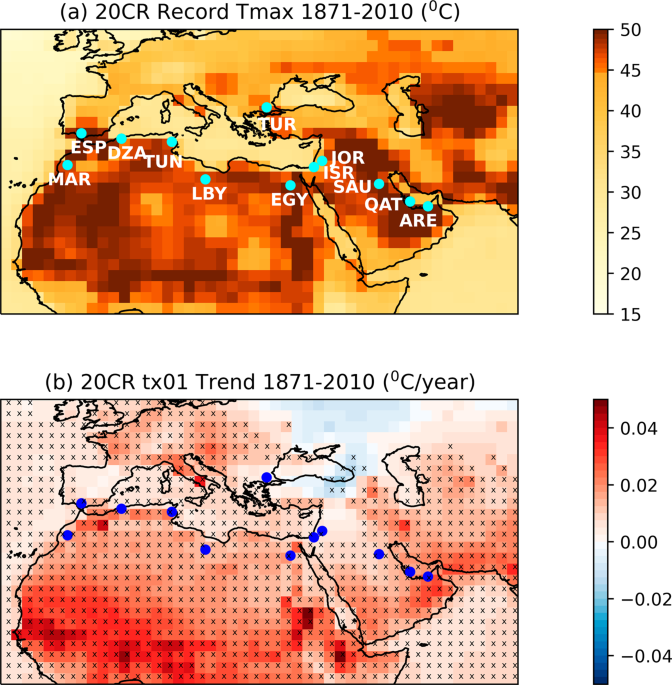
The sparse coverage of observation stations that provide data necessary for model evaluation, impedes attribution investigations of local extremes over large areas, meaning that most studies either consider larger spatial scales or only a specific location44. Here we select 12 locations in hotspot regions, where it seems reasonable to question whether maximum temperatures might rise above the thresholds of 45 or even 50 °C with an increasing frequency in a warming climate. We include locations in 12 different countries of three continents (hereafter referred to using the country ID code), for which station daily temperature data45 are available over several recent decades (Table 1). Maximum daily temperatures (Tmax) above 50 °C have already been recorded at two locations (QAT and SAU), with five more stations bordering on the threshold (Table 1). Our analysis employs the annual maximum daily temperature (tx01), i.e., a measure of the warmest day of the year, to examine year-to-year changes in local extremes. To understand how the local tx01 characteristics take shape within the context of larger spatial scales, we also employ data from the 20th Century Reanalysis (20CR)46,47 and examine historical changes in tx01 over a wider region and a much longer period compared to station observations. Reanalysis temperature records and trends over the period 1871–2010 are illustrated in Fig. 1. While only few European regions see records above 45 °C, such extremes are clearly manifest in Northern Africa, the Arabian Peninsula and other parts of the Middle East. Our reference locations sample a range of tx01 maxima, and include sites with relatively moderate extremes (in TUR, ISR, and JOR), where the current likelihood of hitting 50 °C appears to be near-zero, given the much cooler local records. An interesting question we aim to answer is whether such unprecedented temperature exceedances may become plausible at these locations in coming years. Trends computed with 20CR data reveal significant long-term warming in tx01 over most of the wider region (Fig. 1b). The small cooling trends over parts of Eastern Europe and Western Asia are not statistically significant as confirmed with a Mann–Kendall test. The reanalysis suggests that tx01 is on the rise at all reference locations, with an estimated warming rate between 0.5 and 2.5 °C per century.
Table 1 Observation stations. Full size table
Fig. 1: Records and trends of the warmest day of the year in the 20CR reanalysis. a Map of the highest maximum daily temperature during 1871–2010. Darker colours correspond to temperatures higher that 45 °C. b Trends in the warmest day of the year (tx01) during the reanalysis period. Crosses mark areas where trends are significantly different from zero (tested at the 10% level), as determined by a Mann–Kendall test. When applying the Mann–Kendall test it is assumed that serial correlation has a minimal effect on the tx01 timeseries and is therefore not accounted for. The dots on the figure panels show the location of the 12 stations considered in the study. Full size image
Local tx01 estimates are also derived from CMIP6 simulations (Methods) that represent the natural climate, without the influence of anthropogenic forcings (NAT), and the actual world with all forcings acting on the climate system (ALL). We use 50 NAT and 46 ALL simulations from 11 different models that start in year 1850. The ALL simulations are extended to year 2100 following the “middle-of-the-road” emissions scenario SSP2-4.548. Local tx01 values correspond to the nearest model grid-box, an approximation that is found to work well for variables with large spatial correlation scales like temperature, away from densely built-up areas where urban warming also needs to be accounted for49. We therefore select only observation stations away from large urban centres, either in smaller towns or at airport sites outside the city boundaries, in order to minimise the effect of urbanisation. It should be stressed that our findings only apply to the specific locations considered here, and extreme event probabilities may indeed be higher in nearby cities. The approximation of local temperatures with grid-box data is also assessed in this study on the basis of the evaluation tests described later. A simple correction of the mean model bias relative to station observations is also applied to the simulated data (Methods). Timeseries of tx01 constructed with the ALL and NAT simulations and station observations are illustrated in Fig. 2. Although natural variability would mask to some extent the anthropogenic fingerprint, a warming trend has taken off in recent years in the ALL climate and is projected to intensify in future decades. Exceeding the 45 °C threshold is gradually becoming more common in cooler locations (e.g., TUR), but is already certain to be exceeded in hotter locations. In SAU, for example, average tx01 values are projected to reach 53 °C by the end of the century, rendering 50 °C a relatively low temperature. Despite regional variations in the likelihood of extremes, the CMIP6 ALL experiment simulates years with tx01 greater than 50 °C in all reference locations towards the end of the century, even those that are currently several degrees cooler and have not yet experienced such intense extremes.
Fig. 2: Observed and modelled tx01 timeseries at the 12 reference locations. Timeseries constructed with observational data are shown in black. Modelled timeseries from the 46 ALL and 50 NAT simulations provided by the CMIP6 models are shown in red and blue respectively. The grey horizontal lines mark the 45 and 50 °C thresholds. Location names are shown at the title of each panel. Full size image
Model evaluation
In common with other multi-model studies, we evaluate the ensemble of the 11 models as a whole15 against the station observations. While more detailed studies of extremes might evaluate various aspects of the simulated climate, like, for example, dynamical drivers, or land-atmosphere interactions, attribution analyses are primarily concerned with the ability of the models to reliably represent the distribution of the reference variable from which event probabilities are derived. We therefore employ some popular tests that have been developed and tried over years in event attribution studies15,50 to examine whether main statistical characteristics of tx01 constructed with the multi-model ensemble are overall consistent with the observations. Comparing the modelled and observed variability, we find that the observed standard deviation (SD), linked to the scale of the distribution, is within the range of the models (Supplementary Fig. 1), with no model yielding systematically high or low SD values across the reference locations. Power spectra that assess variability over different timescales51 also show that the observations lie within the range of the models (Supplementary Fig. 2). We next construct quantile-quantile (Q-Q) plots for each model simulation (Fig. 3), which broadly indicate the level of consistency between models and observations in representing different parts of the distribution (main body and tails). Again, we find no systematic discrepancy, but, on the contrary, a good level of agreement that is also the case for the warm tail of the distribution (higher tx01 values), pertinent to the representation of the likelihood of hot extremes. Finally, for each location, we apply a Kolmogorov-Smirnov test to compare observational tx01 estimates with a sample constructed by pooling together tx01 values from the 46 ALL simulations over the observational period. In all cases we find that the model-based distribution is indistinguishable from the observed one (p-value greater than 0.1). Despite sampling limitations due to the short observational records, the evaluation assessments could still flag models that markedly depart from the rest of the ensemble range and, in our case, they provide reassurance that the multi-model ensemble is indeed fit for the purposes of an attribution analysis. It is also evident that local temperatures can be adequately represented by grid-box scale data with no indication of significant urban warming to render the modelled temperatures too cold.
Fig. 3: Evaluation of the modelled tx01 distribution. Quantile–quantile (Q–Q) plots for each of the ALL simulations, comparing the modelled and the observed tx01 distributions. Location names are shown at the title of each panel. Full size image
The probability of exceeding 45 and 50 °C
We next use the multi-model ALL and NAT ensembles to estimate probabilities of extreme events, defined as tx01 exceedances of a high temperature threshold. Our main interest is in exceedances of 50 °C, but we also consider the 45 °C threshold that is more relevant for hot extremes in cooler locations, at least without strong anthropogenic influence. The natural world probabilities are estimated from all simulated years of the NAT experiment, while present-day and future probabilities are derived from time slices of the ALL simulations. Details of our analysis are given in the Methods. As common in event attribution studies, we report return times of extreme events (inverse probabilities), measuring the average span between consecutive extremes under certain climatic conditions. Figure 4 illustrates the change in the return time of years with tx01 above 45 °C (also Supplementary Table 2). In most locations the threshold is not particularly extreme and is exceeded every year, or every few years, even in the natural world. In the three cooler locations (ISR, JOR, TUR), however, such events are extremely rare in the NAT climate (return time of the order of centuries), but are becoming more common due to human influence and are estimated to occur at least once a decade by the end of the century. The changing return times for the 50 °C threshold are shown in Fig. 5 (also Supplementary Table 2). We find that reaching such extreme temperatures would be extremely rare or even impossible in the NAT climate. Even in the warmest SAU location, the estimated NAT return time is of the order of a century. Nevertheless, the likelihood is rapidly increasing due to anthropogenic forcings, with sub-century return times in today’s climate computed at five of the reference locations. By the end of the century, a tx01 greater than 50 °C may be seen at least once a decade in most locations and could be exceeded annually at the warmest sites of ARE, QAT and SAU, where warm extremes are projected to reach unprecedented highs in the mid- or high- 50 s (Fig. 2). Interestingly, even at the relatively cooler station in ESP, where exceeding 50 °C never occurs in the NAT climate and is extremely rare up to the 2050 s, the likelihood increases at a fast pace, leading to return times of less than a century by 2100 (best estimate: 70 years). Similarly, such extremes that would not occur in the pre-industrial climate at LBY, could become common in coming decades. Although the likelihood remains extremely low at the three cooler locations (ISR, JOR, TUR), there are years towards the end of the century with some simulated temperatures above 50 °C, implying that, although extremely rare, these exceedances are not impossible. A summary plot of the temporal changes due to human influence is shown in Fig. 6, where extremes are categorised according to their likelihood into four groups (from nearly impossible to common). In contrast to the lower threshold, where less change is seen, exceedances of 50 °C at most locations swiftly transit through categories of increasing likelihood. Finally, risk ratio estimates are reported in Table 2, measuring the present and future increase in the likelihood of extreme events relative to the NAT climate. For the more moderate threshold of 45 °C, we compute lower risk ratios that may even reduce to unity at locations where this temperature is commonly exceeded even without anthropogenic warming. At the three cooler locations, human influence is estimated to have increased the likelihood by a factor of about ten, but risk ratios become much higher by the end of the century. For the 50 °C threshold we find that the risk ratio goes to infinity at sites with a near-zero likelihood of extreme events in the NAT climate, and estimate tens or hundreds of times higher probabilities at hotter locations, again with further increases in the future. Risk ratios of infinity are often reported in attribution studies10, suggesting that events that would have been effectively impossible without human emissions have become possible. The range of risk ratios reflects differences in the local climate. For example, temperatures above 50 °C without human influence are more common in SAU than ARE (Fig. 2), hence the effect of anthropogenic warming is more prominent in ARE (higher risk ratio).
Fig. 4: Change in the probability of exceeding 45 °C. Return time (inverse probability) estimates are shown for the NAT climate (green), the present-day (pink), the middle of the century (red) and the end of the century (dark red). The black line connects the best estimates (50th percentile) corresponding to the different climatic conditions and the coloured vertical bars mark the 5–95% uncertainty range. Location names are shown at the title of each panel. Full size image
Fig. 5: Change in the probability of exceeding 50 °C. Return time (inverse probability) estimates are shown for the NAT climate (green), the present-day (pink), the middle of the century (red) and the end of the century (dark red). The black line connects the best estimates (50th percentile) corresponding to the different climatic conditions and the coloured vertical bars mark the 5–95% uncertainty range. The grey horizontal lines mark the 1000 years (solid), 100 years (dashed), and 10 years (dotted) return time values. Location names are shown at the title of each panel. Full size image
Fig. 6: Temporal changes in the likelihood of extremes under the influence of anthropogenic forcings. The likelihood (best estimate) of exceeding 45 °C (top) and 50 °C (bottom) in the natural climate, the present-day, the middle of the century, and the end of the century is grouped into four categories based on the return time. The horizontal rows correspond to the reference locations and each likelihood category is represented by a different colour. Full size image
Table 2 Risk ratio. Full size table
Increase in high risk days
As the health data required for a heat-mortality attribution analysis are not available for the countries considered here, we carry out a more general assessment of the expected increase in the severity and frequency of days with excess thermal deaths. In physiological terms, the “optimum temperature” (OT), or Minimum Mortality Temperature (MMT), describes the local comfort zone and sets the mortality baseline22,52. Excess deaths that occur when the temperature rises above, or falls below the OT are referred to as heat- and cold-related mortality. Non-optimum temperatures are estimated to account for almost 8% of all-cause mortality in selected locations22. Analysing mortality data in Japan and in 79 cities in three different continents with different climates, has demonstrated that the OT can be approximated by the 84th percentile of daily Tmax52,53. Even without explicitly accounting for the effect of humidity, no significant discrepancy was found between the OT and the 84th percentile in the cities examined. As the climate warms, the 84th percentile of Tmax also increases, and Fig. 7 illustrates the difference between its present-day and natural world values at the 12 locations considered in this study (Methods). This difference constitutes the “high risk warming” (HRW) index43 that measures the anthropogenic warming leading to an increase in thermal deaths, or the extra amount of warming that people need to adapt to relative to the NAT climate to counteract an increase in heat-related mortality. We find that the HRW index ranges between 1.6 and 2.3 °C at the reference locations. Moreover, the 84th percentile is much lower than 50 °C (and even below 40 °C at most locations), suggesting that exceedances of such a high threshold could bring about large mortality spikes as they drive the population well-outside its comfort zone, in the absence of mitigating social factors. We next estimate the local “high risk days” (HRD) index that measures the change in the number of days above the 84th percentile of Tmax relative to a baseline climate43 (Methods). The HRD index is essentially a crude estimate of the additional days when thermal deaths are expected to occur because of anthropogenic warming. Here we set the baseline climate to present-day to examine future increases in risk relative to today’s climate. Alternatively, the baseline could be set to the NAT climate, or any period relative to which one wants to assess the anthropogenic increase in the frequency of excess mortality43. Figure 8 shows timeseries of the HRD index from present-day to the end of the century. Our analysis suggests an index increase of about 1–2 months (best estimate) at all regions. This estimate suggests that the reference locations are set to experience several more weeks of oppressive heat in coming decades, though the actual number of excess deaths would also depend on other meteorological factors like humidity, as well as socio-economic aspects related to how well communities are prepared to adapt to new climatic conditions where extreme heat episodes become more frequent.
Fig. 7: High-risk warming. Estimates of the 84th percentile of Tmax at the 12 reference locations estimated with data from the CMIP6 experiments for the NAT climate (green) and the present-day climate (red). The increase in the 84th percentile that represents the warming of the pre-industrial OT temperature due to human influence is also marked on the plot for each location. Full size image