For each Earth system domain, we first quantify safe boundaries for maintaining Earth system resilience, with multiple levels of likelihood reflecting uncertainty or variability in the exact position of the boundary. Adhering to these safe boundaries implements our ‘interspecies justice and Earth system stability’ criterion (I1 in Box 1) and will safeguard future generations against significant harm from Earth system change (intergenerational justice; I2b in Box 1), but it may not avoid significant harm to current generations, particularly vulnerable populations (I2a and I3 in Box 1). Hence, (1) we propose that some boundaries be made more stringent to protect present generations and ecosystems; (2) we complement safe boundaries with local-level standards to protect present generations and ecosystems; and (3) if the boundary is likely to cause considerable difficulties for present generations, we propose that it is complemented with policies that account for distributive justice. We also assess the current state of the Earth system with respect to each safe and just ESB.
Climate
We identify safe ESBs for warming (Fig. 1 and Table 1) based on minimizing likelihoods of triggering climate tipping elements; maintaining biosphere and cryosphere functions; and accounting for Holocene (<0.5–1.0 °C) and previous interglacial (<1.5–2 °C) climate variability (Supplementary Methods). Some climate tipping points, such as circulation collapse or Amazon dieback, have high uncertainty or low confidence in their dynamics and potential warming thresholds16, but the complementary palaeoclimate and biosphere analyses independently support the safe climate ESB assessment. Cryosphere function includes maintaining permafrost in the northern high latitudes, permanent polar ice sheets and mountain glaciers and minimizing sea ice loss. We find that global warming beyond 1.0 °C above pre-industrial levels, which has already been exceeded9, carries a moderate likelihood of triggering tipping elements, such as the collapse of the Greenland ice sheet or localized abrupt thawing of the boreal permafrost16. One-degree Celsius global warming is consistent with the safe limit proposed in 199039 and the PB of 350 ppm CO 2 (ref. 27). Above 1.5 °C or 2.0 °C warming, the likelihood of triggering tipping points increases to high or very high, respectively (high confidence in Extended Data Table 1). Biosphere damage and the risk of global carbon sinks becoming carbon sources, potentially triggering further climate feedbacks, increase substantially40. We conclude that stabilizing at or below a safe ESB of 1.5 °C warming avoids the most severe climate impacts on humans and other species, reinforcing the 1.5 °C guardrail set in the Paris Agreement on Climate Change.
Table 1 Proposed safe and just (NSH) ESBs (visualized in Fig. 1) Full size table
Assessment of significant harm from climate change suggests the need for a stricter just (NSH) boundary. At 1.0 °C global warming, tens of millions of people were exposed to wet bulb temperature extremes (Fig. 2), raising concerns of inter- and intragenerational justice. At 1.5 °C warming, more than 200 million people, disproportionately those already vulnerable, poor and marginalized (intragenerational injustice), could be exposed to unprecedented mean annual temperatures41, and more than 500 million could be exposed to long-term sea-level rise (Fig. 2 and Methods). These numbers of people harmed vastly exceed the widely accepted ‘leave no one behind’ principle29 and undermine most of the Sustainable Development Goals. Moreover, past emissions have already led to significant harm, including extreme weather events, loss of habitat by Indigenous communities in the Arctic, loss of land area by low-lying states and sea-level rise or reduced groundwater recharge from changing glacial melt systems3. Irreversible impacts from cryosphere and biosphere tipping elements that are committed by anthropogenic greenhouse gas emissions in the coming decades but which unfold over centuries or millennia also threaten intergenerational justice (Supplementary Methods). We conclude that if exposure of tens of millions of people to significant harm is to be avoided, the just (NSH) boundary should be set at or below 1.0 °C. Since returning within this boundary may not be achievable in the foreseeable future, adaptations and compensations to reduce sensitivity to harm and vulnerability will be necessary. During the 2022 United Nations Climate Change Conference (COP-27), developing countries indeed focused actively on issues of adaptation, loss and damage.
Fig. 2: Exposure to significant harm from climate change at different levels of warming. We examine the exposure of the 2010 global population to mean annual temperatures above 29 °C (purple; linear fit, P < 0.01), wet bulb temperatures of 35 °C for an average of at least 1 day per year (orange; quadratic fit, P < 0.01) and future sea-level rise (blue; linear interpolation). Sea-level rise is calculated for 2100 (blue solid) and multi-centennial (blue dashed; linear interpolation) responses to a given temperature stabilization by 2100, representing near-term impacts and long-term equilibria, respectively. The inset shows the magnification of wet bulb temperature in the range 1–2 °C. Shading indicates one s.e. Source Data Full size image
Biosphere
For the biosphere, we identify safe ESBs for two complementary measures of biodiversity: (1) the area of largely intact natural ecosystems and (2) the functional integrity of all ecosystems, including urban and agricultural ecosystems (Table 1). Maintaining areas of largely intact natural ecosystems is necessary for securing the Earth system functions on which all humans, other species (I1 in Box 1) and Earth system stability depend, including stocks and flows of carbon, water and nutrients and halting species extinction (Earth system nature’s contribution to people (NCP) via Earth system functions). Based on climate, water and species conservation model outcomes, we propose a safe ESB of 50–60% (medium confidence in Extended Data Table 1) of global land surface covered by largely intact natural areas to maintain Earth system NCP (Table 1 and Supplementary Methods). This range uses the current area of natural land cover as a minimum value while indicating the need to restore largely intact natural areas. The exact safe boundary depends strongly on the demand for specific ecological functions (which in turn depend, for example, on the remaining carbon emissions to be sequestered) and on the spatial distribution of the largely intact natural area across ecoregions and ecosystems. Studies generally indicate that up to 60% of the terrestrial earth surface area may be needed, with some extending up to 80% (Supplementary Methods). Natural ecosystem areas comparable with the 50–60% terrestrial ESB are needed in the ocean to maintain carbon sequestration and minimize additional marine species extinction42. Biome-scale boundaries may be more stringent: for example, to protect tropical forest biomes due to their contribution to climate stability and moisture recycling. If allocation and coordination of restoration efforts are less than optimal, the required minimum area will be larger. If these boundaries are transgressed, tipping points involving loss of biome-scale functional integrity and associated NCP may be triggered, including increases in species extinction rates.
Adherence to our proposed safe ESB for the area of largely intact natural ecosystems should minimize harm to future generations (I2b in Box 1) by securing biosphere contributions to all life support through a stable and resilient Earth system and localized NCP provided by largely intact nature. However, achieving justice for current generations (I2a and I3 in Box 1) may require a stricter boundary because the safe ESB does not account for the current uneven distribution of largely intact natural ecosystems needed to support local livelihoods43, especially in poor or Indigenous communities44,45. Some people and countries may directly benefit from policies to maintain or increase natural ecosystem area46, while others may face opportunity costs47. Hence, to ensure just distribution of largely intact natural ecosystems, a just (NSH) boundary may need to be set at the upper end of the 50–60% safe range, as allocation will be less than optimal for achieving the functions the lower boundary was optimized for. We emphasize that natural ecosystem area includes all largely intact natural areas and not only those currently requiring conservation attention; it does not imply protection that excludes human habitation and sustainable use.
Functional integrity is the capacity of urban, agricultural or other human-modified ecosystems to provide ecological functions and their contributions to people at landscape scale, complementing the Earth system NCP provided by large-scale intact natural ecosystem areas. We analyse what minimum amount, quality and distance of natural habitat and seminatural habitat are needed to maintain local terrestrial NCP provision, including pollination, pest and disease control, water quality regulation, soil protection, natural hazards mitigation and recreation. We identify that at least 20–25% diverse seminatural habitat including native species in each square kilometre in human-modified lands is needed to support the provisioning of multiple local NCP48. The exact amount and quality required differ based on landscape type, climate and topography; the amount can range up to 50% in some landscapes vulnerable to natural hazards, such as steep slopes or highly erodible soils. This boundary applies to fine scales, currently proposed as 1 km2, because NCP are not transferable (for example, erosion or landslide can only be avoided by natural cover on the same slope) and are often provided or supported by non-mobile or limited mobility species (for example, foraging ranges of pollinating or pest-regulating insects are limited to a few hundred metres). About two thirds of human-dominated land area (approximately 40% of total land area) has insufficient functional integrity (Supplementary Methods), and large areas are showing symptoms of resilience loss49, requiring regenerative practices to restore local and Earth system functions.
The safe boundary for functional integrity reduces future exposure to significant harm (intergenerational justice). Loss of functional integrity in agricultural ecosystems and cities below the safe boundary would reduce food productivity, ecosystem capacity to mitigate natural hazards, pollution and nutrient losses and increase reliance on harmful pesticides and biocides and capacity to choose alternate land uses (intragenerational justice). The dependence on these services is often higher in regions with more vulnerable communities. Specific interventions that secure functional integrity are highly local and are best implemented under local authority, knowledge and leadership50, with policy interventions often needed to ensure that marginalized groups are not further disempowered but are given the space to use their knowledge and approaches to participate in such processes51.
Water
For fresh water, we propose two spatially defined safe ESBs based on subglobal boundaries that can be aggregated to the global scale: (1) a flow alteration ESB for surface water and (2) a drawdown ESB for groundwater (Table 1). Flow alteration in rivers is one of the key drivers of freshwater biodiversity loss52, leading to declines in freshwater biodiversity that outpace those of terrestrial and marine systems53 and in large-scale NCP, such as coastal and inland fisheries, on which millions of people depend54,55. Local-scale flow-ecology analyses are often used to establish environmental flow needs to define safe levels of flow alteration for individual watersheds56. These local-scale assessments could provide the basis for spatially explicit safe boundaries but are absent across most of the world57. In their absence, we propose that a presumptive subglobal safe ESB of 20% alteration (increase or decrease) of monthly surface water flows compared with the prevailing natural flow regime be met in all rivers globally (medium confidence in Extended Data Table 1). This ESB leaves 80% of flows unaltered to meet environmental needs58,59, assuming that required water quality standards are also met. The ESB is supported by empirical studies showing that flow alterations within 20% support native fish species and flow alteration beyond this level strongly affects biodiversity and ecosystem structure and function60,61 (Supplementary Methods has additional references supporting the use of this threshold). The global ESB for surface water is that 100% of all land area meets the subglobal boundary by limiting alterations of flows by 20% in all rivers in the world. Meeting the global ESB sums to a global alteration budget of 7,630 km3 per year (Supplementary Methods; with high confidence in Extended Data Table 1). Globally aggregated river flow alterations are currently less than this figure; however, we are outside the global ESB because the subglobal safe ESB is only met for 66% of land area (Table 1) and less than half of the global population (Supplementary Methods). These results are consistent with recent analyses of water scarcity, which highlight the challenge of meeting environmental flow requirements to support ecosystem services, such as fisheries production, while ensuring there is sufficient water for human needs57,62.
Groundwater aquifers contribute to base flows in many river systems and directly sustain wetlands and terrestrial vegetation. Unsafe levels of groundwater extraction occur when drawdown exceeds replenishment rates, impacting groundwater-dependent ecosystems and in some instances, leading to land subsidence and irreversible aquifer loss12,63,64. Given the temporal nature of groundwater recharge and discharge and a lack of widespread consistent data on historical aquifer levels, we propose that the safe ESB for annual groundwater drawdown for all aquifers be the average annual recharge, with groundwater considered safe if drawdown is less than recharge. The subglobal safe ESB is met for a given aquifer when local drawdown does not exceed average annual recharge. The global ESB for groundwater is that the subglobal ESB is met for all aquifers around the world. For the 2003–2016 period, the global sum of average annual recharge is approximately 16,000 km3 per year (Table 1 and Supplementary Methods; with high confidence in Extended Data Table 1). The groundwater extraction that may safely occur within this boundary naturally varies across the planet and, where possible, should be defined based on local-scale monitoring, although broad trends can also be determined via satellite remote sensing65. We estimate that we are currently outside the global ESB because groundwater levels in 47% of basins are currently in decline (Table 1).
Our justice analysis of the safe ESBs for surface and groundwater highlights the challenges of (1) multi-level distribution, (2) water insecurity and (3) water quality. The regional surface and groundwater ESBs are generally in the long-term interests of surrounding communities, as they conserve future fresh water (intergenerational justice: I2b in Box 1). Where depleted aquifers have already caused significant environmental impacts66, groundwater extraction should urgently be reduced, and recharge areas should be protected to restore aquifers to safe levels (NSH to present generations: I2a and I3 in Box 1). Minimizing significant harm to current generations also requires the following. (1) Accounting for multi-level distribution indicates the allocation of allowed alterations between communities, sectors or nations sharing the water body, whether directly or indirectly via virtual water. This allocation is particularly challenging where the safe ESB requires drastic reductions in water use. (2) Minimizing exposure to significant harm should account for water insecurity in different regions of the world. For example, harm associated with poor water sanitation and hygiene conditions disproportionately impacts the health of young children in low-income countries67, particularly in Sub-Saharan Africa and South Asia68. (3) Minimizing exposure to significant harm implies addressing surface water quality guidelines for human use69, not just an allocation of water quantity. At a minimum, water needs to be safe for consumption and irrigation, meaning that acceptable standards for faecal coliforms and salinity must be met. We align our just (NSH) ESBs for water with the safe ESBs while noting that adhering to the boundaries would considerably restrict current use and will require policies to ensure distributive justice.
These proposed surface and groundwater ESBs are independent of green water stocks. Green water stocks are critical for maintaining the atmospheric water cycle, which regulates seasonal precipitation levels34; can support a significant proportion of global agricultural production70 with less impact on aquatic ecosystems than blue water use71; and are closely related to the biosphere ESBs. A recent assessment38 proposed a spatially explicit green water boundary to ensure hydrological regulation of terrestrial ecosystems, climate and biogeochemical processes by defining a maximum allowed deviation (drying or wetting) of soil moisture levels from mid-Holocene conditions. The state variable for green water is defined as the percentage of ice-free land area that in any month has root-zone soil moisture levels outside the 95th percentile of the local baseline variability. The boundary value is set at 10%, corresponding to the median departure level from mid-Holocene conditions. We include this green water boundary in our set of safe ESBs (Table 1), but we limit our inter- and intragenerational justice analysis (I2 and I3 in Box 1) to surface and ground blue water.
Nutrients
We set safe ESBs for agricultural nitrogen (N) and phosphorus (P) surpluses for minimizing eutrophication of surface water and terrestrial ecosystems due to runoff, leaching and atmospheric N deposition via ammonia and nitrogen oxide emissions (Table 1). We propose safe global-scale ESBs of 61 (35–84) Tg N per year for agricultural nitrogen surplus72 and 4.5–9.0 Tg P per year for cropland soil phosphorus surplus73,74 (medium confidence in Extended Data Table 1). These ESBs are based on recent papers72,74 calculating subglobal and global agricultural nutrient losses, surpluses and inputs from critical N and P concentrations in water and air beyond which eutrophication occurs (Methods, Table 1 and Supplementary Methods). These ESBs primarily relate to agriculture, which accounts for approximately 90% of anthropogenic N/P inputs to the Earth system72,75. Our ESBs are based on agricultural surpluses and losses72,74, although for comparison with previous PB quantifications (Supplementary Methods), we also provide corresponding global inputs assuming current N/P use efficiency. These recent studies also account for non-agricultural sources, assuming they remain at current levels, and the redistribution of nutrients from over-fertilized to under-fertilized regions (Supplementary Methods).
Elevated N and P concentrations cause harm through the consequences of eutrophication on ecosystems and their services, such as fishery collapse, toxic compounds released by algal blooms72,76 and the health impacts of air pollution from ammonia-derived aerosols77. Harm can also occur from drinking surface or groundwater with elevated nitrate concentrations78 but at a higher level than the safe N concentration for surface water eutrophication. We therefore align the just (NSH) ESBs for subglobal N and subglobal and global P with their safe boundaries, as human harm from nutrient cycle disruption is primarily driven by environmental degradation. Accounting for significant harm from groundwater nitrate tightens the global N boundary slightly to 57 (34–74) Tg N per year (Supplementary Methods). These ESBs should be complemented by standards for local air and water pollution for N and water pollution for P. Additional justice considerations include lack of access to N and P fertilizers, which can threaten food security especially for low-income communities and countries76, and extraction of phosphate rock, which is a limited resource currently underpinning food production but exposes poor and marginalized communities to mining waste, destroyed land and human rights abuses76,79.
Aerosol pollution
For aerosols, we propose a safe ESB defined by the interhemispheric difference in aerosol optical depth (AOD) (Table 1) based on evidence that a rising North/South Hemisphere difference can trigger regional-scale tipping points and cause substantial adverse effects on regional hydrological cycles, in addition to the existing PB of 0.25–0.50 AOD based on regional considerations27. We consider AOD differences and their potential impacts arising from natural emissions, anthropogenic emissions and stratospheric aerosol injection (solar geoengineering). Observational data for the West African monsoon rainfall80 and climate modelling studies for the Indian monsoon81 have identified potential shifts in the location of the Intertropical Convergence Zone triggered by differences in sulfate AOD between the Northern and Southern Hemispheres81. Observational studies on the impacts of interhemispheric AOD difference on the Indian monsoon are lacking, but observations based on past volcanic eruptions and climate modelling studies show that an increased concentration of reflecting aerosols in one hemisphere leads to precipitation decreasing in the same hemisphere’s tropical monsoon regions while increasing in the opposite hemisphere80,82,83. Observed changes in the South Asian monsoon have well-understood mechanisms (Supplementary Information) that are consistent with the effects of interhemispheric AOD difference84. The volcanic eruptions of El Chichon in the 1980s (AOD difference of 0.07) and Katmai (AOD difference of 0.08) provide empirical examples80, while model-simulated AOD differences of 0.1 and approximately 0.2 lead to declining precipitation in tropical monsoon regions85. Interhemispheric AOD difference and its impact on shifts in tropical precipitation are sensitive to the aerosol particle size and the latitudinal and altitudinal distribution of reflecting aerosols86. Considering this and the range of these studies (approximately 0.05–0.20 of additional AOD difference), we assess that these shifts may become disruptive if the interhemispheric AOD difference, currently approximately 0.0587 on average and approximately 0.1 in the boreal spring and summer87, exceeds 0.15 (low confidence in Extended Data Table 1) due to air pollution85 or geoengineering-related aerosol asymmetries81,85 (Supplementary Methods).
Significant harm to human health from exposure to aerosols, such as particulate matter (PM), suggests a more stringent just (NSH) boundary based on local air pollution standards88. PM and other aerosols are associated with respiratory illnesses and premature deaths as well as heart problems and debilitating asthma89. We select a just (NSH) boundary of 15 μg per m3 mean annual exposure to PM 2.5 to avoid a high likelihood of significant harm from aerosols (Table 1 and Supporting Information) based on World Health Organization 202188 guidelines (Table 1) and European Union and US Environmental Protection Agency air quality standards90,91. Such local and regional guidance is needed because PM 2.5 characteristics, such as toxicity, are highly place and source specific. Eighty-five percent of the world population is currently exposed to PM 2.5 concentrations beyond this boundary92, and exposure to ambient PM 2.5 is estimated to cause 4.2 million deaths annually89, with vulnerable groups being affected disproportionately more while polluting less93. Air pollution scenarios based on globally successful stringent mitigation and pollution control show reductions in affected populations, but areas of high air pollution might remain94. A 15 μg per m3 PM 2.5 concentration translates95,96 to an AOD of approximately 0.17, indicating that the just (NSH) boundary for aerosols is more stringent than the safe regional boundary (0.25–0.50) (Table 1).
Novel entities and other pollutants
We acknowledge the risks to Earth system stability and human well-being from other air and water pollutants, for which there are already well-accepted guidelines88, and the emerging threats from novel entities, new forms of existing substances and modified life forms that are geologically or evolutionarily novel and could have large-scale unwanted geophysical or biological impacts on the Earth system27,97. Evidence on the diverse risk potentials of novel entities, such as microplastics, ‘forever chemicals’, antibiotics, radioactive waste, heavy metals or other emerging contaminants, for Earth system function and human health and food security is increasing, but knowledge gaps on the scale and scope of potential impacts remain98. Persson et al.97 reported that humanity has crossed the PB for novel entities, although data limitations and quantification are challenging even for the known novel entities. The differentiated impacts of novel entities already witnessed today across different populations and the long lifetimes of these substances raise clear intragenerational and intergenerational justice concerns97,98.
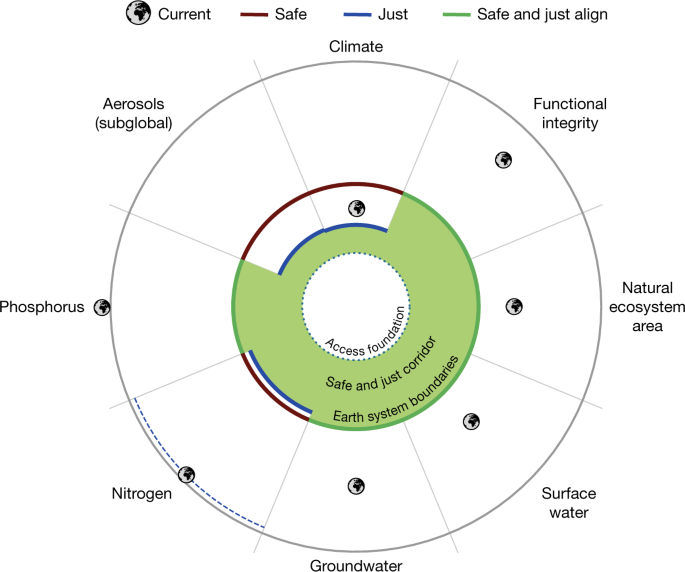
Current state
Seven of the eight global-scale safe and just ESBs that we quantified have already been crossed (Fig. 1 and Table 1). Transgression of ESBs is spatially widespread, with two or more safe and just ESBs transgressed for 52% of the world’s land surface, affecting 86% of the global population (Fig. 3). Some communities experience many ESB transgressions, with four or more ESBs transgressed for 28% of global population but only 5% of global land surface (Fig. 3). Spatial hotspot transgressions are therefore concentrated in regions of higher population density, raising major intragenerational justice concerns.