The spline GIS model was used to evaluate the distribution of fluoride levels in the drinking water samples from YGA. As mentioned, all the samples of drinking water from YGA had fluoride levels lower than the maximum permissible level of the world standard concentration and equal to the Iranian standard (0.5–1.5 mg/L)8.
The results are shown in Fig. 1. This figure shows the zoning of water samples and fluoride levels in different parts of YGA. As mentioned, 10 distinct locations were chosen according to the difference in the concentration of fluoride in drinking water. In each season, 30 samples were taken from 10 districts (three samples from each district). Hence, in two seasons, a total of 60 samples were collected (summer and winter). Each sample was tested thrice. The total number of tests to determine the fluoride concentration was 180. The Kolmogorov–Smirnov test was used to evaluate the normality of the data, and it was found that the data was not normally distributed for P < 0.05. Therefore, non-parametric tests (Kruskal–Wallis (were used to analyze the same. The median (interquartile range) of fluoride, and the temperature and pH of the drinking water have been shown in Table 1.
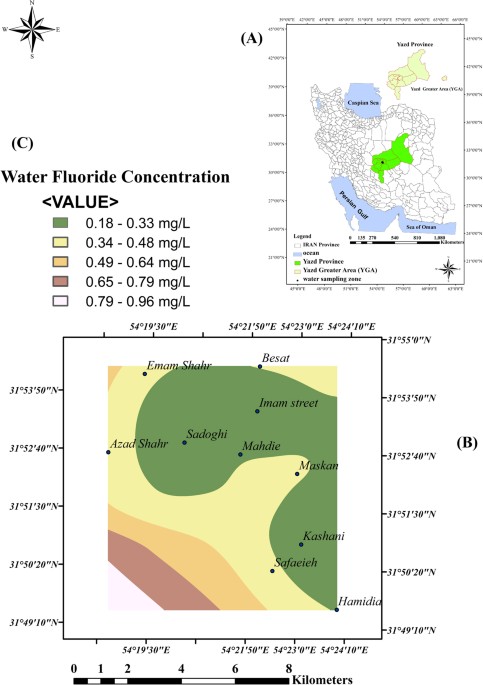
Figure 1 Zoning of fluoride levels in drinking water sampling in Yazd Greater Area (YGA) by Spline GIS model by Arc GIS 10 in Iran in 2016 (A) map of Iran and location of YGA (B) Spline GIS model for drinking water fluoride in ten distinct (C) water fluoride concentration. Full size image
Table 1 Drinking water quality parameters of YGA in case and control groups, YGA (Yazd Greater Area), 2017. Full size table
Out of the 8,724 YaHS samples that were studied until October 2015, a total of 693 (8%) participants had thyroid problems, while 70% had hypothyroidism. Among the participants who had no thyroid problems, as diagnosed by a doctor, 228 people were chosen and their TSH, T 3 , and T 4 hormone levels were tested. The results showed that 213 of the participants were healthy, whereas 15 (6.6%) were sick. Among the latter, 11 (4.8%) suffered from hypothyroidism while four (1.8%) had hyperthyroidism. These 15 sick participants were removed from the controls. The distribution of different kinds of thyroid diseases in the 265 cases include 198 (74.7%) with hypothyroidism, 10 (3.7%) with hyperthyroidism, 27 (10.2%) with thyroid nodules, and one (0.37%) with thyroid cancer. As per the scope of this study, 198 (74.7%) participants with hypothyroidism were selected for the cases. The distribution frequency of hypothyroidism obtained by the chi-square test was statistically significant for the cases (P = 0.032) and controls (P = 0.024) at different participant locations in YGA.
Ten distinct locations were chosen according to the difference in the concentration of fluoride in drinking water. These ten distinct locations were contain: Sadoughi, Imam street, Kashani Street, Mahdieh Street, Hamidia Street, Be’sat Street, maskan Street, safaeieh Street, imam Shahr Street, Azad Shahr Street. The frequency distribution of fluoride was statistically significant for the cases (P = 0.001) and controls (P = 0.001). The frequency distribution of hypothyroidism based on the different levels of fluoride in drinking water was not significant for the cases (P = 0.13) and controls (P = 0.21) in YGA. The average amount of TSH and T3 hormones based on the fluoride levels in the range of 0–0.29 mg/L and 0.3–0.5 mg/L was significant. However, it was not significant for the T4 hormone in the case and control groups as shown in Table 2.
Table 2 The amount of T 4 , T 3 , and TSH hormones based on two levels of fluoride in drinking water in cases and controls, YGA (Yazd Greater Area), 2017. Full size table
As shown in Table 2, the median ± interquartile range (IR) of TSH and T3 was significant on two levels of fluoride in drinking water (P < 0.05). Hence, it can be concluded that the halogen has an impact on human thyroid hormones. At a concentration of below 0.5 mg/L, however, it is not an important factor for hypothyroidism in YGA. This finding confirms the results of other studies10,11,12,13,14,15,16,30. The mean of the TSH hormone level, according to different study variables, is demonstrated in Table 3. For each of the questioned parameters of cases and controls, the OR, confidence interval (CI 95%), and p-value were examined across different case and control groups. The ones with a p-value less than 0.2 were used on the final logistic model. Finally, 14 parameters were entered into the final logistic model: sex, family history of thyroid disease, education and job status, quantity of drinking water, exercise, tobacco use, living place, and disease history, such as hyperlipidemia, diabetes, hypertension, polycystic, psychiatric, and depression. The adjusted odds ratio (OR), confidence interval (CI 95%), and p-value from the logistic model among the case and control groups were estimated for other fluoride intake sources, apart from water—such as toothpaste, mouthwashes, and some foods that contain fluoride (tea, cabbage, broccoli, turnip, soya, peanut, spinach, type of consumed fish, amount of consumed fish, type of consumed salt). Except for the 14 parameters that have been mentioned, other parameters had a p-value of more than 0.2, and were not used in the final logistic model. The final model was developed using multiple logistic regression modeling, as well as enter and forward LR methods. The results of the multiple logistic regression model with the p-value, adjusted OR, and confidence intervals (CI 95%) are shown in Table 4.
Table 3 Mean of TSH hormone according to different study variables, YGA (Yazd Greater Area), 2017. Full size table
Table 4 The results of multiple logistic regressions model for factors affecting the hypothyroidism in case and control groups, YGA (Yazd Greater Area), 2017. Full size table
As shown in Table 4, the variables that had greater effects on thyroid diseases remained in the model, such as gender, family history of thyroid disease, amount of water consumption, physical activity, as well as diseases such as type 2 diabetes and hypertension. The adjusted OR of hypothyroidism was 2.5 (CI 95%: 1.6–3.9) times greater in females, which is in agreement with another study31. The adjusted OR of hypothyroidism for those with a family history of hypothyroidism was 2.7 times (CI 95%: 1.6–4.6) higher than others. The adjusted OR of hypothyroidism was 5.34 (CI 95%: 3.2–9) times greater for those who were physically inactive as compared to their active counterparts. The adjusted OR of hypothyroidism for diabetic patients was 3.7 (CI 95%: 1.7–8) times higher than in healthy people. The adjusted OR of hypothyroidism for hypertensives was 3.2 (CI 95%: 1.3–8.2) times more than others. Individual fluoride intake from drinking water obviously depends on the amount of water consumed as well as the fluoride concentration in the water. The results showed that those who consume larger amounts of water per day have an adjusted OR of 4.1 (CI 95%: 1.2–14).
This study was the first research based on the correlation between fluoride concentration in drinking water and thyroid hormones in Iran. A positive association was observed between the variables (P < 0.05). In this study, we obtained an unadjusted OR of about 1.034 (CI 95%: 0.7–1.53) for fluoride in drinking water when its concentration was less than the standard (0.2–0.5 mg/L). This finding is consistent with the Peckham study in England, which reported OR = 1.5 (CI 95%: 1.16–2) for hypothyroidism, where the maximum fluoride concentration was more than 0.7 mg/L. However, it is not clear due to the small difference in the concentration of fluoride, as can be seen from the correlation between fluoride in drinking water and the TSH hormone as shown in Table 232.