Observed and modeled SIA changes
Observed and model-simulated Arctic SIA changes are compared first. Figure 1 displays the anomaly time series of 3-year mean Arctic SIA and their linear trends during the past 41 years (1979–2019) for all calendar months from three observational data sets and CMIP6 multi-model means (MMM) for anthropogenic plus-natural (ALL), greenhouse gas only (GHG), aerosol only (AER), and natural only (NAT) forcings (see Methods). Annual mean results are provided at the top for comparison and the 5–95th percentile values of preindustrial control (CTL) runs (gray dashed lines) are added to measure the internal variability ranges. Three sets of observations (OSISAF, NASATeam, and Bootstrap; see Methods) consistently exhibit decreasing trends throughout all calendar months, with stronger amplitudes in warm seasons than in cold seasons, consistent with previous studies1. Bootstrap data show slightly stronger trends while OSISAF data have relatively weak trends as can be seen in annual mean trends. These observed trends are beyond the internal variability ranges for all calendar months, even in cold months, confirming the significant year-round melting of Arctic sea ice during recent decades.
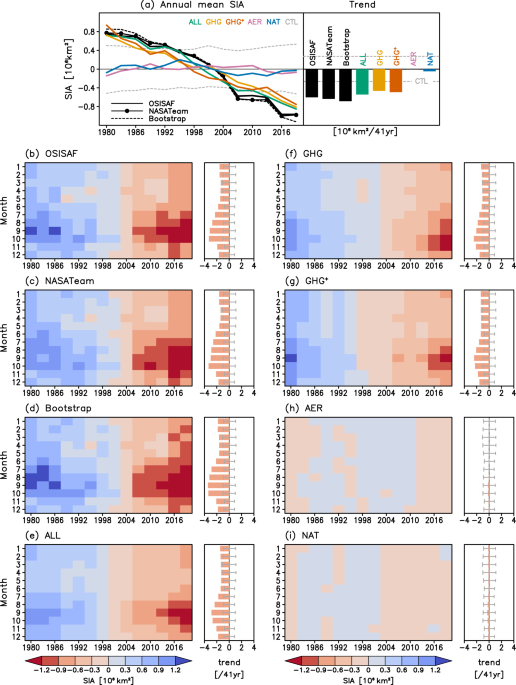
Fig. 1: Time series of observed and simulated Arctic sea ice area (SIA) and their linear trends. 3-year mean time series of observed and simulated Arctic SIA for 1979–2019 for a annual mean (line plot) and b–i each calendar month (shading), and their linear trends (bars) and 5–95% ranges (gray dashed lines or error bars) estimated from the preindustrial control (CTL) simulations. Three observations (OBS) from OSISAF, NASATeam, and Bootstrap are compared with Coupled Model Intercomparison Project Phase 6 (CMIP6) multi-model simulations from historical (ALL; anthropogenic plus natural forcing), hist-GHG (GHG; well-mixed greenhouse gas only forcing), hist-aer (AER; anthropogenic aerosol-only forcing) and hist-nat (NAT; natural only forcing) experiments. The residual GHG distribution (GHG+) obtained by All–AER–NAT is displayed. SIA anomalies are obtained by computing non-overlapping 3-year averages (2-year averages for 2018–2019) relative to the 1979–2019 means. ALL runs are extended by using Shared Socioeconomic Pathway (SSP) 2–4.5 scenario runs since 2015. Full size image
The temporal evolution patterns of ALL simulations are overall consistent with those observed, capturing year-round significant melting and the strongest melting during September–October. However, decreasing trends in ALL are on average weaker than observations, particularly in the warm season (also see Fig. S2). GHG runs also resemble the observed melting patterns but exhibit slightly weaker trends than ALL runs, suggesting other forcing influences like tropospheric ozone or reductions in aerosol emissions may slightly increase the trends in ALL. Note that while previous studies indicate an aerosol-driven increase in SIA since 1950, CMIP5 simulations, consistent with the simulations shown here, show little change in SIA in response to aerosols in the period since 19805. Indeed, GHG+ patterns (constructed as ALL–AER–NAT, see Methods), which reflect the combined response to increases in all greenhouse gases including tropospheric ozone19, show stronger sea ice melting than GHG patterns (which reflect the response to well-mixed greenhouse gases only) in annual time series, long-term trends, and seasonal evolutions. NAT forcing shows a slight decrease in Arctic SIA for all calendar months, contributing to the observed trend. This NAT-induced sea ice melting seems to be associated with no major volcanic eruptions after Pinatubo (1991), as can be clearly seen from the annual mean time series. Actually, Arctic SIA in NAT has a maximum near 1995, consistent with the previous finding6 that Arctic sea ice extent peaks 5 years after volcanic eruptions. A small increase in Arctic SIA after El Chichón eruption (1982) is noticeable as well. AER runs exhibit negligible long-term trends in Arctic SIA over the 1979–2019 period with a seasonal contrast—increasing in winter and spring and decreasing in summer and fall. The negative Arctic SIA trend in the warm season might be partly related to the observed decreases in anthropogenic aerosol emissions since the 1980s7.
Attribution results
Three-signal detection analyses are conducted by regressing the observations onto GHG+, AER, and NAT (i.e., in a three-way regression, see Methods). Figure 2 shows results for each calendar month obtained using OSISAF, NASATeam, and Bootstrap observations. GHG+ signals are detected in all calendar months from all observations while almost no detection occurs for AER and NAT signals. This result indicates a GHG+ influence on every month’s Arctic SIA decrease, which is separable from AER and NAT signals. In most of the detected cases, the 90% range of scaling factors (regression coefficients, see Methods) includes unity, indicating consistency in amplitude with the observed changes. However, best estimates of the GHG+ scaling factor are generally larger than unity except for November-December, meaning that models on average underestimate the observed Arctic SIA decrease over the past 41 years, as shown above in Fig. 1. Consequentially, these results clearly show that GHGs have contributed considerably to the observed Arctic SIA decrease for all calendar months with some underestimation by models.
Fig. 2: Results of three-signal (GHG+, NAT, and AER) detection. Three-way regression (GHG+, NAT, and AER) results for the observed changes in Arctic sea ice area (SIA) for each month for three observational data sets of a OSISAF, b NASATeam, and c Bootstrap. The best estimates (marks) and 5–95% ranges (error bars) of scaling factors (regression coefficients, see Methods) are displayed for each signal. Using 3-year mean anomaly time series of Arctic SIA (see Fig. 1), observations are regressed simultaneously onto multi-model-simulated responses (fingerprints) to three signals of GHG+, NAT, and AER forcing (see Methods). Full size image
To quantify the relative contribution of the three forcings to the observed Arctic SIA changes, attributable trends are estimated from scaled fingerprints (3-year mean SIA time series multiplied by regression coefficients) for GHG+, AER, and NAT (Fig. 3, See Methods). Results show that GHG+ explains most of the observed Arctic SIA decline across all calendar months and based on all observation data sets. The NAT contribution to the Arctic SIA decrease is up to about 10% from July to November while AER exerts a negligible influence except for causing a slight increase from February to May. The limited contribution of anthropogenic aerosols to the observed Arctic SIA change is in line with no overall long-term trend in AER time series during the analysis period (Fig. 1). This might be due to the reduced aerosol emissions over Europe and North America since the 1980s, which could offset the cooling effect of increased aerosol emissions in Asia25,26,27,28. Overall, GHG increases are found to be the main driver of the observed Arctic SIA reduction throughout the year.
Fig. 3: Attributable trends. Attributable trends (color bars) in Arctic sea ice are (SIA) for each month during 1979–2019 to GHG+, AER, and NAT forcings compared with the observed trends (OBS, black bars) from a OSISAF, b NASATeam, and c Bootstrap. Attributable trends (see Methods) are obtained based on scaling factors from the three-signal analysis shown in Fig. 2 by multiplying each signal’s fingerprint (3-year mean SIA anomaly time series) by the corresponding scaling factors (best estimates). The error bars indicate the 5–95% intervals of attributable trends calculated using the 5–95% ranges of scaling factors. Full size image
Some previous studies have emphasized the role of internal variability in driving SIA trends29, 30, and have argued, based on observations of atmospheric circulation change, that internal variability has intensified sea ice decreases over recent decades29. Other studies suggest that climate models underestimate multi-decadal internal variability in extratropical temperature and precipitation31, 32. While we restrict our attention to observations and simulations of sea ice extent itself, our optimal fingerprint analysis accounts for the influence of internal climate variability by using simulated internal variability from the preindustrial control simulations to estimate uncertainties in regression coefficients. This approach is in turn validated by checking the consistency of observed and model-simulated variability using a residual consistency test (see Methods). Results show that SIA for all months passes the residual consistency test (Fig. 2, no marks under scaling factors), meaning that the modeled variability is consistent with the observed residual variability. Further, based on a comparison of power spectra (Fig. S3), on inter-annual to decadal time scales, the CMIP6 multi-model mean exhibits similar variability of SIA to the observations, and the observed power spectra lie within the inter-model range. This indicates that the models used in this study do not underestimate SIA variability, and hence our estimates of attributable trends and their uncertainties are expected to be reliable.
Observationally-constrained future SIA
Using the scaling factors for the detected GHG+ signal, and their associated uncertainty intervals, observationally-constrained future projections of Arctic SIA are obtained and sea ice-free years are estimated based on multi-model means for four SSP scenarios (SSP1-2.6, SSP2-4.5, SSP3-7.0, and SSP5-8.5). This is done for the three observational data sets separately, to assess the influence of observational uncertainty. Figure 4a–d show results for September Arctic SIA. Unconstrained raw projections (black lines) indicate decreases in Arctic SIA with different slopes depending on SSP scenarios. Except for SSP1-2.6, Arctic SIA decreases past the ice-free threshold (1 × 10⁶ km2) around the 2050s–2060s in the unconstrained projections, but it does not reach this threshold in the SSP1-2.6 scenario (also see Fig. 4e, f). This is consistent with the full-model ensemble based projections1, 23.
Fig. 4: Observationally-constrained future projection. Time series of Arctic sea ice area (SIA) in September over the period 1979–2100 from three sets of observations (OSISAF, NASATeam, and Bootstrap) and Coupled Model Intercomparison Project Phase 6 (CMIP6) multi-model means of the a Shared Socioeconomic Pathway (SSP) 1–2.6, b SSP2-4.5, c SSP3-7.0, and d SSP5-8.5 scenario simulations. Colored lines indicate observations for the historical period (1979–2019) and observationally-constrained projections for the future period (2020–2100) which are obtained by scaling raw projections (black lines) with GHG scaling factors (see Fig. 2). Colored shading indicates the uncertainty ranges (5–95%) of observationally-constrained projections (based on 5–95% ranges of GHG+ scaling factors). e–h CMIP6 projected sea ice-free years (defined as the year when monthly mean multi-model mean SIA drops below 1 × 10⁶ km2 for the first time) for different SSP scenarios. Marks and vertical dashed lines indicate the best estimate and 5–95% ranges, respectively, of constrained projection results based on GHG scaling factors for three observations. Horizontal lines indicate results from unconstrained projections. Full size image
The observationally-constrained projections (colored lines) exhibit a faster decline of Arctic SIA than the raw time series, which can be seen in all SSP scenarios (Fig. 4a–d). This faster retreat of Arctic sea ice in constrained projections is due to GHG+ scaling factors larger than unity, which reflects CMIP6 models’ underestimation of the observed trend as discussed above. The stronger SIA declines have advanced first ice-free years to around the 2030s–50s in all SSP scenarios. Importantly, the earlier occurrence of an ice-free Arctic in September becomes evident even in the SSP1-2.6 low emission scenario in all observations (circle marks in Fig. 4e). It is also found that an ice-free Arctic before 2100 occurs in other months (Fig. 4e–h). There are clear differences between scenarios, e.g., with an ice-free Arctic in August to September in SSP2-4.5 vs. June to October in SSP5-8.5, representing more ice-free months under a higher emission scenario. Overall, our constrained projections indicate a faster arrival of an ice-free Arctic by around a decade, than previous studies based on CMIP5 models10, 33.
To evaluate the constrained projection approach, we conducted an imperfect model test using pseudo observations of SIA (see Methods). Results show that the correlation coefficients between constrained SIA and simulated SIA for 2031–2050 ranges from 0.44 to 0.57 across four SSP scenarios, all of which are statistically significant (Fig. S4). Also, root mean square errors (RMSEs) from constrained projections are reduced (0.71–0.88 × 10⁶ km2) compared to the unconstrained cases (0.95–1.39 × 10⁶ km2). These high correlations and reduction in RMSE indicate good predictability for GHG-constrained SIA irrespective of future emission scenarios.