An integrative systems biology approach for constructing single cell-type regulatory networks of AD
We developed an integrative network analysis pipeline to construct data-driven neuron-specific predictive networks of AD (Fig. 1). The overall strategy for elucidating the single cell-type gene network model depicted in Fig. 1 centers on the objective, data-driven construction of causal network models, which can be directly queried to identify the network components causally associated with AD as well as the master regulators (key drivers) of these AD-associated components. This model also predicts the impact of the key drivers on the biological processes and pathology involved in AD, moving us towards precision molecular models of disease. We previously developed this network reconstruction algorithm, i.e., predictive network, which statistically infers causal relationships between DNA variation, gene expression, protein expression, and clinical features measured in hundreds of individuals23,59,60.
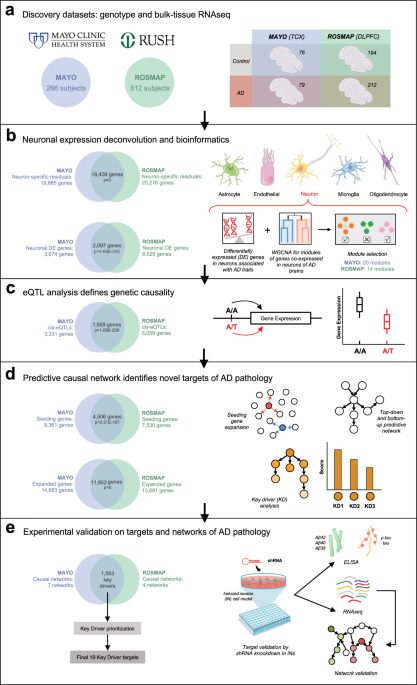
Fig. 1: Integrative network analysis pipeline to construct data-driven neuron-specific predictive networks of AD and predict key drivers associated with AD pathology. a Discovery datasets include whole-genome genotype and RNAseq data of temporal cortex from the MAYO cohort and dorsolateral prefrontal cortex from the ROSMAP cohort in the AMP-AD consortium. Numbers in circles indicate the total number of subjects in each dataset with quality-controlled matched genotype and RNAseq data used in this study, whereas numbers in the table indicate the number of individuals of each phenotype used in the subsequent DE, co-expression module, and predictive network analyses. b Computational deconvolution of bulk-tissue RNAseq data into 5 single cell-type RNAseq sets per cohort dataset, followed by DE analysis and weighted gene co-expression network analysis in each cohort’s neuron-specific gene expression dataset. c mRNA expression and quantitative trait loci association analysis in each dataset provides a source of systematic perturbation for network reconstructions. d Construction of neuron-specific predictive network models and identification of key drivers (master regulators) from each dataset. e Prioritization of key driver targets from both datasets and experimental validation by shRNA-mediated gene knockdown in human iPSC-derived neurons. Venn diagrams on panels b–e indicate cross-validation at each step of the bioinformatics analyses performed independently in parallel for the MAYO and ROSMAP datasets, resulting in a single set of key driver targets. Statistical tests for each comparison are described in the text where relevant. Parts of this figure utilize graphics from Servier Medical Art (smart.servier.com) provided by Servier, licensed under a Creative Commons Attribution 3.0 Unported License. TCX temporal cortex, DLPFC dorsolateral prefrontal cortex, WGCNA weighted gene co-expression network analysis, eQTL expression quantitative trait locus. See also Supplementary Fig. 1. Full size image
The inputs required for our network analysis are the molecular and clinical data generated in the MAYO and ROSMAP populations, as well as first order relationships between these data such as quantitative trait loci (QTLs) associated with the molecular traits. These relationships are input as structure priors to the network construction algorithm as a source of perturbation, boosting the power to infer causal relationships at the network level, as we and others have previously shown21,23,24,60,73,74,75,76,77,78,79,80. To focus on the component of AD that is intrinsically encoded in neurons, we identified the neuron-specific expression component in each cohort by applying the PSEA deconvolution algorithm52 to the MAYO and ROSMAP transcriptomic datasets independently (Supplementary Fig. 1, Step 1). We further focused on the molecular traits associated with AD by identifying DE gene signatures—comprised of several thousands of gene expression traits—between AD and cognitively normal samples for each dataset (Supplementary Fig. 1, Step 2). To identify correlated gene expression traits associated with AD, we constructed gene co-expression networks for each dataset, and from these networks we identified highly interconnected sets of co-regulated genes (modules) that were significantly enriched for AD gene signatures (the significant DE genes) as well as for pathways previously implicated in AD (Supplementary Fig. 1, Step 3). To obtain a final set of genes for input into the causal network construction process for each dataset, we combined genes in the co-expression network modules enriched for AD signatures (Supplementary Fig. 1, Step 5—Module selection) and performed the pathFinder algorithm60 to enrich the seeding gene set by including genes upstream and downstream of this set from a compiled pathway database (Supplementary Fig. 1, Step 5—Seeding expansion). We note that during the expansion of seeding genes, we only include additional genes from the compiled pathway database as nodes in the network, and we discard the disease non-specific edges so as not to bias the process of data-driven network structure learning. The edges of the final extended networks are solely inferred from AD-specific data in each cohort.
With our input set of neuron-centered genes for the AD network constructions defined, we mapped expression-QTLs (eQTLs) for neuron-specific gene expression traits in each dataset to incorporate the eQTLs as structure priors in the network reconstructions, given that they provide a systematic perturbation source that can boost the power to infer causal relationships (Supplementary Fig. 1, Step 4)24,73,74,76,77,78,79,80,81. The input gene set and eQTL data were then processed by an ensemble of causal network inference methods, including Bayesian networks and our recently developed top-down and bottom-up predictive networks23,59,60,69, in order to construct probabilistic causal network models of AD independently in the MAYO and ROSMAP cohorts (Supplementary Fig. 1, Step 6). We next applied a statistical algorithm to detect key driver genes in each given network structure82 and to identify and prioritize master regulators in the AD networks (Supplementary Fig. 1, Step 7). These key drivers derived from the individual networks across datasets were then pooled and prioritized based on ranking scores of impact and robustness (see ‘Methods’), resulting in a final group of 19 top-prioritized key drivers for which we performed functional validation in a human iPSC-derived neuron system. The entire analysis workflow for the independent datasets, resulting in this final group of replicated targets, is illustrated in Fig. 1.
MAYO and ROSMAP study populations and data processing
Our causal network pipeline starts by integrating whole-genome genotyping and RNAseq data generated from patients spanning the complete spectrum of clinical and neuropathological traits in AD. We used patient data from two separate cohorts within the AMP-AD consortium: temporal cortex data from 266 subjects in MAYO83,84,85 and dorsolateral prefrontal cortex data from 612 subjects in ROSMAP22,86,87,88 (Fig. 1a). We processed matched genotype and RNAseq data separately in each dataset (Fig. 1, Supplementary Fig. 1; see ‘Methods’).
Central nervous system (CNS) tissue consists of various cell types, including neurons, glia, and endothelial cells. To discover key network drivers specific to a single cell type in the CNS and study their contribution to AD in that specific cell type, we utilized verified single-cell marker genes to directly deconvolve bulk-tissue gene expression data into cell type-specific gene expression for the five major cell types in the CNS: neurons, microglia, astrocytes, endothelial cells, and oligodendrocytes (see ‘Methods’). In this study, we focused on investigating the role of neuronal cells in AD, as they are the primary cell type affected by AD pathogenesis89,90,91,92,93,94. After normalizing the bulk-tissue RNAseq data, we performed variance partition analysis (VPA)95 to evaluate the contributions of cell type-specific markers as well as demographic, clinical, and technical covariates (such as batch effects) to the gene expression variance before performing any covariate adjustment (Supplementary Fig. 2a, b). The cell type-specific marker genes used for neurons, microglia, astrocytes, endothelial cells, and oligodendrocytes were ENO296, CD6897, GFAP98, CD3499, and OLIG2100,101,102, respectively, as previously published having been obtained directly under the AD condition at the protein level. The VPA results reflect the prominent effect of CNS cell types on the variance of the brain RNAseq data. In the MAYO dataset, the additional covariates used in the VPA included exonic mapping rate, RNA integrity number, sequencing batch, diagnosis, age at death, tissue source, APOE genotype, and sex. In the ROSMAP dataset, we were able to include the same covariates with the exception of tissue source and the addition of age at first AD diagnosis, post-mortem interval, education, and study (ROS or MAP).
We then performed covariate adjustment and deconvolution using the PSEA method52 in each dataset, calculating gene expression residuals using a linear regression model to adjust the normalized bulk-tissue expression data with demographical and technical covariates as well as the cell type-specific markers. Cell type-specific gene expression, including the neuron-specific component, was directly derived by adding the estimated variance of each cell type to the residual (see ‘Methods’), avoiding the need to first estimate the cell population from bulk tissue data, which could induce approximation errors. We then repeated VPA in the neuron-specific residuals of each dataset to demonstrate that our deconvolution and covariate adjustment methods properly capture the neuronal component while removing potential confounds such as batch effect, age, and sex (Supplementary Fig. 2c, d). Finally, to justify the use of single cell type-specific markers for deconvolution by the PSEA method, we performed a set of analyses comparing multiple cell type-specific biomarker lists (derived from existing scRNAseq studies) to each other (Supplementary Fig. 3a), to our AD residuals (Supplementary Fig. 3b, c), and to the AMP-AD Agora list of potential therapeutic targets in AD (Supplementary Fig. 3j, k), as well as a robustness analysis demonstrating that our neuron-specific residual derived from ENO2 expression represents a robust neuronal component in the bulk-tissue RNAseq data when compared to random selections of multi-gene neuronal biomarkers derived from these scRNAseq datasets in AD (Supplementary Fig. 3b–i; see ‘Methods’).
Identifying AD-associated gene signatures in neurons and mapping their eQTLs
To identify an AD-centered set of neuronal gene expression traits, we performed DE analysis using the deconvoluted neuron-specific expression residuals in the MAYO and ROSMAP cohorts (see ‘Methods’). In comparing expression data between AD and cognitively normal controls (MAYO: 79 AD, 76 control; ROSMAP: 212 AD, 194 control), there were 3674 significant DE neuron-specific genes in the MAYO dataset (hereby MAYO-neuron) and 6626 neuron-specific DE genes in the ROSMAP dataset (hereby ROSMAP-neuron) (Fig. 2a, b; Supplementary Fig. 4; Supplementary Data 1). There were 2097 significant DE genes overlapping between the two datasets (Fisher’s exact test, odds ratio = 3.9784, p-value = 4.66E-242), thus cross-validating the neuron-specific DE signatures independently derived from the two cohorts.
Fig. 2: Neuron-specific gene expression signatures in AD. DE analysis of deconvoluted neuron-specific residuals identifies a robust DE signature associated with the difference between AD patients and cognitively normal controls. a, b All significantly up- and down-regulated genes for MAYO-neuron (a) and ROSMAP-neuron (b). Significance was assessed by t-test with FDR < 0.05; thresholds of logFC shown in each volcano plot are for visualization only. MAYO (n = 79 and 76 for AD and cognitively normal) and ROSMAP (n = 212 and 194 for AD and cognitively normal). Gene symbols are highlighted in red text for the 19 key drivers later prioritized for experimental validation in vitro. See also Supplementary Fig. 4. c Pathway enrichment analysis on the neuron-specific DE expression signatures using human ConsensusPathDB reveals dysregulated biological processes associated with AD. Significance was assessed by Fisher’s exact test with p-value < 0.05. Source data for this panel is provided in Supplementary Data 13. Detailed statistical results of DE genes and enriched pathways are summarized in Supplementary Data 1 and 2, respectively, and overlapped pathways are summarized in Supplementary Data 13. Full size image
To examine the biological processes that are dysregulated in AD cases versus controls as reflected in the DE signatures, we performed pathway enrichment analysis on the MAYO-neuron and ROSMAP-neuron gene sets using Human ConsensusPathDB103,104,105,106,107. We identified 75 and 73 enriched pathways in each dataset, respectively, with 7 pathways that were significantly dysregulated in both datasets (Fig. 2c; Supplementary Data 2, 13). These signatures were enriched for a number of cellular/molecular pathways, including those involving CDC42108,109,110, IRAK/IKK111,112,113, EGFR/PLCG114, GAD115, Hippo116, and clock genes117,118, some of which have been implicated and/or interrogated in AD previously. Additional pathways of note implicated by a single cohort dataset with known relevance to amyloid and/or tau pathology include those related to NF-κB activation119,120 and N-cadherin signaling121,122.
We further validated our neuron-specific DE signatures in AD, which were derived from deconvoluted bulk-tissue RNAseq data, by comparing our MAYO-neuron and ROSMAP-neuron DE genes with the excitatory and inhibitory neuronal signatures identified by a separate study that generated scRNAseq data from the same ROSMAP cohort123. We employed the sampling-based method described in ref. 123 and first compared the pair-wise enrichment among the scRNAseq-derived DE gene signatures in the ROSMAP dataset123 for excitatory neurons, inhibitory neurons, astrocytes, oligodendrocytes, oligodendrocyte progenitor cells, and microglial cells (Supplementary Data 3). Briefly, we found that the excitatory neuron signature significantly overlaps with inhibitory neurons, astrocytes, oligodendrocytes, and oligodendrocyte progenitor cells (FDR = 1.24E-25, 2.26E-03, 2.69E-04, and 1.36E-02, respectively) but is not enriched for microglia (FDR = 0.58). We also found that the inhibitory neuron signature is significantly enriched for astrocytes (FDR = 3.83E-02) and oligodendrocytes (FDR = 9.30E-07), but not oligodendrocyte progenitor cells (FDR = 1) or microglia (FDR = 1). The significant overlap among scRNAseq-derived DE signatures of different cell types highlights the intrinsic biological interactions among different cell types in the AD brain. Next, we found a similar pattern of enrichment between our MAYO-neuron and ROSMAP-neuron DE signatures and scRNAseq-derived DE gene signatures from ROSMAP123 (Supplementary Data 4), i.e. their excitatory neuron signature (FDR = 3.41E-10 and 3.56E-17, respectively) as well as their inhibitory neuron signature (FDR = 0.0285 and 0.00429, respectively), demonstrating significant correlation between our deconvoluted neuron-specific DE signatures and scRNAseq-derived neuronal signatures in AD. The greater excitatory-neuronal enrichment among our deconvoluted neuron-specific DE signatures is consistent with ref. 123 and similarly suggests that our deconvoluted RNAseq datasets capture the aberrant increases in neuronal excitotoxicity associated with AD in humans124. Thus, overall, despite the inherent multi-cell type interactions revealed by these analyses, we argue that our deconvoluted neuron-specific AD signatures are robust and provide a complementary solution to single cell-type transcriptomics analysis.
Another critical input for the construction of Bayesian network and causal predictive network models are the eQTLs, leveraged as a systematic source of perturbation to enhance causal inference among molecular traits. This is an approach we and others have demonstrated across a broad range of diseases and data types24,69,73,74,75,76,77,79,80,81,125,126,127,128,129,130,131,132,133,134,135,136,137,138. We mapped cis-eQTLs by examining the association of neuron-specific expression traits with genome-wide genotypes18,139,140,141 assayed in the MAYO and ROSMAP cohorts (see ‘Methods’). In the MAYO- and ROSMAP-neuron sets, 3331 (16.8%) and 5059 (25.0%), respectively, of the residual genes were significantly correlated with allele dosage (FDR < 0.01) (Supplementary Data 5). Of the cis-eQTLs detected in each cohort, 1569 genes were overlapping between the two sets (47% of MAYO cis-eQTLs and 31% of ROSMAP cis-eQTLs, Fisher’s exact test, p-value = 1.09E-209), providing further validation of the two independent cohorts.
Neuronal co-expression networks associated with LOAD
While DE analysis can reveal patterns of neuron-specific expression associated with AD, the power of such analysis to detect a small-to-moderate expression difference is low. To complement the DE analyses in identifying the input gene set for the causal network, we clustered the neuronal gene expression traits into data-driven, coherent biological pathways by constructing co-expression networks, which have enhanced power to identify co-regulated sets of genes (modules) that are likely to be involved in common biological processes under LOAD. We constructed co-expression networks on the AD patients within each dataset after filtering out lowly expressed genes (see ‘Methods’), resulting in the MAYO-neuron co-expression network consisting of 20 modules ranging in size from 30 to 6929 gene members and the ROSMAP-neuron co-expression network consisting of 14 modules ranging from 34 to 6604 gene members (Fig. 3a).
Fig. 3: Neuron-specific co-expression analysis identifies robust gene modules enriched for biological processes associated with AD. a Neuron-specific co-expression network analyses in the MAYO and ROSMAP cohorts identify gene modules associated with AD in each dataset. Module functions for each dataset were characterized by significantly enriched biological processes, with bold text indicating neuron-specific modules selected for further analysis. Each module was evaluated based on enrichment for neuron-specific DE genes, for scRNAseq derived neuron-specific biomarker genes, and for categories of available AD traits (MAYO and ROSMAP diagnosis by ANOVA; BRAAK, CERAD, and MMSE by linear regression). We also evaluated enrichment for scRNAseq-derived biomarker genes for microglia, astrocytes, endothelial cells, and oligodendrocytes to cross-validate that modules enriched for neuron-DE genes were not enriched for other cell types. Significance was assessed by Fisher’s exact test with FDR < 0.05 (n = 30 to 6929 for MAYO and 34 to 6604 for ROSMAP). b Among the neuron-specific modules in the two datasets, pathway enrichment analysis identifies robust pathways associated with AD which replicate in both cohorts. Source data is provided in Supplementary Data 2. c Cross-validation of neuron-specific co-expression modules between MAYO and ROSMAP identifies pairs of modules with significantly overlapping gene members. Significance was assessed by Fisher’s exact test with FDR < 0.05. See Supplementary Data 6 for further information on the biological processes significantly enriched in each module. Full size image
To evaluate the functional relevance of each cohort’s neuron-specific modules to AD pathology, we performed enrichment analysis of each module for its AD-associated neuronal DE signatures, known single-cell marker genes for the 5 major cell types in the CNS57, and categories of AD traits available from its respective cohort (Fig. 3a). From these enrichment results, we identified neuron-specific modules associated with AD DE genes: M1, M2, M10, M11, M15, and M16 from MAYO and M1, M5, and M10 from ROSMAP. It is worth noting that similar to the DE signatures (Supplementary Data 3), a small number of the MAYO- and ROSMAP-neuron co-expression modules are significantly enriched for astrocyte and oligodendrocyte biomarkers, highlighting the intrinsic cellular interactions between these cell types in the AD brain.
To further characterize the biological processes involved in the co-expression modules from each dataset, we performed pathway enrichment analysis to identify overrepresented biological processes within and across the modules (Fig. 3b; Supplementary Data 6). Out of the selected AD-associated modules from the MAYO- and ROSMAP-neuron co-expression networks, respectively, we found 36 and 16 significantly enriched pathways based on the Human ConsensusPathDB database, with 11 enriched pathways overlapping between the two datasets (Fisher’s exact test, odds ratio = 383.87, p-value = 5.41E-21; Supplementary Data 14). In comparing all pairs of modules between the datasets, we identified 17 module pairs with significant overlap of gene members (Fig. 3c), demonstrating the robustness of the two independent co-expression networks.
Ensemble of neuron-specific, causal gene regulatory networks identifies pathological pathways and key drivers for neuronal function in AD
The ultimate goal of this study was to identify upstream master regulators (key drivers) of neuronal pathways that contribute to AD. Following our DE, eQTL, and co-expression network analyses, we built an ensemble of causal network models—including standard Bayesian networks22,24 and state-of-the-art predictive network models21,23,60—by integrating the eQTLs and deconvoluted neuron-specific RNAseq residuals.
We first pooled all genes from the selected AD-associated modules per dataset (six MAYO-neuron modules and three ROSMAP-neuron modules, indicated in Fig. 3a) to create a seeding set of genes for each cohort for input into the network models. This resulted in 9361 seeding genes from the MAYO-neuron co-expression network and 7530 seeding genes from the ROSMAP-neuron co-expression network. We note an overlap of 4506 genes between the two seeding gene sets (48.1% of MAYO and 59.8% of ROSMAP, Fisher’s exact test, odds ratio = 2.875, p-value = 2.51E-157), indicating the reproducibility of these analyses across the two independent datasets. To further improve the robustness of our network models, we also expanded each set of seeding genes by including their known upstream and downstream genes in each cohort’s co-expression network, extracted from signaling pathway databases using the pathFinder algorithm60 (see ‘Methods’; note that we did not include the gene-gene interactions as prior edge information for network construction). Co-expression network modules are only sensitive to linear relationships between pairs of genes, whereas non-linear gene regulations will not be captured by co-expression analysis. This expansion step thus includes genes in the same pathways as the seeding genes which otherwise failed to be included in the same module derived from the co-expression networks, resulting in 14,683 expanded genes from MAYO-neuron, 13,681 expanded genes from ROSMAP-neuron, and an overlap of 11,952 genes between the two expanded gene sets (Fisher’s exact test, p-value = 0). The use of both the seeding gene set and the expanded gene set for analysis of the MAYO and ROSMAP datasets therefore increases the power to build robust networks and to discover high-confidence neuronal key drivers associated with AD pathology.
We also incorporated cis-eQTL genes into each network as structural priors. As cis-eQTLs causally affect the expression levels of neighboring genes, they can serve as a source of systematic perturbation to infer causal relationships among genes23,59,60,81. Of the 3331 and 5059 unique cis-eQTL genes identified in the MAYO- and ROSMAP-neuron datasets, respectively, 687 and 1978 overlapped with the seeding gene set and 2,162 and 2,998 overlapped with the expanded gene set. We finally proceeded to build Bayesian networks and predictive networks using the two sets of genes per dataset—i.e., 9361 seeding and 14,683 expanded genes for the MAYO dataset and 7530 seeding and 13,681 expanded genes for the ROSMAP dataset—and incorporating each dataset’s cis-eQTL genes as structural priors.
Since structure learning is a heuristic and stochastic process, we applied a wide range of cut-offs on the posterior probability of edges to derive sets of robust Bayesian and predictive network structures for each dataset. For the MAYO-neuron seeding gene set, we built Bayesian networks and applied two posterior probability cut-offs (0.4 and 0.5, see ‘Methods’) to get two MAYO-neuron Bayesian networks (MAYO-Neuron-BayesNet-Seed-1 and -2) which were comprised of 9111 and 9044 genes, respectively. In addition, we built predictive networks with the same two posterior probability cut-offs (0.4 and 0.5) to derive two MAYO-neuron predictive networks (MAYO-Neuron-PredNet-Seed-1 and -2), which also included 9111 and 9044 genes, respectively. For the MAYO-neuron expanded gene set, we built predictive networks and chose three posterior probability cut-offs (0.5, 0.6, 0.7) to get three MAYO-neuron predictive network models (MAYO-Neuron-PredNet-Expanded-1, -2, and -3), which were comprised of 14,238, 13,926, and 13,365 genes, respectively. For the ROSMAP-neuron seeding gene set, we built Bayesian networks and applied two cut-offs (0.3 and 0.4) to derive two Bayesian networks (ROSMAP-Neuron-BayesNet-Seed-1 and -2) which consisted of 6786 and 6756 genes, respectively. For the ROSMAP-neuron expanded gene set, we built two predictive networks and chose two cut-offs (0.3 and 0.4) to build two predictive networks (ROSMAP-Neuron-PredNet-Expanded-1 and -2) consisting of 12,147 and 12,074 genes, respectively. Thus, in total from the MAYO and ROSMAP datasets, we derived 11 networks for the inference of a robust set of key drivers, using several different network reconstruction methods, network gene sets, and posterior cut-offs. We demonstrate 2 of the final 11 causal network models in Fig. 4a, b (MAYO-Neuron-PredNet-Expanded-1 and ROSMAP-Neuron-PredNet-Expanded-1), and the remaining 9 causal networks are shown in Supplementary Fig. 5.
Fig. 4: Neuron-specific causal network analyses identify molecular mechanisms and key driver targets associated with AD. a, b Two predictive networks out of the final 11 neuron-specific causal Bayesian and predictive network models derived from the MAYO (a) and ROSMAP (b) seeding and expanded gene sets. The MAYO and ROSMAP networks shown here were built from their respective expanded gene sets with posterior probability cut-offs of 0.5 and 0.3, respectively. Close-up views show the 10 key driver targets which were validated in vitro (red) along with their neighboring downstream subnetworks. See also Supplementary Fig. 5. c, d The top 50 out of 1563 total key driver targets ranked individually according to impact (c) and robustness (d) scores across the 11 independent MAYO-neuron and ROSMAP-neuron Bayesian and predictive networks. Red text indicates prioritized key drivers; yellow highlights those which were validated in vitro. Source data is provided in Supplementary Data 15. Full size image
Identification and prioritization of neuronal key drivers regulating AD pathology
Having generated the causal predictive networks from the MAYO-neuron and ROSMAP-neuron datasets, we applied key driver analysis82 to derive a list of key driver genes from each network. Key driver analysis seeks to identify genes in a causal network which modulate network states; in the present analysis, we applied this analysis to identify genes causally modulating the network states of our neuron-specific Bayesian and predictive network models. In total, we identified 1563 key driver genes across the 11 independent networks.
To prioritize key drivers for further investigation, we first ranked the 1563 initial key driver targets according to two separate measures: an impact score and a robustness score (see ‘Methods’). Briefly, the impact score is a predicted value quantifying the regulatory impact of a given key driver on its downstream effector genes associated with AD pathology. Intuitively, the shorter a path from a key driver to its downstream effectors in a network—with less other parental co-regulators along the same path—the greater the impact of this target on its effectors in that network. The robustness score is reflective of the number of datasets (MAYO and/or ROSMAP), gene sets (seeding and/or expanded), and network models (Bayesian and/or predictive) by which a key driver is replicated. After ranking the total 1563 neuron key drivers according to each score, we focused on the top 50 key drivers in each ranked list (Fig. 4c, d; Supplementary Data 15).
We then performed a series of steps to prioritize a final group of key driver targets for in vitro experimentation out of the ensemble of the top 50 ranked candidates for each score. We first calculated the replication frequency across the two ranked lists and identified 11 replicated targets, indicating robustness across these two independent ranking scores, and 39 unique targets in each ranked list (78 total). For the 11 replicated targets, we removed any which ranked lower than 15 in both scores, resulting in 7 top-ranked targets (ICA1, NSF, FSCN3, HP1BP3, DCAF12, JMJD6, and SLC25A45) which were replicated in both lists and ranked within the top 15 in one or both scores. Next, for the remaining 78 unique targets, we first selected the top 3 unique targets from each ranked list (CIRBP, NUDT2, and FIBP for impact score; YWHAZ, NDRG4, and RHBDD2 for robustness score). To further select targets from the remaining 36 neuron-specific targets in each ranked list (72 total), we identified 4 targets (GABARAPL1, ATP1B1, ATP6V1A, and RAB3A) which were previously nominated to the AMP-AD Agora list based on separate data-driven network analysis using the bulk-tissue RNAseq data in the MAYO and ROSMAP datasets with the same approach as this study142. Finally, to balance our selection strategy, we selected an additional 4 targets (RBM4, RAB9A, FMNL2, and STXBP1) out of the lower-to-middle ranked top 50 unique targets based on the availability of proper constructs.
In summary, we prioritized a group of 19 targets for experimental validation in vitro (Fig. 4c, d, highlighted in red) by selecting the top-ranked replicated targets across the two scores (we note that SLC25A45 and FSCN3 were excluded at this stage due to lack of proper constructs), 6 top-ranked unique targets (top 3 from each score), 4 targets overlapping with prior data-driven nominations to the AMP-AD Agora list, and 4 lower-to-middle ranked targets.
Validation of AD-associated function of neuronal key drivers by knockdown in human neurons
We next aimed to test the functional consequences of perturbation of the top candidate driver genes in human neurons. Healthy control human iPSCs were differentiated to a neuronal fate using a modified version of the well-established NGN2 differentiation protocol71, which rapidly generates induced neurons (iNs) which are most similar to layer 2/3 glutamatergic neurons of the cerebral cortext71,72,143. By 2 weeks in culture, iNs are post-mitotic, electrically active, and express a full array of synaptic markers71,143. In order to perturb the expression of the top 19 candidate key driver genes, we obtained sets of validated short hairpin RNA (shRNA) constructs packaged in lentivirus, with each set containing three constructs against each selected gene. At day 17 of differentiation, iNs were transduced with lentivirus encoding a single shRNA, alongside control cells which either received empty virus or were not transduced. Media were exchanged on all cells 18 h later. Five days following transduction (day 22 of differentiation), conditioned media were collected, and cells were lysed either to collect RNA for RNAseq or to harvest protein for analyses of Aβ and p-tau/tau, similar to our previous study of LOAD genome-wide association study hits144. All Aβ and tau data were normalized to total protein in the cell lysate per well, and all data for each shRNA knockdown were additionally normalized to the average of control conditions (empty vector and no transduction) (Fig. 5a–g; Supplementary Data 16).
Fig. 5: Human iPSC-derived neurons show altered Aβ species and tau/phospho-tau levels following shRNA-mediated knockdown of selected target genes. a–c Secretion of Aβ42 (a), Aβ40 (b), and Aβ38 (c) was measured in conditioned media by ELISA, normalized to the average of controls (no transduction and empty vector) as well as to total protein in the neuronal cell lysate. The ratio of Aβ40:42 was also calculated (d). e, f p231-tau (e) and total tau (f) were measured in cell lysates by ELISA, normalized to the average of controls (no transduction and empty vector) as well as to total protein in the cell lysate. The ratio of p231-tau to total tau was also calculated (g). For all panels, a black dashed line indicates the median for control conditions for that measurement. For each gene knockdown condition, 3 shRNA constructs were used, each shRNA construct was used in duplicate wells, and each dot represents data from one well. For each boxplot, the box contains the middle quartiles of the data and black bar denotes the median value, and the upper and lower quartiles contain the maximum and minimum values and the remaining 50% of the data. Source data is provided in Supplementary Data 16. For each measured parameter, we first performed a Welch’s ANOVA with unequal variance to detect significant differences across conditions, with an additional non-parametric Kruskal-Wallis ANOVA to confirm the significance; p-values are indicated on each panel. We then used a Dunnett’s T3 multiple comparisons test to compare each target shRNA to the control condition for each parameter; *adj-p < 0.05, **0.001 < adj-p < 0.05, ***0.0001 < adj-p < 0.001, ****adj-p < 0.0001. (n = 5–29). h Circus plot summarizing the effects of the 10 key driver targets found to modulate levels of Aβ42, 40, 38, Aβ42:40, tau, p231-tau and/or p231-tau:tau. Significance was assessed by -log10(Dunnett’s T3 adjusted p-value). Red indicates that knockdown of the target significantly increased the given measurement value, whereas blue indicates that knockdown significantly decreased the value. Data frequency distributions and detailed statistical results for this figure are provided in Supplementary Fig. 6 and Supplementary Data 7, respectively. Full size image
Aβ38, 40, and 42 levels were measured in conditioned media from the transduced and control iNs using the Meso Scale Discovery Triplex ELISA platform. Of the 19 genes tested, knockdown of 11 genes had no significant effect on the levels of any Aβ peptides measured nor the ratio of Aβ42 to Aβ40 (Fig. 5a–d). However, targeted knockdown of YWHAZ significantly raised Aβ42 peptide levels, knockdown of DCAF12 and YWHAZ increased Aβ38 levels, and knockdown of NSF and NUDT2 significantly increased levels of all three Aβ peptides measured (Aβ38, 40, and 42) (Fig. 5a–c). On the other hand, knockdown of RBM4 significantly reduced levels of both Aβ42 and Aβ40 (Fig. 5a, b). Lastly, knockdown of NDRG4, STXBP1, YWHAZ, and JMJD6 resulted in a significant elevation of the putatively neurotoxic Aβ42 to 40 ratio145,146(Fig. 5d).
We also examined levels of tau species in the transduced and control iN lysates using a Meso Scale Discovery ELISA measuring both total tau and phospho-tau (Thr231). Knockdown of 16 of the 19 candidate genes tested had no significant effect on the levels of tau, p231-tau, or the neurotoxic ratio of p231-tau to tau (Fig. 5e–g). However, targeted knockdown of JMJD6 significantly decreased the levels of both p231-tau and tau (Fig. 5e, f). We also note that knockdown of NSF approached significance of increased levels of p231-tau (Fig. 5e; Dunnett’s T3 adjusted p-value = 0.075). Finally, knockdown of FIBP and JMJD6 resulted in significant elevation of the p231-tau to tau ratio, while knockdown of ATP1B1 significantly lowered this ratio (Fig. 5g).
Thus, we confirm modulation of AD endophenotypes in human iNs following independent reduction of the expression of 10 different genes out of the top 19 predicted key driver targets (Fig. 5h). Data frequency distributions and detailed statistical results of Aβ and tau measurements are included in Supplementary Fig. 6 and Supplementary Data 7. We additionally analyzed the overlap of these 10 targets with our DE and cis-eQTL analyses in MAYO and ROSMAP (Supplementary Data 8 and 9, respectively). As not all of the targets are significant DE or cis-eQTL genes, we conclude that our network analysis adds a critical value to the identification and prioritization of targets which cannot be achieved by DE and eQTL analyses alone.
Validation of AD-associated networks and pathways by RNAseq of human neurons following targeted gene knockdown
To validate the network structure, we repeated shRNA-mediated knockdown of each of the 19 target key drivers in another set of cultured control iNs and subsequently measured gene expression by RNAseq. For each of the 10 AD endophenotype-modulating targets, we derived a DE signature from the RNAseq data (Fig. 6a–j, Supplementary Data 10). Next, we extracted the downstream (sub)network of each of those 10 targets from the MAYO- and ROSMAP-neuron networks and evaluated the enrichment of the knockdown DE signature by the downstream subnetworks for each target. We found that 8 out of the 10 DE signatures were enriched by the downstream subnetworks of their corresponding target (Fig. 6k), validating that our network models capture a large portion of molecular processes and pathways at the neuron level.
Fig. 6: Gene expression changes following knockdown of the 10 validated targets in human iPSC-derived neurons. a–j RNAseq analysis showing significantly up- and down-regulated DE genes after shRNA-mediated knockdown of each of the 10 validated targets. Significance was assessed using the two-stage linear step-up procedure of Benjamini, Krieger, and Yekutieli with q-value < 0.05, indicated by the black dashed line. Red gene symbols indicate any of the prioritized 19 target genes that were significantly affected. k Network validation by enrichment analysis of significant DE genes following shRNA knockdown of the 10 validated targets in the 11 subnetwork networks. We compared the DE genes after knockdown of each target to the individual downstream subnetwork of that target extracted from the 11 reconstructed networks. Significance was assessed by Fisher’s exact test with p < 0.05. l Significant overlap in DE genes resulting from knockdown of each of the 10 validated targets in human iPSC-derived neurons. Significance was assessed by Kruskal-Wallis ANOVA with Dunnett’s T3 multiple comparisons test with FDR < 0.05. Detailed results are summarized in Supplementary Data 10. Full size image
We then further examined the gene expression changes resulting from knockdown of the 10 validated targets. Following JMJD6 knockdown, which significantly altered ratios of both Aβ and tau in iNs, 656 genes were significantly upregulated and 419 genes significantly downregulated (Fig. 6a). Interestingly, among those significantly upregulated genes were 3 of our other 19 key driver candidates (NDRG4, ATP6V1A, and NSF), indicating that their expression is affected by the reduction of JMJD6 in neurons. Volcano plots in Fig. 6b–j highlight additional key driver candidates whose expression was affected by knockdown of each of the 9 other validated targets. Moreover, we found certain common genes affected by the perturbation of multiple validated targets: 6 genes (FGF11, GIT2, KLHL28, PLCB3, SEPSECS, and SLC48A1) were affected by knockdown of NDRG4, STXBP1, YWHAZ, and JMJD6, and 9 genes (SEPTIN3, ABR, AOC2, CTFIP2, ZGTF2H1, MRPL17, NIIPSNAP1, RIMS4, and TMEM246) were affected by perturbation of DCAF12, NSF, and NUDT2. This observation indicates that there may be unique and common molecular pathways among these validated AD endophenotype-modulating targets; we illustrate the significant overlap of DE genes after each target knockdown in Fig. 6l.
To investigate possible mechanisms underlying these observations, we extracted regulatory pathways among the 10 validated targets in each of the 11 MAYO- and ROSMAP-neuron networks. We found that these 10 targets tightly regulate each other, and, interestingly, are all upstream regulators of the prominent proteins REST and VGF (Fig. 7a, b). REST (restrictive element 1-silencing transcription factor) is a known master regulator of neurogenesis via epigenetic mechanisms, apoptosis, and oxidative stress;147,148 VGF (nerve growth factor inducible) is a recently identified AD target whose overexpression in a mouse model reversed AD phenotypes68. In particular, our networks identified FIBP as a direct upstream regulator of VGF. Our findings thus indicate that these 10 targets may modulate AD-related pathology partially through REST and VGF pathways.
Fig. 7: Regulatory pathway analysis reveals unique and shared biological pathways between the validated targets in each network. a The downstream members of each validated target were extracted from every network model, and edges from each downstream sub-network were pooled together into a consensus subnetwork of the 10 validated targets (yellow nodes). The 10 targets tightly regulate each other and are upstream regulators of both REST and VGF (green nodes). Blue, red, and purple edges, respectively, indicate the shortest paths from any of the 10 validated targets to REST, VGF, or both. Edge thickness indicates the frequency of corresponding edges appearing across all the networks. b The shortest paths from each of the 10 targets to REST and VGF were extracted from each network and pooled together into a hierarchical structure. The coloring of each target node annotates its representative ConsensusPathDB pathways enriched by significant DE genes in the shRNA knockdown experiments. c The overall ConsensusPathDB pathways significantly enriched by each of the 10 target genes (assessed by Fisher’s exact test with p-value < 0.05) were pooled and ranked in descending order by the frequency of enrichment by any of the targets. Detailed statistical results and descriptions of all pathways affected by these targets are provided in Supplementary Data 11. Full size image
Finally, we performed pathway enrichment analysis (see ‘Methods’) on the DE signatures derived from the RNAseq data in order to identify the unique and shared pathways affected by the knockdown of the 10 AD endophenotype-modulating targets (JMJD6, NSF, NUDT2, DCAF12, RBM4, YWHAZ, NDRG4, STXBP1, FIBP and ATP1B1). We compared significant pathways enriched by the DE signature of each of the targets and found that 1 pathway is shared by 9/10 targets, 4 pathways are shared by 8/10 targets, 2 pathways are shared by 7/10 targets, 18 pathways are shared by 6/10 targets, and 40 pathways are shared by 5/10 targets (Fig. 7c). Comprehensive descriptions of all pathways affected by these targets are included in Supplementary Data 11. Moreover, we found an interesting association between JMJD6 (as well as NUDT2 and NDRG4 among the 10 validated targets) and allele dosage. These 3 key driver genes are significantly associated with SNPs in their promoter regions (cis-eQTLs) in the MAYO and ROSMAP cohorts, further indicating that these genes may be actionable targets for AD therapeutic development.