Circulation patterns and associated surface anomalies
While upper tropospheric wave patterns are well reproduced in the bias-adjusted CMIP6 multi-model mean, associated multi-model mean temperature (Fig. 1) and precipitation anomalies (Fig. S3, Table S1) are largely underestimated. To determine these composite maps wave events and anomaly fields are calculated for each model separately following the methodology of Kornhuber et al.19 (see methods: wave events) before averaging.
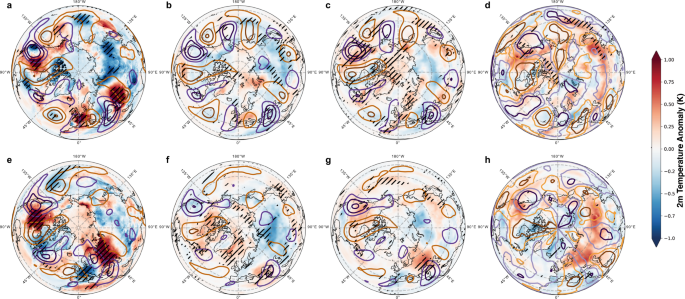
Fig. 1: Circumglobal wave-7 and 5 patterns and associated 2 m air temperature anomalies in ERA-5 reanalysis data and bias-adjusted CMIP6 models. Meridional winds in m/s (contours; purple: southerly, orange: northerly winds, in (a–c, e–g) contours start at an absolute value of 3 m/s and increase/decrease by 3 respectively, in (d, h) contours start an absolute value of 0.5 and increase/decrease by steps of one) and near surface temperature anomalies filled contours during (a–c) wave-7 and (e–g) wave- 5 events relative to the respective climatology in the northern hemisphere summer (JJA) based on (a, e) ERA5 reanalysis (1960–2014), (b, f) historical (1960–2014) and (c, g) future (SSP5-8.5, 2045–2099) bias-adjusted output from CMIP6 simulations (four models). d, h) Difference in meridional winds and temperature response during wave events comparing historical and future patterns in four bias-adjusted CMIP6 models (for twelve non adjusted models see Fig. S6). Hatching shows statistical significance on a 95% confidence level (a, d, e, h) or 100% model agreement in sign (4 out of 4 models, b, c, f, g) While the phase positions and intensity of the wave patterns (line contour) are well represented in the models their surface imprint are considerably underestimated in historical simulations. Changes in the temperature response are identified over North America, Eurasia and East Asia (d, h). Full size image
To quantify model agreement with reanalysis-data, we calculate the Pearson correlation r and coefficient of determination R2 of model-based composite fields (Fig.1 b, c, f, g) with those based on ERA-5 (Fig.1a, b) over the mid-latitudinal belt (38°−58°N). Note that R2 is calculated between the values of the two respective fields and not between values and a fit as is usually done. We find high values for meridional winds (\({{cor}}_{v,{hist}}^{w7}=0.89,\,{R}^{2}=0.89\); \({{cor}}_{v,{ssp}585}^{w7}=0.92,\,{R}^{2}=0.92;{{cor}}_{v,{hist}}^{w5}\) = 0.82, \({R}^{2}=0.76\); \({{cor}}_{v,{ssp}585}^{w5}\) = 0.84, \({R}^{2}=0.8\)), but low values for temperature anomalies in the multi-model mean (\({{cor}}_{t2m,{hist}}^{w7}=0.35,\,{R}^{2}=0.14\); \({{cor}}_{t2m,{ssp}585}^{w7}=0.38,\,{R}^{2}=0.15;{{cor}}_{t2m,{hist}}^{w5}=\)0.03, \({R}^{2}=0.02\); \({{cor}}_{t2m,{ssp}585}^{w5}=0.51,\,{R}^{2}=0.28\)) and even lower values for precipitation anomalies (Table S1, Fig. S3). Luo et al.31 found similar results for three models partly based on CMIP5 experiments, suggesting that models might have not considerably improved in the newer CMIP6 experiments. Notably, bias-adjusted model outputs do not exhibit considerably improved spatial correlation values and anomaly fields compared to the original CMIP6 simulations (Table S2, Figs. S4, S5), possibly because bias adjustment optimizes fields for different subsamples rather than high amplitude wave events.
Circulation related changes in temperature during wave events comparing historical and future experiments for four bias-adjusted models are shown in Fig. 1, d, h. Future extreme warming simulations do not project an increase in mean wave amplitudes (Fig. S1), which have a tendency to be underestimated in historical experiments (Fig. 1). This is in line with no detectable trend in wave events over the historical time-period (Fig. S9).
However, ridges over certain regions do amplify in the future projections and contribute to larger positive temperature anomalies in the four bias-adjusted models (Fig. 1d, h, see Fig. S6 for anomalies based on all CMIP6 models). For wave-7, temperature anomalies increase significantly over Western North America (NA) and over East Asia (EAS), while for wave-5 significant increases are detected for Western NA and most of Eurasia. The correlations with observed temperature anomalies are higher for future compared to historical simulations in part due to increased temperature anomalies beyond mean warming alone.
Concerning crop producing regions, the majority of the climate models analyzed here underestimate temperature and precipitation anomalies during wave events (Fig. 2). Underestimation of surface anomalies in models during wave events may translate into particular underestimated risk to crop productivity in key breadbasket regions. To assess this, we calculate the spatially averaged surface response in temperature and precipitation in important NH mid-latitude crop regions (Fig. 2a, see methods) during wave-7 and wave-5 events (Fig. 2b–k). We compare two different reanalysis datasets (ERA5, 1960–2014; W5E5, 1979–2014) to the bias-adjusted output from four CMIP6 models and their multi-model mean under historic and future simulations.
Fig. 2: Mean response in precipitation and 2 m temperature anomalies over major crop-producing regions during wave events in reanalysis data and CMIP6 climate models. a Major crop producing regions in the Northern Hemisphere mid-latitudes defined by a threshold of 25% harvested area per grid-point. Weekly mean temperature and aggregated precipitation anomalies averaged over the regions outlined in (a) for (b–f) wave-7 and (g–k) for wave-5. We compare two different reanalysis datasets ERA-5 (dark red,1960–2014) and W5E5 (red, 1979–2014) with bias-adjusted output from four CMIP6 models under historical (green, 1960–2014) and future (2045–2099, SSP5-8.5, yellow) conditions, whereas their mean values are shown as dashed lines. Note the different y-axis range for (k) and (f) compared to the other panels. Temperature anomalies are dominantly underestimated in the bias-adjusted output in WEU (wave-7, wave-5), EEU and NA (wave-5). Precipitation anomalies are underestimated in NA, WEU (wave-7). Full size image
Strongest discrepancies between surface anomalies in reanalysis and models are found where the crop-producing regions spatially align with a wave-induced temperature anomaly, such as WEU for wave-7 and NA, WEU, and EEU for wave-5. For reanalysis, we find that NA shows above average temperatures during wave-5 events, and dry anomalies during wave-7 events. Strongest bivariate differences between wave patterns occur over western European (WEU) croplands which are wetter and colder during wave-5 events and hotter and drier during wave-7 events. Eastern Europe (EEU) exhibits warmer than average temperatures during wave-5 events and wetter than average conditions during wave-7 events. India (IND) and Eastern Asia (EAS) are drier than average during wave-7. Here, the reanalysis products covering the recent years (W5E5, both 1979-2014) exhibit wetter and drier conditions respectively, whereas ERA5 shows precipitation anomalies of opposite sign to the other reanalyses. The bias-adjusted model output does not exhibit a notable improvement relative to the other CMIP6 models over the historical period (Fig. 2, Fig. S7). Projected relative anomalies however do move towards the observed values in some regions, e.g. temperature anomalies for wave-5 in EEU and precipitation in IND for both waves (Fig. 2, Fig. S5), which aligns with the increased pattern correlation of future temperature anomaly fields identified earlier (Table S1).
Observed and simulated regional yield losses
The occurrence of multiple wave events in summer negatively affects combined maize and wheat yield at the regional and global level in observational yield statistics (FAOSTAT33), but these impacts are not accurately reproduced by the crop-model experiments in most regions, especially when driven by bias-adjusted climate models (Fig. 3). We show this by comparing estimates of the waves’ composite impact on combined wheat and maize yield in observations (ERA5 x FAO-data: Obs/Obs), a crop model driven by a reanalysis product (W5E5 x LPJmL: Obs./Model) and the mean crop-model response from four climate models (bias-adjusted CMIP6 x LPJmL; Model/Model) under historical (Fig. 3a, c) and future conditions (Fig. 3b, d, see methods for further details).
Fig. 3: Combined Wheat and Maize yield anomalies during wave event years in observations and models. Composite yield anomalies based on wave events from ERA-5 reanalysis and annual reported national yield statistics from FAO (Obs/Obs), wave events from ERA-5 reanalysis and yield anomalies from a crop model (LPJmL) driven by reanalysis data (W5E5, Obs/Model) and crop model (LPJmL) driven by four bias-adjusted CMIP6 simulations (Model/Model) for (a) wave-7 and (c) wave-5 over the historical time period (1960–2014). Composites compare years in which two or more wave events are detected in JJA (red to purple bars) with the control case of years without such events (gray, light yellow bars). Bars and whiskers depict the distribution of 500 resampled replicate composite yield effects, where each replicated preserves the sample size of the underlying observations (wave events). Differences in detected wave events across datasets cause the difference in distribution variance. Differences in modelled crop impacts (both Obs/Model and Model/Model) are large compared to observations, but are smaller in some regions when driving the crop model with bias-adjusted reanalysis weather data (Obs/Model) instead of GCM simulations (Model/Model). (b, d) as in (a, b) but showing crop yield anomalies simulated by LPJmL based on historical (1960–2014) and future (SSP5-8.5, 2045–2099) simulations. Full size image
We find that years with more than one wave event are associated with regional crop yield anomalies of up to −7% in EAS for, −6% to in NA and −3% in EEU for wave-7 with an average response across the selected regions of −2% to −3%. For wave-5 we observe values of −1% to −3% for respectively with highest regional anomalies observed in EEU (−3.7%) and NA (−2%) (Fig. 3a, c Obs/Obs). These results are in agreement with Kornhuber et al. 202019, whose analysis relied on NCEP.NCAR reanalysis over a shorter period (1979–2018) and different crop data. Averaged across all regions, the response for wave-7 in CMIP6-driven experiments is essentially zero, which represents an underestimation of 3% globally relative to observations. While the yield anomalies averaged across all regions are in good agreement for wave-5, regional anomalies in models deviate from observed values: a 3% overestimation in NA compensates for the underestimation in all other regions. Historic crop simulations underestimate the response in EAS by 9% and by 3% in EEU (Fig. 3c).
In some regions, disagreements between purely observation and model-based assessments are substantially reduced when the crop model is driven with bias-adjusted ERA5 reanalysis data (W5E5, Fig. 1a Obs/Model). While disagreements with observed values remain over EAS and WEU, yield anomalies in NA, EEU and IND are found to be well within the error-margins of the observed impact. This provides evidence that surface anomaly biases in CMIP6 models are to a large degree responsible for ensuing crop model disagreement with observations in some regions. However, we note that this reduction in disagreement for the reanalysis-model hybrid is not consistent for all regions, suggesting regional variation in the accuracy of the crop model response to wave events.
Although linked climate and crop model simulations tend to underestimate observed crop impacts, a comparison of historical and projected future impacts might be still instructive given the large societal risks associated with even a small percentage change in yield. Future impacts on crop yield increase for wave-7 globally (Fig. 3b, d), and averaged over all regions, driven mainly by increased negative impacts in NA where yield is reduced by 6% compared to historical simulations, in agreement with the projected amplified heat response in that region in bias-adjusted model experiments (Fig. 1d, Fig. 2b). Meanwhile, wave-5 projected impacts dampen at aggregated geographic scales, primarily driven by much-reduced impact over NA that is only slightly offset by an increased impact over EEU. This increase over EEU is in agreement with the amplified temperature response observed in the multi-model mean for that region (Figs. 1h, 2i). We note that since the temperature and yield anomalies are normalized to respective time periods, these comparisons isolate the influence of wave patterns relative to contemporaneous climate, masking large mean warming and yield changes32 along with their own attendant uncertainties. Given the large biases in regional crop response to wave events, these results have to be considered with caution.
When quantifying the crop response to extreme weather events, their timing relative to the sowing and harvesting calendars is crucial34,35. For instance, the lack of wave event impact for wave events on WEU crop yield in observations might be related to dominance of winter wheat in this region, with a growing season extending far outside of JJA. Furthermore, we find that the timing of wave events within JJA differs between observations and CMIP6 (Fig. S8) presenting an additional potential explanation (beyond surface anomalies) for yield discrepancies between observations and CMIP6 models. While wave-5 events are evenly distributed over the summer season with a slight preference for the later weeks in ERA-5, these events skew towards the beginning of the season in the models, a tendency that is reinforced under a high emission scenario (Fig. S8). While wave-7 events predominantly occur in June and early July in ERA-5, CMIP6 models suggest a more evenly distributed occurrence of wave-7 events that reach into August.
Observed and simulated concurrent yield losses
The occurrence of one or more wave event in summer elevates the likelihood of poor harvests in pairs of two important crop producing regions in observations (Fig. 4a, e). To quantify the effect of wave events on concurrent poor yields we introduce the likelihood multiplication factor (LMF) in analogue to e.g. Zscheischler & Seneviratne36 (see Eq. (3) in Methods). The LMF is larger than one for a pair of two regions when wave events amplify the likelihood of concurrent low yields and lower than one when wave events have a lessening effect. Here we define a poor yield year as a year in which the combined wheat and maize yields are below the multiyear trend. In analogue we test the effect on concurrent yields above the long-term trends to test a potential beneficial effect on yield in two regions.
Fig. 4: Likelihood multiplication factors (LMF) of concurrent yield losses in observations and models. LMF of concurrent negative yield anomalies of combined wheat and maize yield in two regions for wave-7 (a–d) and wave-5 events pear year (e–h) (upper right corner). LMF for concurrent positive yield anomalies are provided in the lower left corner of each heatmap. a, e Values based on ERA-5 and FAO data (1960–2014, Obs./Obs.). b, f Values based on wave events from ERA-5 and yield anomalies from LPJmL driven by W5E5 (Obs/Model.). LMF values for concurrent low and high yields differ significantly for (a, b, e, f) (Figs. S12–S15). Averaged LMF values based on LPJmL driven by four bias-adjusted CMIP6 models separately are shown for (c, g) historical experiments (1960–2014) and (d, h) future projections (2045–2099, SSP5-8.5). Model agreement is provided by dots where one dot indicates an agreement (above or below a LMF value of one) among three out of four models while two dots indicate an agreement among all four models. Full size image
Results investigating concurrent negative anomalies are shown in upper right tiles of heatmaps in Fig. 4, while results on concurrent positive anomalies are presented in lower left tiles. In experiments based on observations (Obs./Obs., Fig. 4a, e) wave events increase the likelihood of concurrent negative yield anomalies in particular in pairings that include NA while they mostly decrease the likelihood of concurrent positive yield years overall. Both aspects are well represented in experiments based on LPJmL driven by reanalysis data (Fig. 4b, f), however values are higher for parings that include NA and EAS for wave-7. Further discrepancies between observation-based and modelled yields are found for pairings with WEU and EAS exhibiting overestimated LMF values for wave-7, while being mostly underestimated for wave-5. We find that LMF values for concurrent low yields and high yields differ statistically significant for both experiments (Obs./Obs., Obs./Model) and both waves throughout regions (Figs. S12–S15). Historical CMIP-6 models (Fig. 4c, g) exhibit a good agreement with observations, in particular for wave-5 where three out of four models agree in sign for most of the regions that have been identified as teleconnected. For wave-7 model agreement is strongest for the link between for NA x EEU, while the co-occurrence of positive yield anomalies is overestimated in some regions. This tendency increases for wave-7 in future projections, where concurrent positive yields dominate (Fig. 4d). The only pairings that see an increase in multi-model mean LMF for co-occurring negative yield anomalies are NA x EAS for wave-7 and NA x EEU and IND x WEU for wave-5. Notably, for future projections the four models exhibit poor agreement with respect to changes in low yield concurrence (compare Figs. S10, S11). While for wave-5 LMF values increase for MPI-ESM1-2-HR, values decrease in all regions besides NA for UKESM1-0-LL. Such disagreement in simulated concurrent yield loss across varying climate model inputs complicates drawing clear conclusions on on how LMF values will change in the future.