In this study, we utilized data from a single brand of wearable devices to assess sleep patterns in a large-scale sample of 30,082 individuals across 11 countries. These findings are discussed further below.
Data from wearables concur with previously known sleep patterns but reveal substantially delayed bedtimes and shorter sleep duration
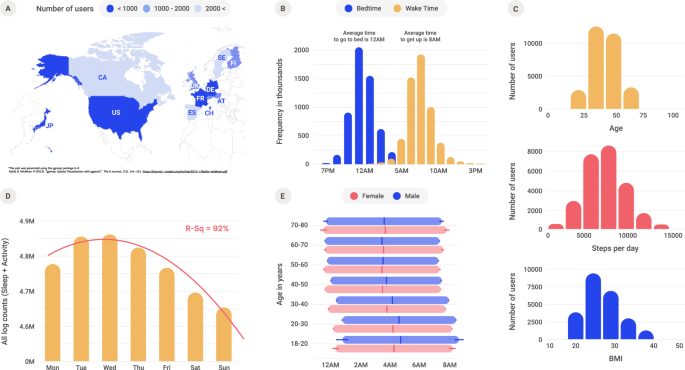
While our data confirmed previously studied relationships between bedtime, wake time, and sleep duration (Fig. 2A), the scale and international nature of the data also revealed new insights into sleep patterns. Sleep duration measured using wearable data is more strongly determined by bedtime than wake time, suggesting the influence of social obligations at night time, as seen in survey-based data in previous studies5. Multiple epidemiological and cohort studies have shown that increasing age, in general, is associated with shorter sleep duration and earlier wake times16. A reduction in total sleep duration of 0.5 min per year of age increase was seen in the large multicenter community Sleep Heart Health research (n = 2113)17. Another study revealed that a short sleep duration prevails in teenagers and those aged > 65 years7. Our data also show that age has a nonlinear relationship with sleep timing and duration (Fig. S1). The consistency of findings relative to other methodologies indicates that wearable data serve as a valuable comparative tool for sleep studies, as first demonstrated in11. Moreover, the wearable data also provide objective, quantitative data measurements.
Indeed, the wearable data indicated several visible differences in sleep patterns compared to studies based on self-reporting. For example, previous research found that women sleep more than men and generally have earlier bedtimes and later wake times until the age of 605,6. Meanwhile, our data shows the same patterns for bedtimes, but not for wake times, in female and male cohorts (Fig. 1E). Previous wearable studies also showed that women tend to self-report shorter and less efficient sleep in surveys compared to actigraphy measurements6. Our wearable data also reported later bedtimes and wake times compared to survey-based studies in all countries that were examined using both approaches (see Fig. 4). The highest quantity of sleep among the 11 countries, according to wearable data, was found in Finland, where the median daily sleep time was 8 h. The reported sleep time in all other nations was 16–69 min shorter than it was in Finland (Table S1). Data from Japan showed the lowest median sleep duration, 6 h and 51 min, and the biggest difference between wearable-recorded and self-reported sleep measurements.
Figure 4 Wearable vs. survey-based studies. A comparison of average bedtime, wake time, and sleep duration based on data results obtained from six different sources across 15 countries4,5,12,18,19. Full size image
Focusing on country-specific variations in Fig. 2B, we identified that three sleep measures substantially correlate with log-GDP for the studied countries, a relationship that has not been extensively examined in previous studies. Specifically, bedtime was found to be delayed in higher-income countries, yet wake time was affected to a lesser degree. Higher-income countries also showed shorter average sleep durations. The relationship between GDP and sleep measures observed in our study could be driven by various mechanisms. One possibility is that higher-income countries may have more demanding work schedules or longer working hours, leading to delayed bedtimes and shorter sleep durations20. Another potential factor is that higher-income countries may have greater access to technology and entertainment, resulting in later bedtimes and reduced sleep durations due to increased exposure to screens and devices21.
According to the analysis, a handful of important social factors such as GDP, Individualism, and Uncertainty Avoidance are able to account for 63% of the differences in sleep quantity and 55% of the differences in sleep quality across different locations (refer to Table 1). This finding suggests that the amount and quality of sleep may be linked to the specific societal and cultural characteristics of the region where individuals reside. For example, considering the baseline models, living in higher GDP regions was associated with shorter sleep duration (p < 0.01) and lower sleep efficiency (p < 0.01). In contrast, considering the final StepAIC model, countries with higher individualism Index (IDV), which indicates the degree to which a culture reinforces individual achievement and relationships, had longer sleep duration (p < 0:01), which may be explained by an earlier bedtime schedule in such societies. Countries with high collectivism scores, i.e., low IDV values, may have stronger social obligations at night, potentially leading to shorter sleep duration. For instance, the cultural emphasis on social harmony and group obligations in collectivistic cultures may create stronger expectations for social engagement or activities at night, which can in turn impact individuals' sleep behaviors. Individuals who work long hours or have rigid work schedules that extend into the evening may also have fewer opportunities for restful sleep. Spain and Japan were the two countries in the studied data that had the highest collectivism scores and the most delayed bedtime schedules (refer to Fig. S2 in Supplementary Material). In contrast, wake times were less divergent across the studied countries. Both high individualism (IDV) index and high uncertainty avoidance (UAI) index, which capture how regulated life is, were also associated with better sleep quality, but to a moderate degree (p < 0:1).
Previous survey-based studies have shown that bedtimes and wake times are strongly dependent on demographics such as age and gender. We confirmed the same correlations in Fig. S1. In addition, we newly explored whether these trends can be modified by individually configurable factors. One study conducted a sleep intervention experiment in a poor urban area and showed that half-hour naps at the workplace can induce high-quality sleep and therefore increase work productivity by an average of 2.3% throughout the day22. Our analysis of individual factors also highlights, within societal boundaries, that increasing daily steps can further affect sleep (see Fig. 3). People who exercised had better sleep quality, and their total sleep duration was shorter than that of less active individuals. The effect of exercising and increased daily activity was more pronounced in some countries (e.g., the U.S., Finland) than in other countries (e.g., Austria). We also found that Japan was an exceptional case where additional daily steps did not lead to increased sleep quality. These findings suggest that the relationship between daily activity and sleep may be country-specific, and different exercise regimes may be more effective for some cultures than others. Further research could explore this possibility in more depth.
Theoretical implications
Our findings have three theoretical implications. First, we provide evidence that societal influences should be considered in modeling sleep. Previous literature showed physiological and environmental effects on sleep and suggested that individuals have unique internal time signatures23. Along with recent literature that discusses social influences2,5,6, our work offers strong evidence, supported with extensive data, that social constructs can explain the majority of variations in sleep patterns (Table 1).
The second theoretical implication is that our results bring clarity and structure to the numerous sleep metrics available in the literature24,25,26,27. Upon analyzing seven metrics, we found that sleep patterns can largely be summarized using two orthogonal dimensions (83.14% of the explained variability): Principal Component Analysis (PCA), based on our data, shows that sleep metrics can be classified into those reflecting quantity (i.e., sleep duration, sleep history, and MSFsc), and those reflecting quality (i.e., sleep efficiency, the K-hour deviation). These metrics were chosen based on their widespread use in sleep research and their relevance to capturing important aspects of sleep patterns.
The third theoretical implication comes from the limitations of existing surveys on sleep. Many studies have captured intended or desirable sleep behaviors, but very few have examined sleep in relation to participants' other life signals. This limitation can be rectified by ensuring that surveys contain questions that give insight into activities related to well-being28,29. Surveys can include questions about expected work shift timing, the number of holidays, access to electronic devices in the bedroom, and cultural expectations about sleep. Our results suggest a tradeoff between one’s social life and sleep patterns. Societies that sacrifice a bit of sleep tend to show markers of better social life; they focus on the collective experience (Collectivism, i.e., smaller log-IDV values) by enjoying the moment and spontaneous lives (i.e., smaller Uncertainty Avoidance Index values). We also saw a poorer sleep tendency, both in terms of quantity and quality, in cities with higher GDP (i.e., larger social scales).
Practical implications
Our findings also have two practical implications. The first concerns multinational organizations. Based on our findings, international organizations may want to vary non-work activities and tailor them to local societal norms. For example, some societies emphasize individual work over sleep. This tendency could be counterbalanced by generous after-work activities that support productivity and, ultimately, well-being.
The second practical implication concerns sleep-tracking apps. These apps should consider not only “who the user is” (i.e., individual characteristics, including exercise, diet, nutrition, and quality of life) but also “where (s)he lives” (i.e., social influences and scales). For instance, there is a strong correlation between economic indicators like GDP and the quantity of artificial light present at night30. Since excessive exposure to artificial light may impact sleep and health, app designers may want to take these local factors into account in future iterations of their sleep devices31. By implementing this information, an app could recommend optimal sleep patterns for users that, for example, do not compromise an individual’s social life.
Limitations and future work
This work comes with several limitations. One is measurement accuracy in sensing sleep. Although wearable devices are advancing and are widely used, the gold standard for measuring activity signals consists of less ubiquitous actigraph sensors or polysomnography32. Such direct measurement methods can detect variant sleep patterns. Other less invasive methods, like survey-based research, suffer from reporting biases. In fact, our data show a consistent deviation between sleep data obtained from surveys and wearable devices. Figure 4 shows average sleep schedules obtained from six different sources across 15 countries (see Table S3 for more detailed statistics), where bars indicate time frames when individuals went to bed and woke up on average. In the surveys, users reported going to bed earlier at night and waking up earlier in the morning compared to users in wearable-based studies across multiple data sources. To increase accuracy, researchers can make existing wearables ‘smarter’ with on-device machine learning33 or make existing high-precision devices less invasive by miniaturizing them34. Furthermore, deep-learning algorithms could be used to fill in missing data points and prune possible outliers24.
Another limitation concerns the control variables and generalizability. While our study controlled for two common factors directly related to sleep (i.e., overall socioeconomic status of a city and median age), future studies could control for additional variables (e.g., gender or income) whenever available. Previous research emphasized the potential for interaction between, as well as the mutual influence of, genetics and culture35. As noted by Ong et al.12 it is also plausible that genetic variation accounts for cultural disparities in the sleep habits of users. For example, it has been hypothesized that East Asians may have genetic variations that give them resilience to sleep deprivation36. By examining how genetic information affects these disparities, future research may reveal the mechanisms underlying differences in sleep patterns across ethnic groups.
Also, our findings are limited to countries with relatively higher GDP values (i.e., at least $252 billion or within the top 42 countries as of 2023) and may not be generalizable to more socio-economically deprived countries. Furthermore, tech-savvy individuals will tend to wear high-end tracking devices, leading to potential population bias in wearable-based studies. Despite this potential homogeneity in our sample, there were still stark differences in sleep quality that were explained by social constructs.
Ethical considerations
This study adhered to the General Data Protection Regulation (GDPR) in terms of data collection, processing, and storage. The authors had no access to personally identifiable information of individuals in the studied dataset. All data were analyzed at the aggregate level (i.e., cities, countries, and groups by sleep patterns).