This study complies with all relevant ethical regulations for research with human subjects and obtained ethical approval from the Norwegian Regional Committees for Medical Research Ethics (reference no.: 25462; project name: Young in Norway). The study is based on survey data from the Young in Norway Study65,66 collected at five timepoints: in 1992 (T1), 1994 (T2), 1999 (T3), 2005 (T4), and 2020 (T5). All items of the multi-item measures used here are reported in Supplementary Table 1.
Participants and procedure
At T1 (1992), a national sample of Norwegian junior and senior high school students, from 67 schools in grades 7–12 (age 12–20), was selected from stratified areas. Since the study did not include any experimental manipulations, no further randomization was applied. Each grade was equally represented, and cluster-sampling was applied with the school as the unit. See67 for more information about the sampling procedures.
Data68 were collected in the participating schools and the initial sample consisted of 11,985 participants, equally distributed according to gender and age. No statistical method was used to predetermine sample size. Written informed consent was obtained from participants or their parents whenever the participants were below the age of 15 at T1. Participants were followed up with questionnaires at school at T2 (1994), and a subset was then approached by postal means (using pen and pencil questionnaires) and digital means (using the Nettskjema online data collection tool) at the remaining time points: T3 (1999; N = 2924), T4 (2005; N = 2890), and T5 (2020; N = 2215). They were asked to renew their informed consent at T2 and at T4 in line with ethical stipulations.
Because the outcome measure of interest (i.e., conspiracy mentality) was included at T5, only data from participants who had completed this wave were used in the current study. Otherwise, no data were excluded from the analyses. In this sample, 57.4% of participants were women, and 42.6% were men. Most participants (93.6%) were ethnic Norwegians; 6.4% of participants had some immigrant background (i.e., were born abroad or had at least one parent who was born abroad). Less than half of participants (43.3%) had at least one parent who attended college or university.
Analyses
Descriptives and correlations
Descriptive statistics and correlations between study variables are presented in Supplementary Table 2.
Measurement invariance
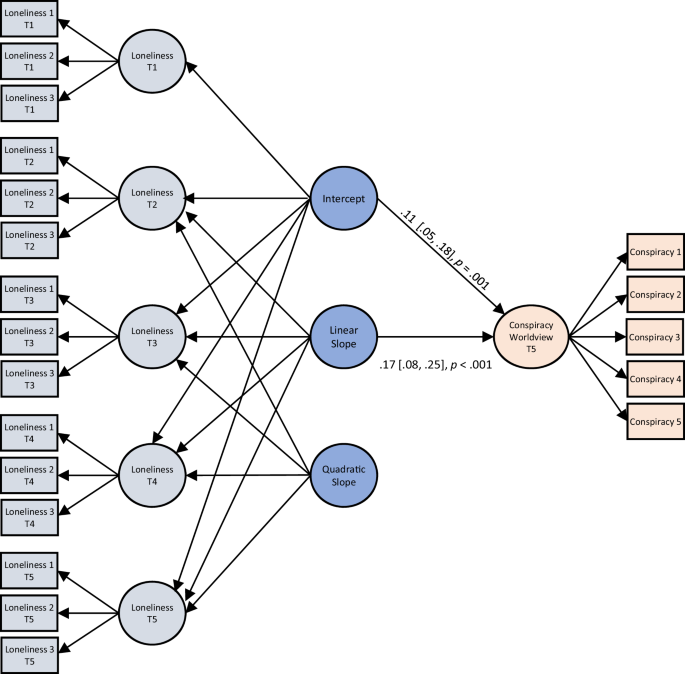
All analyses were conducted in Mplus v.869 and used two-tailed significance tests. Since latent growth curve models assume that modeled constructs are psychometrically equivalent across time, we first tested for longitudinal measurement invariance of the loneliness measure to assess whether this assumption was met. We report the results in Supplementary Table 3. We fitted a measurement model including all observed indicators of the latent construct of loneliness (i.e., the five items of the Norwegian short version of the UCLA loneliness scale37) at each timepoint (configural invariance model). We then constrained factor loadings to equality across timepoints (weak invariance model), and then loadings and intercepts of the items (strong invariance model). This analysis revealed that two out of the five initially used items (i.e., the reversed items, for which higher scores were thought to indicate less loneliness: “I feel in tune with the people around me”, “I can find companionship when I want it”) yielded low loadings on the latent loneliness construct (0.29 ≤ β ≤ 0.54) and were not invariant across time, resulting in poor fit of the strong invariance model, χ2(251) = 2520.63, p < .001, CFI = 0.880, TLI = 0.856, SRMR = 0.067, RMSEA = 0.064, p close < 0.001, 90% CI RMSEA = [0.062, 0.066]. Because latent growth modeling requires strong longitudinal invariance of the modeled construct70, we removed these two reversed items, achieving excellent fit with the data for both weak invariance and strong invariance models. We therefore retained the strong invariance model based on the resulting three-item loneliness measure. Thus, in all remaining analyses, factor loadings and intercepts were constrained to equality across the five time points. Moreover, all models included correlations between residuals of the same items of loneliness measured at different timepoints.
Latent growth curve analyses
We fitted a series of second-order latent growth curve models, that is, models consisting of both the strong invariance measurement model and a latent growth curve model71,72. Supplementary Table 4 presents the detailed results of these analyses. To account for uneven time intervals between measurements, time for the slope components in these analyses was coded proportionally to the lag from the first measurement to each timepoint: T1 as 0, T2 as 0.2, T3 as 0.7, T4 as 1.3, and T5 as 2.8 (please note that decimals were used to avoid inflated variance values). Since the variances of all latent variables were set to 1 for model specification, loneliness values had a mean of zero and SD of 1. Full information likelihood estimation was used to handle missing values (≤10.2%).
First, we tested two univariate models including only loneliness at five time points to determine the shape of the trajectory: a linear model including the intercept and linear slope of loneliness (Model 1) and a quadratic model including the intercept, the linear slope, and the quadratic slope of loneliness that fitted the data best (Model 2). Then, to test whether the different trajectories of loneliness from adolescence into mid-adulthood are associated with conspiracy worldviews in 2020, we added conspiracy worldview at T5 as an outcome measure (again, as a measurement model with a latent construct of conspiracy worldview consisting of scale items as observed indicators) to the retained quadratic model (Model 3). We regressed conspiracy worldview on the intercept and linear slope of loneliness (but not on the quadratic slope, due to its high correlation with the linear slope and the resulting multicollinearity). Moreover, we tested the robustness of this model by adding time-invariant covariates (sex as recorded in national registries, age at T5 as recorded in national registries, political orientation at T2, parental education at T1; Model 4) and symptoms of depression and anxiety as time varying covariate (Model 5).
Simple intercepts and slopes analysis
We conducted simple intercepts and slopes analyses73 to test how large the change in loneliness over three decades had been for participants who reported low, medium, and high levels of conspiracy worldview in midlife. Since the acceleration of the curve (quadratic slope) was not regressed on conspiracy worldview, we estimated its value at each level of conspiracy worldview based on the covariance of these two variables, using the formula:
$$q=\bar{q}+\frac{{{{{\mathrm{cov}}}}}(q,x)}{{{{{\mathrm{var}}}}}(q)}x$$ (1)
where q is the value of the quadratic slope at low, medium or high level of the outcome, \(\bar{q}\) is the mean of the quadratic slope, cov(q,x) is the covariance between the quadratic slope and the outcome, var(q) is the variance of the quadratic slope, and x is the value of the outcome at the corresponding (low, M – 1 SD; medium, M; or high M + 1 SD) level of the outcome (here, conspiracy worldview in 2020). The results are presented in Table 2.
Table 2 Estimated trajectories of loneliness by level of conspiracy worldview in midlife Full size table
Reporting summary
Further information on research design is available in the Nature Portfolio Reporting Summary linked to this article.