Initially, we sought to directly measure the concentration of caffeine (E ox = ≈1.4 V vs. Ag/AgCl25), CGAs (E ox = ≈0.2–0.5 V vs. Ag/AgCl, depending on the isomer23), and other redox-active species in undiluted coffee samples to study their dependence on conventional brew parameters. However, caffeine and CGAs form an aggregate at concentrations typical of brewed filter coffee26, terminally impacting their redox activity—they only become electrochemically well-resolved in acidified dilute solutions with added electrolyte. Literature examples dilute to below 0.02 wt.% TDS27, nearly two orders of magnitude weaker than filter coffee. Other groups have shown that by adulterating coffee with either CGA or caffeine, both boron-doped diamond (BDD) and glassy carbon (GC) electrodes can provide molecule-specific information28,29,30,31,32,33,34,35,36. Yet, these approaches required laborious sample preparations, in opposition of both our and the industry's goal of measuring features of as-consumed coffee. Ideally, ensemble chemical measureables map to sensory experiences and relate the electrochemical features to total beverage strength, rather than measuring the concentration of specific molecules contained within. Thus, we first ascertained the redox landscape in filter-strength coffee by making CV measurements using BDD, GC, and Pt working electrodes across the electrochemical window of the beverage (Fig. 1a).
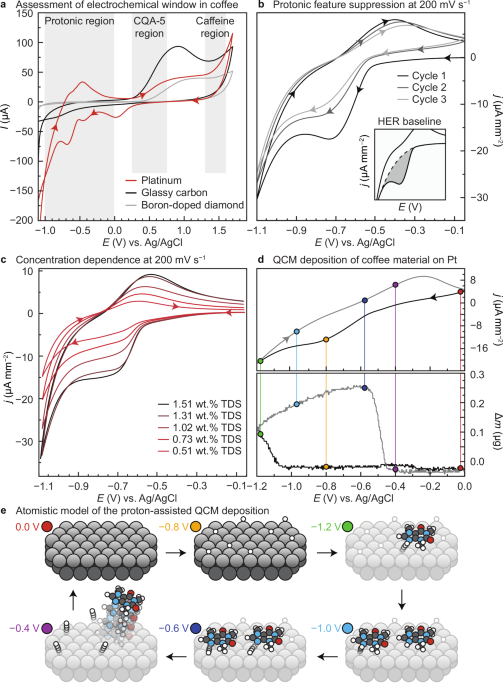
Fig. 1: Assessing the voltametric features present in coffee extracts. The alternative text for this image may have been generated using AI. Full size image a Cyclic voltammetry performed at 200 mV s−1 using boron-doped diamond, glassy carbon, and platinum working electrodes. Caffeine and chlorogenic acid potential ranges studied by other groups are highlighted. Here, we focus on the protonic features (H UPD and acid redox) region. b These features are suppressed with subsequent CV cycling due to deposition of coffee material on the surface of the electrode, and the total charge can be extracted by subtracting the hydrogen evolution reaction (HER) background. c The current depends on wt.% TDS of the brewed coffee because the protonic and organic concentration scales with wt.% TDS. d Scanning anodically results in mass accumulation on the working electrode, leading to electrode fouling. e The mechanism of mass accumulation is likely proton-assisted, given that appreciable mass does not deposit until the surface has accumulated a critical H-atom concentration. Source data are provided as a Source data file.
As-consumed filter coffee extracts are sufficiently conductive for direct electrochemical analysis without the addition of a supporting electrolyte (ranging from 2-3 mS cm−1, see Supplementary Fig. 1). Additionally, coffee extracts are self-buffered to pH of ≈4.8–5.9 depending on the distribution of compounds in the coffee and brew water composition37,38,39. Even after performing bulk electrolysis at oxygen evolution potentials for two minutes, the pH of a typical filter coffee remains numerically identical, reinforcing the significant buffering capacity of brewed coffee. Yet, despite the plethora of molecules in coffee extracts, the CV response of a Pt working electrode in 1.56 wt.% TDS coffee is consistent with that of dirty acidic water (Fig. 1a)40,41,42,43,44,45.
The cathodic Faradaic features map to the response expected for protonic reactions with the Pt surface (e.g., H UPD ), followed by H 2 evolution at more negative potentials. At positive potentials, OH adsorption and eventual O 2 evolution are also evident. To ascertain whether the anodic feature at –0.6 V is linked with the cathodic features in a reversible redox couple, we probed the scan rate dependence, Supplementary Fig. 2. The linear dependence of peak current on the square root of the scan rate for both features demonstrates the diffusion-controlled nature of the redox events, Supplementary Fig. 3, and the lack of an increase in the peak potential separation with increasing scan rate indicates Nernstian behavior, Supplementary Fig. 4. However, the large peak separation of ≈200 mV at all scan rates suggests that the reversibility of the redox couple is obfuscated by sluggish kinetics.
The same Pt surface sites that adsorb H+ and OH– are also able to adsorb other molecules in solution. In the case of oxidative cycling, some impurities in water compete for the Pt surface, resulting in reduced current with subsequent cycling due to a decrease in the accessible surface area. Given that Pt is known to interact with caffeine and other molecules in coffee46,47, we expected to see a decrease in exchange current density with sequential cycling. When scanning from 0 to –1.0 V, the H UPD and protonic features (E pc = –0.4 and –0.7 V, respectively) smear together and current decreases by ≈34% from CV scan 1 to 2 and ≈18% from scan 2 to 3 (Fig. 1b)48. In pH 7 water purified by reverse osmosis, the same features are not observed (Supplementary Fig. 5), suggesting that the response is due to protonic chemical steps associated with the coffee and not the water.
Further experiments were run to ensure that these features mapped to H UPD /weak acid reduction and its suppression by coffee molecules, rather than fluctuations in dissolved O 2 and other spurious effects, Supplementary Fig. 6. Since the integral of the current density depends on the activity of H+, the H UPD and acid features indirectly provide ensemble insights into the families of molecules in coffee that function as H+ donors and acceptors, the concentrations of which should depend on roast color, brewing parameters, brew water composition, and so forth. Some data in support of this hypothesis is that H UPD /acid reduction current density decreases with decreasing coffee concentration due to the diminished concentration of available H+ (Fig. 1c). Because the feature is concentration dependent, there are also fewer organic molecules competing to bind to the surface of the electrode. As we will show later, the integral of the charge current density of this feature linearly maps to wt.% TDS. Perhaps this is a surprising result, given that a single acidic feature should not necessarily depend on ensemble concentration.
To further support our proposed mechanism that protonic chemistry is being suppressed by adsorbed coffee material, we performed CV measurements using an electrochemical quartz crystal microbalance (QCM) with a Pt working electrode scanning at 50 mV s−1 (Fig. 1d). Scanning cathodically, appreciable mass begins to accumulate on the electrode at potentials more negative than H UPD —the balance is insensitive to surface H-adsorption but can detect larger molecule accumulation. There is a delayed onset, which attribute to a proton-assisted adsorption of Brønsted-basic species like caffeine, following a general mechanism (Fig. 1e). Upon scanning anodically from −1.2 to 0.0 V, mass continues to accumulate until the potential exceeds −0.5 V, when the electrode liberates most of the adsorbed organic material and protons back into solution. The response is reminiscent of a kinetic trap, where the surface assembly forms in kinetically favored conditions49. To ensure that the process was proton assisted, we also scanned from −1.2 to 0.0 V without first scanning cathodically and detected no mass accumulation, indicating that there must be an appreciable concentration of protons on the surface before larger organic species begin to accumulate, Supplementary Fig. 7.
While the total charge passed maps linearly to concentration for any particular coffee, coffees from different origins, processed in dissimilar ways, and roasted to different colors may show major differences in the emergence and suppression of the reductive features. However, before we can probe coffee-related variables we must first ensure that the suppression of the convoluted redox feature at −0.55 V depends on molecules likely found in all coffees. To determine the molecular identities of the adsorbed compounds, we developed the CV cycle shown in (Fig. 2a) to maximize mass accumulation on the Pt working electrode for further characterization. We were able to obtain sufficient coffee material on a Pt-mesh electrode surface by cycling 100 times from −0.55 to −1.2 V (Fig. 2a), followed by solvating the adsorbed material in a sonicated 4 mL bath of 80/20 water/acetonitrile (v/v), and repeating four times. The adsorbates could then be separated and characterized using high performance liquid chromatography coupled with high-resolution mass spectrometry (HPLC-MS, Fig. 2b). We found that caffeine had adsorbed in quantifiable concentration. Our combined samples yielded 7.8 ± 0.1 mg kg−1 caffeine, suggesting that at least one component of the accumulated mass that causes the current to decay over successive CV cycles originates from a molecule common to all coffees, and that our 4 mL solution contained ≈300 µg of caffeine, or ≈0.4% of the total caffeine in an average 180 mL cup of filter coffee50,51,52, (see Supplementary Figs. 8,9). That is, each 100-cycle CV presented in (Fig. 2a) scavenged ≈0.1% of the available caffeine in the cup, as well as other molecules.
Fig. 2: Identification of surface adsorbates at negative applied potentials. The alternative text for this image may have been generated using AI. Full size image a Cyclic voltammetry performed at 200 mV s−1 sampling potentials more negative than –0.5 V, to ensure our accumulated mass is maximized rather than liberated back into solution (Fig. 1d). The first four cycles of the second run are presented. b Combining the extracts from the surface of the Pt electrode sampled 100 times in four separate runs, we can detect the presence of caffeine and quantify it using the calibration curve presented in Supplementary Fig. 8. c The adsorption of caffeine and 5-caffeoylquinic acid is favored on all clear crystal facets of Pt according to density functional theory simulations, suggesting that a collection of organic molecules responsive to roast color and brewing parameters adsorb to the electrode surface. Source data are provided as a Source data file.
Given that a similar electrochemical approach has been used to quantify caffeine content in highly dilute coffee samples through oxidation29, and that bulk Pt also is known to adsorb organic material40, we were somewhat unsurprised to see caffeine in the chromatogram. However, there are of course some coffees that have been decaffeinated, prompting us to resolve whether this mass deposition can be attributed to additional adsorbates beyond caffeine. Because other adsorbates were not in sufficient concentration to quantify with HPLC-MS, we instead turned to density functional theory (DFT) paired with molecular dynamics simulations (MD) to model the Pt surface adsorption energies for caffeine as well as 5-caffeoylquinic acid (5-CQA), an abundant CGA isomer found in all coffees with a concentration that depends strongly on roast parameters50,53,54, (Fig. 2c). The inclusion of caffeine in the DFT study serves as a control to validate the model, and the inclusion of 3 low-index Pt surfaces, (100), (110), and (111), examines the possibility of preferential binding to certain facets of the polycrystalline Pt electrode used for the electrochemical measurements. The model we use does not account for the significant thermodynamic parameter of solvation, as explicit treatments of solvent molecules incur high computational costs and implicit models often fail to reproduce experimental solution-state adsorption energies. Because the penalty of excluding water from the Pt surface upon adsorption is unaccounted for, the calculated adsorption energies likely overestimate the attractive force of the interaction55. Furthermore, the exclusion of an applied electric field in the DFT model precludes both the assertion of equilibrium geometries for the Pt/adsorbate complex at potentials corresponding to electrochemical processes and the calculation of accurate thermochemical parameters for adsorbate formation. Nevertheless, a model of the electrode/adsorbate interface at zero field is instructive for determining relative trends of adsorption between similar molecules that form similar surface dipoles, and for assessing the existence or lack of facet dependence in the complex56.
For each combination of molecule and surface, we obtained several local-minimum configurations from the MD trajectories and then ran DFT structural optimizations to obtain equilibrium energies; the difference in energy between the molecule-surface complex and the isolated molecule and surface defines the adsorption energy, with a more negative value representing stronger binding. The adsorption of caffeine to three facets of Pt revealed that each facet stably binds caffeine as expected, with a slight preference for the (110) surface. Our calculations reveal that 5-CQA also forms stable complexes with the three Pt surfaces, albeit with a weaker interaction than caffeine, and prefers the (111) surface. Interestingly, 5-CQA binds least strongly to the (110) surface, indicating that specific crystal facets of the Pt electrode may offer some degree of selectivity for adsorbed species, which in turn may prove useful in follow-up work that harnesses the kinetics of adsorption to parse flavors. Together, the DFT models instruct that the suppression of the H UPD and protonic features likely captures the ensemble of various organic adsorbates binding to the electrode surface, providing information about the beverage concentration, as well as roast color, since roast will dictate the amount of 5-CQA (and caffeine57) in the cup.
Since the Faradaic protonic features depend on coffee concentration, we sought to elucidate how roast color (and subsequent chemical composition) impacts the redox response. To do so, we roasted a representative specialty coffee sourced from Colombia, following the profiles shown in Fig. 3a. The “light roast” profile was then systematically extended by 30 s and in final temperature by 1.11 °C (2 °F), to achieve four progressively darker coffees. A final sample was prepared by extending the fifth roast by a further 60 s and 2.22 °C (4 °F) to ensure that the roast colors covered a broad and reasonable range of Agtron values, see Methods. The roast profiles yielded coffees ranging from 75.8 (light) to 55.7 Agtron units (dark). Each roasted sample was rested for 7 days to allow for CO 2 off-gassing58 and then brewed using the Specialty Coffee Association cupping protocol59.
Fig. 3: Relating roast profile and beverage strength to the cathodic feature at –0.6 V. The alternative text for this image may have been generated using AI. Full size image a The measured temperature profiles used to generate six systematically darker roasts. b The first cycle CV response of these coffees brewed and diluted to 1.00 ± 0.02 wt.% TDS. c Subtracting the background contribution due to the onset of hydrogen evolution Supplementary Fig. 10, the total charge passed is linear with wt.% TDS with a slope dependent on roast color. Darker roasts more effectively suppress the cathodic features, likely because they contain more solvated oxidized molecules formed during roast. These compounds evidently tend to bind more strongly to Pt. d Plotting the total charge and wt.% TDS against the ground coffee Agtron value (roast color), a 3D planar relationship is recovered. Error bars (±0.01 wt.% TDS, ± 0.1 × 10⁻⁵ C) for panel c are omitted for clarity but can be found in Supplementary Fig. 11. Source data are provided as a Source data file.
To isolate roast dependence, some sample preparation is required. By diluting the extracts to 1.00 ± 0.02 wt.% TDS, electrochemical differences that depend on roast color were noted in the voltammograms (Fig. 3b). The lightest-roast coffee passes ≈50% more charge than the darker analogues at the same refractive index-derived strength. While wt.% TDS remains fixed, the electrochemical assessment of the cathodic feature depends on roast, a critical parameter that dictates the sensory experience (i.e., dark-roasted coffees taste “dark”). By integrating the exchange current density and adjusting for scan rate, we can extract the total charge passed for each coffee at any arbitrary concentration (Fig. 3c). Here, each roast shows a strong linear fit between wt.% TDS and electrochemical charge passed. Increasingly darker roasts yield both a shallower gradient and less total charge passed than the lighter-roast counterparts. The diminished current may be expected from the fact that darker coffees tend to have mildly elevated pH60,61, and that dark roasts have less water-soluble material contained within, thereby preferentially depositing organic material onto the electrode. The rate of suppression of these redox waves depends on composition (see Supplementary Figs. 12–17). Together, we can conclude that while the feature is indirectly related to coffee composition, it is sensitive to differences in roast-derived species.
The wt.% TDS can then be plotted along with the coffee Agtron color (both whole bean and ground show the same trend, see Supplementary Fig. 23) and total charge passed in the H UPD region to yield a plane of values of integrated charge for all combinations of wt.% TDS and Agtron color (Fig. 3d). While the shape of the plane may be coffee-specific, the fact that roast color maps linearly to charge allows for a wealth of applications. For example, a series of simple CV measurements on progressively more dilute coffee will allow a roaster to rapidly construct a quality control calibration curve, enabling quantitative comparisons of separate batches of the same coffee roasted to the same color. In a roastery quality control setting, it is possible that batches of roasted coffee could have similar whole bean colors but different flavor profiles, which may be detectable electrochemically as well as on the cupping table.
As a demonstration of the analytical capabilities of this approach, we sourced four batches of the same coffee roasted to a target same whole-bean Agtron color (93.0 ± 1.0 Agtron units) from a specialty roaster (Colonna, Bath, UK). Among those four batches, one was rejected by the roaster because it did not meet the color tolerance (the coffee was too light, 98.9 Agtron units), and it consequently exhibited undesirable flavors during their sensory quality control. We wondered whether we could discern an electrochemical difference between the accepted and rejected samples, in essence performing at least as well as the human tongue in the roastery.
The roaster provided single-blind samples to us, labeled 1, 2, 3, and 4, and did not specify which was rejected. We prepared each sample in quintuplicate in a randomized order and brewed them according to the Specialty Coffee Association cupping technique. The samples were undiluted to allow wt.% TDS to vary, thereby introducing realistic error to our samples. After performing CV measurements on the samples in yet another randomized order, statistical analysis was performed using Tukey’s honest significant difference analysis of variance. The analysis revealed that the measured wt.% TDS of each coffee was statistically identical (Fig. 4); neither color analysis nor refractive index of the extracts could tell these coffees apart. However, examination of the current passed in scan one revealed that sample 1 was statistically dissimilar to the other coffees (p < 0.0039). The same was found for scans two and three. However, examining the difference in current passed between scan one and two, normalized by the initial current in scan one (i.e., (A 1 –A 2 )/A 1 ), revealed that the rate of fouling of the electrodes was the same for all coffees (p > 0.832). That is, the rate of electrode fouling depends on concentration, but the charge passed depends on composition. By consulting with the roaster, sample 1 was revealed to be the rejected batch. Furthermore, the acceptable batches all fell within the same statistical class, demonstrating alignment between this electrochemical analysis and sensory profiling.
Fig. 4: Electrochemical quality control at the roastery. The alternative text for this image may have been generated using AI. Full size image A single-blind assessment of four coffees roasted to the same specification, but one (sample 1) exhibiting negative flavors due to minor variation in roast parameters. Tukey’s honestly significant difference (HSD) ANOVA results reveal the measured wt.% TDS was statistically identical across all four samples (connecting letters † class); a wt.% TDS differences (insignificant) ranged from 0.002 ± 0.02 to 0.03 ± 0.02, with p = 0.999 to p = 0.462, respectively (n = 5). b The background-subtracted integrated cathodic area at –0.6 V for the first cycle, A 1 , was split into two distinct classes, † and ††, with sample 1 in class † and samples 2, 3, and 4 in class ††. c The differences between classes † and †† were 2.19 ± 0.40 µA V (1-2; p = 0.0002), 1.73 ± 0.40 µA V (1-4; p = 0.0024), and 1.64 ± 0.40 µA V (1-3; p = 0.0039). Differences between batches in the †† class (insignificant) ranged from 0.09 to 0.55 µA V (p = 0.996 to p = 0.529, respectively). The fouling was captured by normalizing the differences in charge passed between scans one and two, where all four samples were found to exhibit indistinguishable decreases in current with subsequent scans. A comprehensive comparison is presented in Supplementary Figs. 21 and 22. Box plots display the interquartile range (IQR), with whiskers indicating the minimum and maximum observed response values. Differences among treatments were evaluated using a two-sided comparison of means based on the studentized range statistic (q). Source data are provided as a Source data file.
Considering the findings in this paper, there is obvious upside to electrochemical assays of coffee extracts. Coffees can now be quality controlled and distinguished by their charge response—which is linked to the collection of molecules competing for the Pt surface—rather than the ensemble effect on refractive index. Given that we know that the response depends on the concentration of H+ (correlated with perceived acidity)62 but is suppressed by roast-dependent molecules in coffee like caffeine (bitter)63 and chlorogenic acid (astringent64, sour65), the electrochemical technique implicitly provides insights about flavor. Finally, this approach is sensitive to coffee composition and hence may find use in achieving desirable blends, detecting differences in seasonal crops, and resolving other high-fidelity coffee variables.