In high school, we spend most of our days with friends and immediate family. Then we get older and get jobs, get married, and grow our own families to spend more time with co-workers, spouses, and kids. Here’s how things change, based on a decade of data from the American Time Use Survey, from age 15 to 80.
This is useful for seeing how relationships stack up for specific ages, but let’s look at the overall trends for each category. Again, the charts below show the percentage of people at each age who spent time with a person during the survey day.
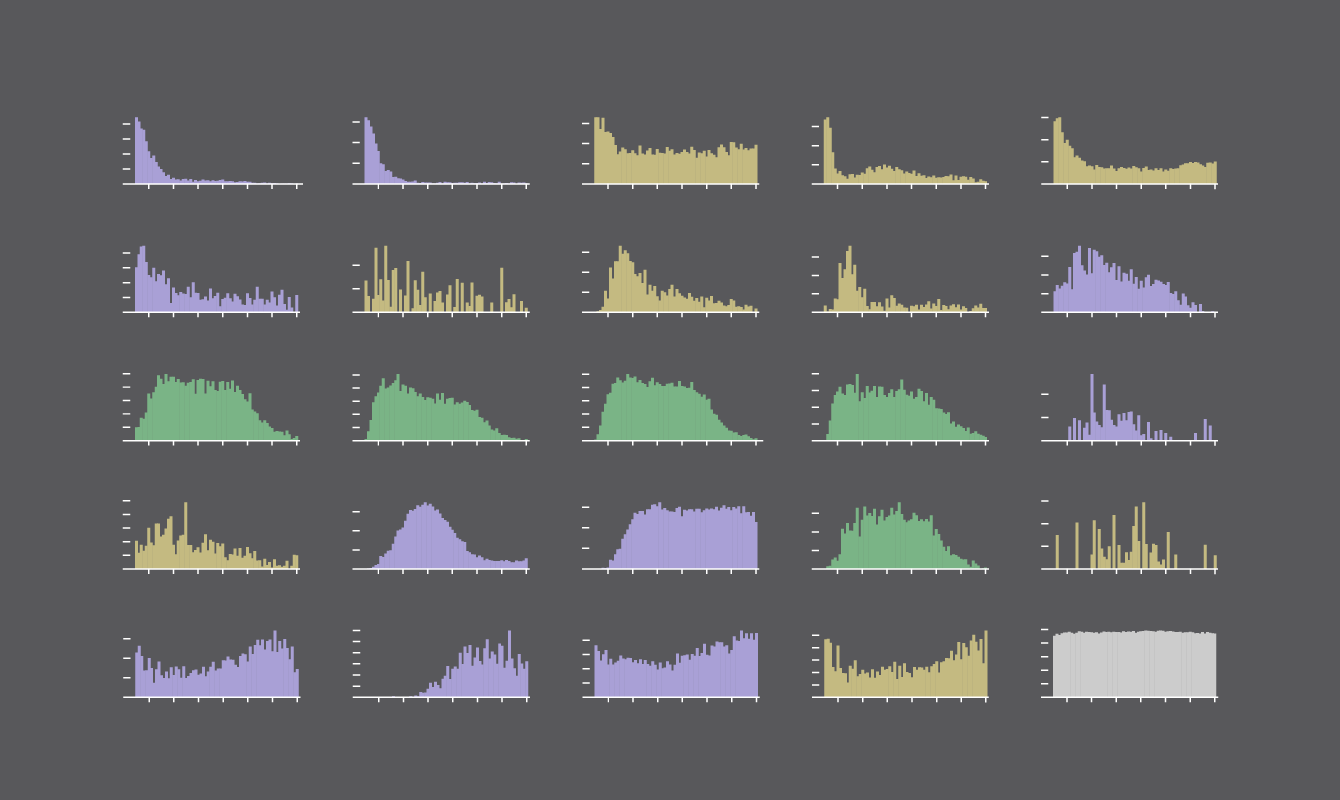
Who We Spend Time With, By Age Sorted by peak age from youngest to oldest. Other Adults (Not in Household and Not Own) Parent Sibling Other Children Under 18 (Not in Household) Friends Time with friends is also most common at a younger age. 60.0% While young, we commonly spend time with immediate family. 60.0% 30.0% 80.0% 30.0% 60.0% 40.0% 40.0% 20.0% 20.0% 40.0% 20.0% 20.0% 10.0% 10.0% 20.0% 0.0% 0.0% 0.0% 0.0% 0.0% 20 30 40 50 60 70 80 20 30 40 50 60 70 80 20 30 40 50 60 70 80 20 30 40 50 60 70 80 20 30 40 50 60 70 80 YEARS OLD Other Relatives Roomer or Boarder Unmarried Partner Housemate or Roommate Parents (Not in Household) 12.0% 8.0% 6.0% 6.0% 0.8% 6.0% 8.0% 4.0% 4.0% 4.0% 0.4% 4.0% 2.0% 2.0% 2.0% 0.0% 0.0% 0.0% 0.0% 0.0% 20 30 40 50 60 70 80 20 30 40 50 60 70 80 20 30 40 50 60 70 80 20 30 40 50 60 70 80 20 30 40 50 60 70 80 Co−Workers, Clients (Not for Work) Boss or Manager Co−Workers Customers Own Child Under 18 (Not in Household) Gotta pay the bills. 20.0% 25.0% 50.0% 25.0% 20.0% 40.0% 20.0% 15.0% 0.8% 15.0% 30.0% 15.0% 10.0% 10.0% 20.0% 10.0% 0.4% 5.0% 5.0% 10.0% 5.0% 0.0% 0.0% 0.0% 0.0% 0.0% 20 30 40 50 60 70 80 20 30 40 50 60 70 80 20 30 40 50 60 70 80 20 30 40 50 60 70 80 20 30 40 50 60 70 80 Other Non-Relative (in Household) Own Household Children Spouse People Whom I Supervise Foster Child 5.0% 0.6% 60.0% Kids enter the picture. 60.0% 12.0% 4.0% 0.4% 40.0% 3.0% 40.0% 8.0% 2.0% 0.2% 20.0% 20.0% 4.0% 1.0% 0.0% 0.0% 0.0% 0.0% 0.0% 20 30 40 50 60 70 80 20 30 40 50 60 70 80 20 30 40 50 60 70 80 20 30 40 50 60 70 80 20 30 40 50 60 70 80 Other Family Members Under 18 (Not in Household) Grandchild Other Adult Family Members (Not in Household) Neighbors or Acquaintances Alone 100.0% 6.0% 10.0% 12.0% 20.0% Grandkids enter the picture. 5.0% 80.0% Most people get some alone time during a day. 8.0% 4.0% 15.0% 60.0% 8.0% 6.0% 3.0% 10.0% 40.0% 4.0% 2.0% 4.0% 5.0% 20.0% 2.0% 1.0% 0.0% 0.0% 0.0% 0.0% 0.0% 20 30 40 50 60 70 80 20 30 40 50 60 70 80 20 30 40 50 60 70 80 20 30 40 50 60 70 20 30 40 50 60 70 80 80 SOURCE: American Time Use Survey 2011-2019 / BY: FlowingData Parent Sibling While young, we commonly spend time with immediate family. 60.0% 80.0% 60.0% 40.0% 40.0% 20.0% 20.0% 0.0% 0.0% 20 30 40 50 60 70 80 20 30 40 50 60 70 80 YEARS OLD Other Adults (Not in Household and Not Own) Other Children Under 18 (Not in Household) 30.0% 30.0% 20.0% 20.0% 10.0% 10.0% 0.0% 0.0% 20 30 40 50 60 70 80 20 30 40 50 60 70 80 Friends Other Relatives Time with friends is also most common at a younger age. 60.0% 8.0% 40.0% 6.0% 4.0% 20.0% 2.0% 0.0% 0.0% 20 30 40 50 60 70 80 20 30 40 50 60 70 80 Roomer or Boarder Unmarried Partner 12.0% 0.8% 8.0% 0.4% 4.0% 0.0% 0.0% 20 30 40 50 60 70 80 20 30 40 50 60 70 80 Housemate or Roommate Parents (Not in Household) 6.0% 6.0% 4.0% 4.0% 2.0% 2.0% 0.0% 0.0% 20 30 40 50 60 70 80 20 30 40 50 60 70 80 Co−Workers, Clients (Not for Work) Boss or Manager 25.0% 25.0% 20.0% 20.0% 15.0% 15.0% 10.0% 10.0% 5.0% 5.0% 0.0% 0.0% 20 30 40 50 60 70 80 20 30 40 50 60 70 80 Co−Workers Customers Gotta pay the bills. 20.0% 50.0% 40.0% 15.0% 30.0% 10.0% 20.0% 5.0% 10.0% 0.0% 0.0% 20 30 40 50 60 70 80 20 30 40 50 60 70 80 Own Child Under 18 (Not in Household) Other Non-Relative (in Household) 5.0% 4.0% 0.8% 3.0% 2.0% 0.4% 1.0% 0.0% 0.0% 20 30 40 50 60 70 80 20 30 40 50 60 70 80 Own Household Children Spouse 60.0% Kids enter the picture. 60.0% 40.0% 40.0% 20.0% 20.0% 0.0% 0.0% 20 30 40 50 60 70 80 20 30 40 50 60 70 80 People Whom I Supervise Foster Child 0.6% 12.0% 0.4% 8.0% 0.2% 4.0% 0.0% 0.0% 20 30 40 50 60 70 80 20 30 40 50 60 70 80 Other Family Members Under 18 (Not in Household) Grandchild 6.0% 12.0% Grandkids enter the picture. 5.0% 4.0% 8.0% 3.0% 2.0% 4.0% 1.0% 0.0% 0.0% 20 30 40 50 60 70 80 20 30 40 50 60 70 80 Other Adult Family Members (Not in Household) Neighbors or Acquaintances 10.0% 20.0% 8.0% 15.0% 6.0% 10.0% 4.0% 5.0% 2.0% 0.0% 0.0% 20 30 40 50 60 70 80 20 30 40 50 60 70 80 Alone 100.0% 80.0% Most people get some alone time during a day. 60.0% 40.0% 20.0% 0.0% 20 30 40 50 60 70 80 SOURCE: American Time Use Survey 2011-2019 / BY: FlowingData
For privacy reasons, the American Time Use Survey does not ask who people were with when they were doing certain activities, such as sleeping or grooming. So the percentages would shift some if we had those bits of data.
However, the trends make sense. In our younger years, we spend a lot of time with our parents and siblings. By middle age, work takes a lot of time and we see co-workers on the regular. Time with the kids peaks in the late 30s and early 40s.
It’s interesting to see the percentage rise for neighbors and acquaintances as we get older. I didn’t expect that, but it also seems to make sense. Friends and family pass away and we move into different living situations.
Then there’s alone time that mostly holds steady throughout our lives. Usually at some time during the day we’re alone. Although, as we get older, the amount of time we spend alone appears to increase. It might be interesting to look at total time for each of these categories.
Notes
The data comes from the American Time Use Survey. I used microdata, downloaded via IPUMS, from 2011 to 2019. There is data for 2020, but the survey didn’t run for a few months during the pandemic, so I didn’t include it here for a more complete comparison. Although the 2020 data didn’t seem to change the percentages that much.
I made the bar chart race with D3.js, and the small multiples were made in R and polished in Illustrator.