For the purpose of the study, we used the continuously collected and published data related to COVID-19 pandemic in Czechia11. In the database, deaths related to COVID-19 are defined as the deaths of “individuals positively tested for SARS-CoV-2 (by PCR) regardless of the reasons for their deaths, and regardless of whether they died in a hospital or outside hospital care”12. Clearly, for not all of the registered deaths, the COVID-19 was the underlying cause of death, however, the official statistics based on the underlying causes are published with a much higher time delay and the numbers are not distinguished according to the vaccination status. For this reason, we used the continuously registered data where the deaths could be taken directly or indirectly related to the disease. These data are also included in international databases and correspond to the international standards of data evidence12.
The initial dataset used for analysis included individual death records related to the COVID-19 disease in the period of three months from October 1 to December 31, 2021 (N = 5797) by the time given by the availability of data at the time of analysis (March 2022). Data were obtained from the Czech National Information System, which includes records of all individuals who tested positive for SARS-CoV-212,13.
The studied period was chosen for three main reasons: (1) only one variant, that is, the Delta variant was the dominant strain of COVID-1910; (2) the possibility of completed vaccination for all persons over 12 years of age; (3) the vaccines administered were suitable for the Delta variant14.
The following characteristics were available for all death records: age, sex, and information on the course of vaccination (date of the first, second, and booster vaccines). We used only population and numbers of deaths at the age of at least 12, because younger children were not vaccinated at that time in Czechia. The dataset was divided into two groups of cases according to the completed vaccination as follows: (a) persons who died without previously completed vaccination and (b) persons with completed vaccination at the time of death. At least one dose for a single-dose type of vaccine, or at least two doses for a two-dose vaccine, is considered the complete vaccination. Deaths of persons with incomplete vaccination (only one dose for a two-dose vaccine) are included in the first group (“without previously completed vaccination”), they are not studied separately as there are low numbers of cases.
Estimated years of life lost and saved
A measure of disease burden—expected years of life lost (YLL) is often used for comparative purposes. In the calculation, each death is weighted as a function of age at the time of death, reflecting the fact that deaths at young ages are related to a higher number of years of life lost (i.e. longer average lengths of potential remaining life lost) than deaths at an advanced age4,5. The potential remaining length of life was estimated using the age-specific life expectancy according to sex before the onset of the pandemic in 2019 (\({e}_{x, 2019}\)), as published by the Czech Statistical Office15.
Because several chronic diseases or health states such as obesity and diabetes mellitus are considered as factors increasing the risks of severe outcomes of COVID-19, it could be speculated that people who have died from the COVID-19 disease have usually been comorbid, with more serious diseases that are in themselves associated with reduced life expectancy. In that case, it seems rather inappropriate to use the average population life expectancy as the potential length of the remaining life of the population deceased in relation to COVID-19. Their potential remaining length of life could be expected to be on average shorter, however, the shortening could be only supposed or roughly estimated, as there are no data available for its calculation.
That is why the potential years of life lost or years of life saved are estimated using three scenarios based on different assumptions of the potentially remaining length of life. The potential remaining length of life in all of them is based on official life tables for the year 201915.
In the first one, the baseline scenario, the life expectancy (\({e}_{x, 2019,}\)) is used as an estimation of the potential remaining years of life for all of the deceased persons in relation to COVID-19. As mentioned above, this assumption seems to be rather overestimated in relation to the potential remaining length of life.
In the second scenario, we used the 70th percentile of remaining expected years of life for each sex and age from the official life tables for the year 201915 (i.e. we used the potential remaining length of life as the number of years of life within which the first 30% of the population aged x die according to the distribution of the survival function, \({l}_{x}\), in the life tables, \({e}_{x, 2019, P70}\)). In general, we used the calculation as
$${e}_{x, 2019, P}={x}_{P}+\frac{{l}_{{x}_{P}}-P\times {l}_{x}}{{l}_{{x}_{P}}-{l}_{{x}_{P}+1}}$$ (1)
where P = 0.7 for the 70th percentile, \({l}_{x}\) is the survival function of the life tables \(, {x}_{P}\) is the highest age where \({l}_{x}\) is higher than \(P\times {l}_{x}\).
In the third scenario, the 90th percentile was used, where the potential remaining length of life at age x was set as the value corresponding to the death of the first 10% of the population at that age (based again on life tables 2019, \({e}_{x, 2019, P90}\) calculated as in Eq. (1) where P = 0.9).
Except for the baseline scenario, the above-mentioned third scenario (based on \({e}_{x, 2019, P90}\)) could be taken as rather a pessimistic one according to assumptions of the potential remaining length of life, and the second scenario (based on \({e}_{x, 2019, P70}\)) may provide the closest real potential. When dealing with the scenarios, it is important to keep in mind that the main aim is to compare the overall trends or crucial differences given by the initial assumptions of the scenarios, not to discuss the detailed resulting values based on estimations and assumptions.
In the equations, the number of deaths at age x is marked as \({D}_{ x}\). The calculation was processed separately for males and females, and for detail of individual ages, values of YLL were then aggregated according to below-defined age groups.
$${YLL}=\sum_{x}{YLL}_{ x}=\sum_{x}{D}_{ x} *{e}_{x, 2019, scenario=i}$$ (2)
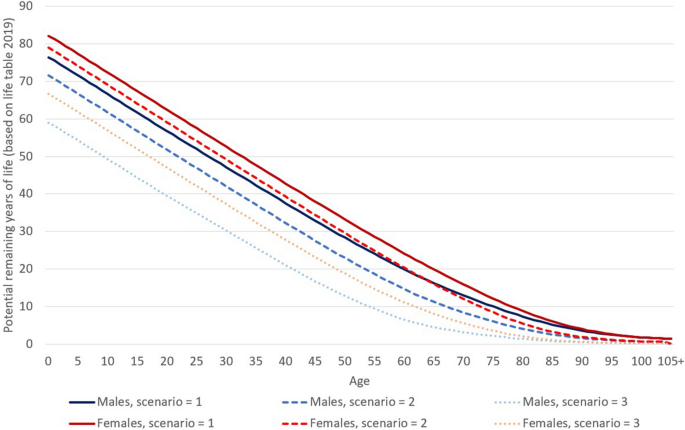
where \({e}_{x, 2019, scenario=i}\) is equal to \({e}_{x, 2019}\) for the baseline scenario, it is equal to \({e}_{x, 2019, P70}\) for i = 2 or \({e}_{x, 2019, P90}\) for i = 3. Values of life expectancy (\({e}_{x, 2019}\)) for males and females, as well as \({e}_{x, 2019, P70}\) and \({e}_{x, 2019, P90}\) are presented in Fig. 1. On average, a man dying at the age of 65 loses 16.3 potential years of life in scenario 1 (corresponds to the life expectancy at age 65 for males in 2019), 11.3 years in scenario 2, and 4.6 years in scenario 3. For females, those three values would be 19.9 in scenario 1, 16.1 in scenario 2, and 8.1 years in scenario 3. Based on Eq. (2), the potential remaining years of life represents a weight of the number of deaths at each age.
Figure 1 Potential years of remaining life (Eq. 1) according to age used in the three scenarios of the analysis for males and females based on the life tables for the year 2019. Source: author’s calculation according to Eq. (1)15. Full size image
Years of life saved (YLS) through COVID-19 vaccination are proposed as a (more optimistic and, therefore, potentially more publicly acceptable) measure of the effect of vaccination on COVID-19-related mortality. Since this is the estimated effect of vaccination, the value of YLS is calculated only for the sub-population with completed vaccination. In this paper, it was estimated as a difference between the hypothetical years of life lost (\({YLL}_{HYP}\)) in the sub-population with completed vaccination and years of life lost based on registered deaths related to COVID-19 in the population with completed vaccination (\({YLL}_{vac}\)) (Eq. 3).
$$YLS={YLL}_{HYP}-{YLL}_{vac}$$ (3)
The hypothetical years of life lost (\({YLL}_{HYP}\)) are calculated only for the population with completed vaccination, and it is based on the assumption that the risk of COVID-19-related death in the population with completed vaccination was equal to the risk of COVID-19-related death in the population without completed vaccination (Eq. 4).
The first step in the calculation of the hypothetical years of life lost (\({YLL}_{HYP}\)) is the estimation of the hypothetical number of deaths at age x (\({D}_{HYP, x}\)) under the assumption that the risk of death in the population with completed vaccination was equal to the risk of death in the population without completed vaccination. It was estimated using the population size with completed vaccination according to age and sex (\({P}_{vac, x}\)) and age-specific quotients of lethality (risk of death) from COVID-19 in the population without completed vaccination (\({lq}_{unvac, x}\)):
$${D}_{HYP, x}= {P}_{vac, x}* {lq}_{unvac, x}={P}_{vac, x}*\frac{{D}_{unvac, x}}{{P}_{unvac, x}}$$ (4)
where \({P}_{vac, x}\) and \({P}_{unvac, x}\) are the estimated population sizes according to age (x) at the beginning of the studied period (October 1, 2021) with completed vaccination (vac) and without completed vaccination (unvac) using the numbers of fully vaccinated persons based on the official evidence11. Where \({D}_{unvac, x}\) is the registered number of deaths at age x related to COVID-19 in the population without completed vaccination, the age-specific quotient of lethality (\({lq}_{unvac, x}\)) represents the risk of an person without completed vaccination dying from COVID-19 during the studied period.
If the risk of death of the population with completed vaccination as well as the population without completed vaccination was the same (assumption of the null effect of completed vaccination), the number of deaths among the population with completed vaccination would equal to \({D}_{HYP, x}\). Using the average number of years of life lost per death from the population without completed vaccination (\(\frac{{YLL}_{unvax, x}}{{D}_{unvax, x}}\)) the hypothetical years of life lost is calculated as (second step of the calculation, Eq. 5):
$${YLL}_{HYP}=\sum_{x}{D}_{HYP, x}*\frac{{YLL}_{unvax, x}}{{D}_{unvax, x}}$$ (5)
In the calculations of years of life saved (YLS), we used the age groups (12–44, 45–64, 65–84, 85 +) instead of individual ages, and all the calculations were also processed separately for males and females. Also, other results are presented for the defined age groups. That is, the age group labeled as 85 + represents the oldest population aged 85 and more years, most often affected by chronic diseases, etc. Younger seniors are represented by the age group 65–84 years. The younger ages are further divided into the age 12–44 years, where only a marginal part of deaths occurs, and the age group 45–64 years which could still be considered as a relatively young age group (in the age of economic activity). However, this age group had already been significantly affected by the pandemic (see below, Table 1).
Table 1 Registered numbers of deaths within the population with completed vaccination and without completed vaccination by males, female and, both sexes during the period from October 1 to December 31, 2021. Full size table
All methods were carried out in accordance with relevant guidelines and regulations; no experiments on humans were done, and no human tissue samples or data were used.
Ethics declarations
Data are routinely collected in compliance with Czech legal regulations (Act on the Protection of Public Health). To use anonymized, retrospective data from this database there is no need for ethical approval.