Descriptives
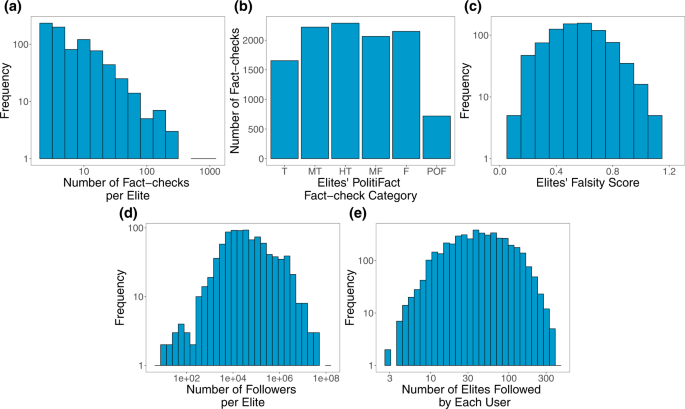
We begin with descriptives of the fact-checking data we collected from PolitiFact. Figure 1a shows the distribution of the number of fact-checks per elite. Restricting to accounts with at least three fact-checks (and who are therefore included in our study), Fig. 1b shows the number of fact-checks per each category of rating, and Fig. 1c shows the distribution of falsity scores associated with each elite. Figure 1d shows the distribution of the elites’ number of Twitter followers and Fig. 1e shows the number of elites followed by each Twitter user in our sample.
Fig. 1: Descriptives of the fact-checking dataset that forms the basis of our elite misinformation-exposure measure. a Distribution of number of fact-checks per elite provided by PolitiFact. b Number of fact-checks per each PolitiFact category (T True, MT Mostly True, HT Half True, MF Mostly False, F False, POF Pants on Fire). c Distribution of falsity scores associated with each elite. d Distribution of number of Twitter followers of elites. e Distribution of number of elites followed by each Twitter user in our sample. Source data are provided as a Source Data file. Full size image
Misinformation exposure and users’ characteristics
Next, we look at the relationship between users’ misinformation-exposure scores (as measured by averaging the falsity scores of the elite Twitter accounts they followed) and their characteristics, estimated from their digital fingerprints on Twitter. Consistent with our expectation that following more misinformation-spreading accounts (and thus being exposed to more misinformation) should result in sharing more misinformation oneself, users’ misinformation-exposure scores are negatively correlated with the quality of content they shared. We measured news quality using domain-level trustworthiness ratings, generated in two different ways. First, we used the average rating of eight professional fact-checkers. Second, we used ratings collected from a sample of 970 Americans quota-matched to the national distribution on age, gender, ethnicity, and geographic region; the average rating of respondents who preferred the Democratic party were averaged with the ratings of the respondents who preferred the Republican party to create politically balanced layperson ratings. Users’ misinformation-exposure score was negatively associated with the quality of information shared using both the professional fact-checker ratings (Fig. 2a; b = −0.728, 95% CI = [−0.753, −0.704], SE = 0.013, t (3072) = −58.184, p < 0.001) and the politically balanced layperson ratings (Fig. 2b; b = −0.540, 95% CI = [−0.570,−0.510], SE = 0.015, t (3072) = −35.299, p < 0.001).
Fig. 2: Exposure to elite misinformation is associated with sharing news from lower-quality outlets and with conservative estimated ideology. Shown is the relationship between users’ misinformation-exposure scores and (a) the quality of the news outlets they shared content from, as rated by professional fact-checkers21, (b) the quality of the news outlets they shared content from, as rated by layperson crowds21, and (c) estimated political ideology, based on the ideology of the accounts they follow10. Small dots in the background show individual observations; large dots show the average value across bins of size 0.1, with size of dots proportional to the number of observations in each bin. Source data are provided as a Source Data file. Full size image
Aligned with prior work finding that people who identify as conservative consume15, believe24, and share more misinformation8,14,25, we also found a positive correlation between users’ misinformation-exposure scores and the extent to which they are estimated to be conservative ideologically (Fig. 2c; b = 0.747, 95% CI = [0.727,0.767] SE = 0.010, t (4332) = 73.855, p < 0.001), such that users estimated to be more conservative are more likely to follow the Twitter accounts of elites with higher fact-checking falsity scores. Critically, the relationship between misinformation-exposure score and quality of content shared is robust controlling for estimated ideology (b = −0.712, 95% CI = [−0.751, −0.673], SE = 0.020, t (3067) = 36.008, p < 0.001 using professional fact-checker ratings; b = −0.565, 95% CI = [−0.613,−0.518], SE = 0.0124, t (3067) = −23.387, p < 0.001 using crowd ratings), whereas the magnitude of the relationship between estimated ideology and quality of content is reduced when controlling for misinformation-exposure score (b = −0.021, 95% CI = [−0.058, 0.016], SE = 0.019, t (3067) = −1.115, p = 0.265 using professional fact-checker ratings; b = 0.030, 95% CI = [−0.015, 0.076], SE = 0.023, t (3067) = 1.307, p = 0.191 using crowd ratings) the coefficient of estimated ideology decreases by almost 100% (from −0.548 to −0.021 using professional fact-checker ratings and from −0.388 to 0.030 using crowd ratings) and becomes insignificant (p < 0.001 to p = 0.265 using professional fact-checker ratings and p < 0.001 to p = 0.191 using crowd ratings) when we include misinformation exposure to predict quality of content. Thus, our misinformation-exposure score successfully isolates the predictive power of following inaccurate accounts (above and beyond estimated ideology), with misinformation-exposure explaining 53% of the variation in the quality of news sources shared when evaluating quality based on fact-checker ratings, and 29% of the variation in the quality of news sources shared when evaluating quality based on crowd ratings.
Given that toxicity and outrage may be associated with online misinformation26, we also calculated the average language toxicity using Google Jigsaw Perspective API27 and the average level of moral-outrage language using a recently published estimator28.We found that misinformation-exposure scores are significantly positively related to language toxicity (Fig. 3a; b = 0.129, 95% CI = [0.098, 0.159], SE = 0.015, t (4121) = 8.323, p < 0.001; b = 0.319, 95% CI = [0.274, 0.365], SE = 0.023, t (4106) = 13.747, p < 0.001 when controlling for estimated ideology) and expressions of moral outrage (Fig. 3b; b = 0.107, 95% CI = [0.076, 0.137], SE = 0.015, t (4143) = 14.243, p < 0.001; b = 0.329, 95% CI = [0.283,0.374], SE = 0.023, t (4128) = 14.243, p < 0.001 when controlling for estimated ideology). See Supplementary Tables 1, 2 for full regression tables and Supplementary Tables 3–6 for the robustness of our results.
Fig. 3: Exposure to elite misinformation is associated with the use of toxic language and moral outrage. Shown is the relationship between users’ misinformation-exposure scores and (a) the toxicity of the language used in their tweets, measured using the Google Jigsaw Perspective API27, and (b) the extent to which their tweets involved expressions of moral outrage, measured using the algorithm from ref. 28. Extreme values are winsorized by 95% quantile for visualization purposes. Small dots in the background show individual observations; large dots show the average value across bins of size 0.1, with size of dots proportional to the number of observations in each bin. Source data are provided as a Source Data file. Full size image
We also note that the list of elites we used here can be used to estimate users’ political ideology. To estimate ideology using the list of elites, we code the ideology of democrat elites as −1 and Republican elites as 1, then for each user we average over the ideology of the elites they follow. Our measure of estimated ideology is strongly correlated with the follower-based ideology estimators of ref. 10 (r = 0.86, 95% CI = [0.855, 0.870], t (4330) = 112.45, p < 0.001).
Misinformation-exposure score and co-share network
Next, we gain more insight into the correlates of exposure to misinformation from elites by investigating which domains are preferentially shared by users with higher versus lower misinformation-exposure scores (for similar analyses of co-follower and co-retweet networks, see Supplementary Figs. 1, 2 and Supplementary Tables 7–10). To do so, we constructed a co-share network (see the Methods Section) of the 1798 domains that were shared by at least 20 users in our sample.
Community-detection analysis29 on the co-share network reveals three distinct clusters of domains (Fig. 4a). Table 1 shows the 10 domains that are shared by the largest number of users in our sample in each cluster. The clusters differ in the average misinformation-exposure scores of users who shared them (Fig. 4b; average misinformation-exposure scores of users who shared domains in each cluster are cluster 1, 0.389; cluster 2, 0.404; cluster 3, 0.506), as well as their estimated ideology (Fig. 4c; average estimated ideology scores of each cluster are cluster 1, −0.470; cluster 2, 0.038; cluster 3, 1.22). Specifically, we see a cluster of domains estimated to be liberal, a cluster of center-left domains, and a cluster of domains estimated to be conservative, with misinformation exposure higher in the cluster of accounts estimated to be conservative compared to the other two clusters. Importantly, average misinformation-exposure scores of users who shared those domains differed significantly across clusters, even when controlling for average estimated ideology score (p < 0.001 with and without ideology control, Tukey’s Honestly Significant Differences test).
Fig. 4: In the co-share network, a cluster of websites shared more by conservatives is also shared more by users with higher misinformation exposure scores. Nodes represent website domains shared by at least 20 users in our dataset and edges are weighted based on common users who shared them. a Separate colors represent different clusters of websites determined using community-detection algorithms29. b The intensity of the color of each node shows the average misinformation-exposure score of users who shared the website domain (darker = higher PolitiFact score). c Nodes’ color represents the average estimated ideology of the users who shared the website domain (red: conservative, blue: liberal). d The intensity of the color of each node shows the average use of language toxicity by users who shared the website domain (darker = higher use of toxic language). e The intensity of the color of each node shows the average expression of moral outrage by users who shared the website domain (darker = higher expression of moral outrage). Nodes are positioned using directed-force layout on the weighted network. Full size image
Table 1 Top website domains in each cluster within the co-share network Full size table
Additionally, the clusters differ in the average toxicity of language use (Fig. 4d; average toxicity of language use of users who shared domains in each cluster are cluster 1, 0.186; cluster 2, 0.159; cluster 3, 0.199) and moral-outrage expressions (Fig. 4e; average moral-outrage expressions in each cluster are cluster 1, 0.213; cluster 2, 0.170; cluster 3, 0.226) of the users who shared the domains, such that the users of the more politically moderate cluster are less likely to use toxic and moral-outrage language compared to the clusters estimated to be liberal or conservative (p < 0.001 with and without ideology control, Tukey’s Honestly Significant Differences test).
We found qualitatively similar results investigating the co-follower and co-retweet networks (see Supplementary Figs. 1, 2 and Supplementary Tables 7–10).
Estimated ideological extremity and misinformation exposure
Finally, we complement the co-follower and co-share network analyses with a user-level analysis examining the relationship between estimated ideological extremity and misinformation exposure. To do so, we predict misinformation-exposure scores of the users in our sample using their estimated ideological extremity (i.e., absolute value of estimated ideology) interacted with binary estimated ideology (liberal versus conservative). We do this analysis using two different methods for robustness: (i) As in the rest of the paper, we use political ideology estimated from the political accounts users follow10 and discretize based on scores above vs. below 0; and (ii) we estimate users’ ideology based on their media sharing30 and use the estimated ideology of the Associated Press (AP; a neutral outlet) as the cut-off (with users who share content that is on average more liberal than AP classified as liberal, and users who share content that is on average more conservative than AP classified as conservative).
We find that more ideologically extreme users are exposed to more misinformation—but, interestingly, this association is stronger among users estimated to be conservative compared to users estimated to be liberal. Specifically, we find a significant interaction between estimated conservative ideology and estimated ideological extremity (Fig. 5; b = 0.756, 95% CI = [0.726, 0.786], SE = 0.015, t (4330) = 49.871, p < 0.001 when estimating ideology using accounts followed and b = 0.415, 95% CI = [0.367, 0.462], SE = 0.024, t (3100) = 17.101, p < 0.001 when estimating ideology using news media sharing). Decomposing this interaction, we find a stronger association between estimated ideological extremity and misinformation exposure among users estimated to be conservative (b = 0.825, 95% CI = [0.804,0.846], SE = 0.010, t (2852) = 77.97, p < 0.001 when estimating ideology using accounts followed and b = 0.567, 95% CI = [0.523, 0.610], SE = 0.022, t (1381) = 25.508, p < 0.001 when estimating ideology using news media sharing) than users estimated to be liberal (b = 0.160, 95% CI = [0.110, 0.211], SE = 0.025, t (1478) = 6.255, p < 0.001 when estimating ideology using accounts followed and b = 0.111, 95% CI = [0.065, 0.159], SE = 0.023, t (1719) = 4.659, p < 0.001 when estimating ideology using news media sharing). See Supplementary Table 11 for the full regression. We find a similar asymmetry when using language toxicity or moral outrage as the outcome, rather than misinformation-exposure score (see Fig. 6 and Supplementary Table 12).
Fig. 5: Estimated ideological extremity is associated with higher elite misinformation-exposure scores for estimated conservatives more so than estimated liberals. a Political ideology is estimated using accounts followed10. b Political ideology is estimated using domains shared30 (Red: conservative, blue: liberal). Source data are provided as a Source Data file. Full size image