Informed consent and ethics approval
This study has been approved by the UCL Ethics Research Committee. The ethics project ID number is CPB/2013/015. Participants were explained the purpose of the game when opening the app, before they could start playing. Players had to tick an ‘opt in’ box if they agreed to share their data with us. They were guided to the settings where the opt out option always remained available. They could also choose to provide their demographic or not. This was done in two steps. First, they could enter their age, gender and home country. Then, after having played a few levels, participants could provide further information such as their average sleep duration, level of education, commute duration, and the type of environment they grew up in.
Data and task
The Sea Hero Quest app was released on May 2016 on the App Store for iOS and on Google Play for Androids. It was available to the general public in 17 languages: English, French, German, Spanish, Macedonian, Greek, Croatian, Dutch, Albanian, Hungarian, Romanian, Slovak, Czech, Polish, Portuguese, Italian, and Serbian. The Sea Hero Quest task and data collection have been thoroughly described in ref. 18. We set up a portal where researchers can invite a targeted group of participants to play Sea Hero Quest and generate data about their spatial navigation capabilities. Those invited to play the game will be sent a unique participant key, generated by the Sea Hero Quest system according to the criteria and requirements of a specific project. https://seaheroquest.alzheimersresearchuk.org/Access to the portal will be granted for non commercial purposes. Future publications based on this dataset should add “Sea Hero Quest Project” as co-author.
Participants
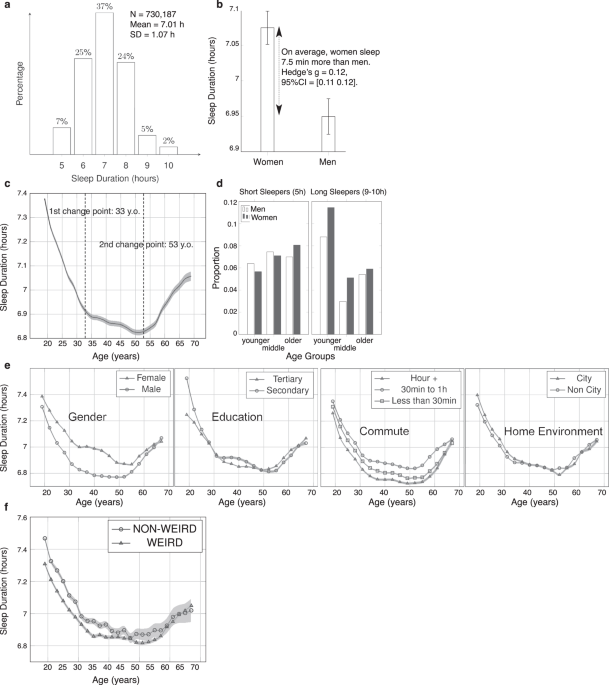
A total of 3,881,449 participants played at least one level of the game. 60.8% of the participants provided basic demographics (age, gender, home country) and 27.6% provided more detailed demographics (home environment, level of education). We removed participants above 70 years old because we have previously shown that they suffer from a strong selection bias, causing their performance to be substantially higher than would be expected in unselected participants of the same age18. We removed participants with an average sleep duration above 10 h (0.6%) or below 5 h (0.9%) for 2 reasons. First, they represent only 1.5% of the participants, much less than the other sleep duration groups. Second, they are more likely than others to erroneously enter their demographics. As explained in ref. 18, there are many more 99ers than would be predicted from the age distribution, likely because it is one extremum of the age range. We noticed that the proportion of 99ers in participants who reported sleeping extreme hours is much higher than in participants who reported sleeping between 5 h and 10 h. Thus, we applied the same treatment to 99ers as to participants who reported sleeping extreme hours and removed them from the analysis. We compared the wayfinding performance of participants who chose to report sleep duration versus those who didn’t. We obtained a very weak effect size: Hedge’s g = 0.012, 95% CI = [0.008, 0.016], indicating that there is no meaningful difference in terms of navigation between the two groups. To ensure robust results within countries, we removed participants from countries with fewer than 500 players. This resulted in 730,187 participants from 63 countries included in our analysis, (see Table S1). To provide a reliable estimate of spatial navigation ability, we examined the data from a subset of participants who completed the tutorial levels at least the first four wayfinding levels (up to level 11 in the game, N = 418,152). We only analyzed the first attempt of each level. When the participant retried a level to improve their score, we did not include the associated trajectory in the analysis.
Demographics
Among the 730,187 included participants, 381,153 identified as men and 349,034 as women. The mean age was 38.71 years (SD = 14.53 years). 526,170 reported having received a tertiary education and 204,017 a secondary education or less. 222,097 reported having grown up in a city environment and 508,090 outside cities. 291,822 reported commuting on average less than 30 min per day, 254,362 between 30 min and 1 h, and 183,764 more than 1 h. Among the 418,152 participants included for the spatial ability analysis, 224,159 identified as men and 193,993 as women. The mean age was 37.80 years (SD = 14.13 years). 301,515 reported having received a tertiary education and 116,637 a secondary education or less. 123,733 reported having grown up in a city environment and 294,419 outside cities. 162,680 reported commuting on average less than 30 min per day, 148,167 between 30 min and 1 h, and 107,305 more than 1 h.
Country clusters
We used the supra-national clusters defined in ref. 23. The sample size and demographics of each cluster are available in Supplementary Fig 3.
African cluster: South Africa, Egypt.
East Europe cluster: Czech Republic, Hungary, Poland, Romania, Russia, Slovakia, Ukraine, Albania, Serbia, Croatia, Albania, Macedonia, Cyprus.
Western Europe cluster: Germany, Austria, Switzerland, England, Ireland, Sweden, Norway, Finland, Denmark, Netherlands, France, Belgium, Italy, Portugal, Spain, Greece.
Western Asia cluster: United Arab Emirates, Saudi Arabia, Turkey, Israel, Lebanon, Iran.
Western Offshoot: United States, Canada, Australia, New Zealand.
Latin America cluster: Argentina, Peru, Chile, Bolivia, Colombia, Puerto Rico, Ecuador, Costa Rica, Venezuela, Uruguay, Brasil, Mexico.
East Asia cluster: India, Indonesia, Malaysia, Philippines, Thailand, Vietnam, China, Singapore, Hong Kong, Taiwan, Japan, South Korea.
We also used the cultural clusters defined in ref. 25. The sample size and demographics of each cluster are available in Supplementary Fig 4.
African cluster: South Africa, Egypt.
East Europe cluster: Czech Republic, Hungary, Poland, Romania, Russia, Slovakia, Ukraine, Albania, Serbia, Croatia, Albania, Macedonia, Cyprus.
Near East cluster: Greece, Turkey, Lebanon, Iran.
Germanic cluster: Germany, Austria, Switzerland.
Nordic cluster: Sweden, Norway, Finland, Denmark, Netherlands.
Latin Europe cluster: France, Belgium, Italy, Portugal, Spain, Israel.
Anglo cluster: United States, Canada, Australia, New Zealand, England, Ireland.
Arabic cluster: Saudi Arabia, United Arab Emirates
Latin America cluster: Argentina, Peru, Chile, Bolivia, Colombia, Puerto Rico, Ecuador, Costa Rica, Venezuela, Uruguay, Brasil, Mexico.
Confucian Asia cluster: China, Singapore, Hong Kong, Taiwan, Japan, South Korea.
Far East cluster: India, Indonesia, Malaysia, Philippines, Thailand, Vietnam
Spatial navigation task and metric
Navigation task
At the beginning of each wayfinding level, participants were asked to memorize the locations of 1 to 5 checkpoints to visit on a map. The map disappeared, and they had to navigate a boat through a virtual environment to find the different checkpoints in a set order (Fig. 2a). Participants were incentivized to complete the task as quickly as possible; they were awarded ‘stars’ when finishing each level before a set time.
Wayfinding and training performances
We collected the coordinates of participants’ trajectories every 500 ms. As in ref. 18, we computed the trajectory length in pixels, defined as the sum of the Euclidean distance between the points of the trajectory. To control for familiarity with handling tablets/smartphones, we divided the trajectory length of each level by the sum of the trajectory lengths of the first two levels. The first two levels were tutorial levels to familiarize the participant with the game commands. They did not require any spatial ability as the target was visible from the starting point. We defined the wayfinding performance (WF) as the 1st component of a principal component analysis across the trajectory lengths (divided by the tutorial trajectory lengths) of the first four wayfinding levels (levels 6, 7, 8 and 11, 60.14% of variance explained). This metric being based on the trajectory length, it varies as the opposite of the performance: the longer the trajectory length, the worse the performance. We took the additive inverse of the metric and added an offset, so that WF = 0 corresponds to the worst performances. The training performance (TP) was obtained via the same method, but only with the first two tutorial levels, and obviously without controlling for familiarity with handling tablets/smartphones. Finally, to put TP and WF on the same scale, we z-scored them (M = 0, SD = 1). To sum up, WF and TP vary in the opposite direction than the trajectory length. Short, thus optimal trajectories, correspond to a high performance. Positive WF and TP values correspond to above average performance, while negative values correspond to below average performance.
Analysis
Change-points estimation
The change points of the curve representing reported sleep duration as a function of age (Fig. 1c) are estimated with a parametric global method, systematically varying the location of the division points until the total residual error attains a minimum51. This method is implemented in the Matlab function (introduced in R2016a) findchangepts with the linear statistics option. More precisely, this method starts by randomly dividing the age curve into two sections. Then it computes a least-square regression line for each section, and adds the deviations (sum of squared differences between the signal values and the predictions) section-to-section to find the total residual error. This procedure is repeated for all divisions points until the total residual error attains a minimum. Since the number of change points is to be determined, we added a penalty term to the residual error. This is necessary since the residual error decreases with the number of change points and too many change points results in overfitting. We used a penalty term that grows linearly with the number of change points. Let x be the signal and \(\hat{x}\) be the best-fit line between s j and s j+1 , thus the sum of square error is
$${{{{{{\rm{SSE}}}}}}}_{j}=\mathop{\sum }\limits_{i={s}_{j}}^{{s}_{j+1}-1}{({x}_{i}-{\hat{x}}_{i})}^{2}$$ (1)
If there are K changepoints to be found, with s 0 the first and s K the last sample of the signal, we minimized
$${{{{{{\rm{Deviation}}}}}}}_{K}=\mathop{\sum }\limits_{j=0}^{K-1}{{{{{{\rm{SSE}}}}}}}_{j}+\beta K$$ (2)
The constant β corresponds to a fixed penalty for each added change point. The algorithm does not add additional change points if the decrease in deviation does not meet a set threshold T. We incrementally varied the threshold from T = 0.005 to T = 0.09 by 0.001 steps and obtained the same change points (at 33 years and 53 years). At T = 0.1, the algorithm returns a unique change point at 38 years. At T = 0.004, the algorithm returns 3 change points: at 21 years, 33 years, and 53 years. Since the curve representing sleep duration as a function of age does not show any inflection point at 38 years or 21 years are not, we set the threshold to T = 0.02.
Linear-mixed models
The parameters of the linear-mixed models have been estimated with the maximum likelihood method, and the covariance matrix of the random effects have been estimated with the Cholesky parameterization.
Reporting summary
Further information on research design is available in the Nature Portfolio Reporting Summary linked to this article.