Phenotypic alterations in COVID-19 monocytes
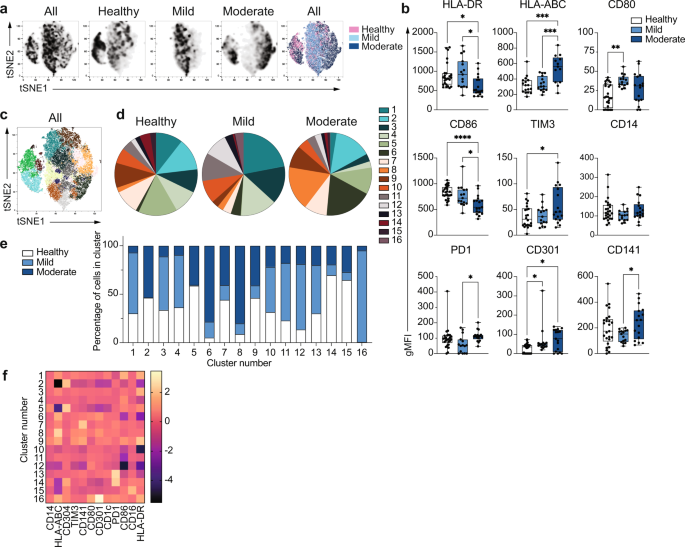
Global alterations in innate immune cell phenotypes have been identified in severe COVID-1911,20,21,22. As the main human monocyte population, we focused on deeply characterizing the ex vivo phenotype of classical CD14+ monocytes in uninfected healthy individuals and patients with COVID-19 presenting with mild or moderate symptoms (1-2 or 3-4 WHO ordinal scale for COVID-19 severity, respectively) during the acute phase of disease (Dataset 1). The battery of markers examined by high dimensional flow cytometry included MHC molecules and costimulatory and coinhibitory receptors (Fig. 1). Dimensionality reduction tools demonstrated that while some overlap in the global phenotypes was observed among the three study groups, monocytes from healthy individuals were clearly distinct from both mild and moderate COVID-19 on a tSNE plot (Fig. 1a, n = 15 individuals per group). In addition, COVID-19 monocytes could be distinguished based on disease severity, with main cell clusters for both disease severity groups mapping separately on the tSNE plots. Moderate COVID-19 monocytes expressed decreased levels of HLA-DR, in agreement with previous reports10,16, but in contrast, they displayed increased expression of HLA-ABC compared to both mild disease and uninfected individuals, suggesting a skewed trend towards class I antigen presentation (Fig. 1b, n = 25 healthy, n = 15 mild and n = 17 moderate COVID-19 patients). In addition, moderate COVID-19 monocytes expressed increased levels of the c-type lectin CD301. The decreased expression of the costimulatory receptor CD86 on moderate COVID-19 monocytes compared to healthy and mild COVID-19 patients, the increased expression of the inhibitory receptors TIM-323 compared to healthy individuals, and PD124 compared to mild COVID-19 monocytes suggest an altered activation profile skewed towards an inhibitory phenotype. In addition, significant differences in the expression of certain markers were found between mild and moderate COVID-19 monocytes. For example, downregulation of HLA-DR and CD86 and upregulation of TIM-3 and HLA-ABC compared to healthy monocytes were only significant in moderate but not in mild COVID-19 monocytes, and the increased expression of CD80 in mild COVID-19 compared to healthy monocytes was not apparent in moderate COVID-19 (Fig. 1b). These results suggest a more profound dysfunction in moderate than in mild COVID-19 monocytes, and they were further confirmed in a second cohort of healthy individuals, mild and moderate COVID-19 patients (Supplementary Fig. 1). Moreover, in agreement with the altered HLA and costimulatory receptor profile of COVID-19 monocytes, we observed an impairment in their capacity to activate SARS-CoV-2-specific CD4+ and CD8+ T cells (Supplementary Fig. 2). Thus, CD14+ monocytes from both mild and moderate COVID-19 patients were able to efficiently activate SARS-CoV-2-specific CD8+ T cells upon UV-inactivated SARS-CoV-2 stimulation. However, only CD14+ monocytes from healthy individuals were able to trigger the activation of SARS-CoV-2-specific CD4+ T cells.
Fig. 1: Unique phenotype of COVID-19 monocytes. a tSNE plots obtained from a concatenated sample consisting of CD14+ classical monocytes from n = 15 healthy individuals, n = 15 mild and n = 15 moderate COVID-19 patients. b Box-and-whisker plots summarizing the median gMFI of the receptors analyzed (n = 25 healthy, n = 15 mild and n = 17 moderate COVID-19 individuals). c tSNE plots depicting the cell clusters identified by Phenograph from the concatenated sample in a. d Pie charts show the fraction of cells within each identified cell cluster in each patient group. e Bar graphs show the distribution (percentage) of cells from each patient group in each identified cell cluster. f Heatmap of the expression of receptors per cell cluster displayed as modified z-scores using median values. One-way ANOVA with Tukey’s correction for multiple comparisons for b. *p < 0.05, **p < 0.005, ***p < 0.001, ****p < 0.0001. Source data are provided as a Source Data file. Full size image
To further define and quantify the phenotypic differences observed between healthy individuals and COVID-19 patients, we applied clustering algorithms using the 12 phenotypic markers previously examined. Cell clustering identified 16 different subpopulations of monocytes that were distinctively distributed in healthy and COVID-19 monocytes (Fig. 1c, d, Dataset 2), with 11 clusters containing more than 88% of the total cells analyzed (Supplementary Fig. 3). Interestingly, expansions of specific monocyte subpopulations were different in mild and moderate COVID-19 monocytes. Thus, statistically significant differences in the size of clusters 1, 3, 4, 6, 8, 11, 12, and 15 were found among clinical groups (Supplementary Fig. 4). In particular, both mild and moderate COVID-19 patients had reduced frequency of clusters 3 and 15 compared to that of healthy monocytes, while moderate patients had a significant increased size of clusters 6 and 8 compared to both mild patients and healthy individuals. Finally, differences in the size of specific clusters were observed between mild and moderate COVID-19 patients. Thus, mild patients had significantly higher frequency of cells in clusters 1, 4, 11, and 12 as compared to both moderate patients and healthy individuals (except for cluster 4, which was only significantly elevated as compared to moderate COVID-19 patients, Fig. 1d and Supplementary Fig. 4). As a consequence, the distribution of cells from healthy, mild and moderate COVID-19 monocytes was clearly different in each cluster, and while some cell clusters were composed of cells from all disease groups, such as clusters 10, 11 and 13, other clusters predominantly contained cells from one or two particular disease groups. For example, clusters 1, 3, 4, 12, and 16 were predominantly composed of cells from mild patients, while clusters 6 and 8 predominantly contained moderate COVID-19 monocytes and were almost absent in monocytes from healthy individuals (Fig. 1e). Normalized expression levels of the markers defining each cluster demonstrated that the phenotype of cluster 6 was mostly driven by downregulation of CD86 and HLA-DR, while that of cluster 8 was mostly driven by the increased expression of HLA-ABC (Fig. 1f). Collectively, these results reveal that distinct populations of circulating monocytes are enriched in mild and moderate COVID-19 patients.
Metabolic dysfunction in COVID-19 monocytes
The fundamental differences in the phenotype of moderate COVID-19 monocytes compared to that of healthy individuals led us to investigate in depth the gene expression profile of ex vivo isolated classical CD14+ monocytes from patients with moderate COVID-19 and compare them with those of healthy individuals (Fig. 2). Principal component analysis (PCA) applied to examine the global distribution of gene expression profiles from COVID-19 monocytes (n = 10) and healthy individuals (n = 6) demonstrated a clear separation between groups along PC1 (Fig. 2a), with genes encoding a number of soluble factors, chemokines and HLA class II molecules as the main genes contributing to the separation between healthy and COVID-19 monocytes (Supplementary Fig. 5). Differential gene expression analysis yielded 422 upregulated and 187 downregulated genes (≥1.5-fold change, FDR < 0.05) in COVID-19 monocytes compared to healthy controls (Fig. 2b). We used these genes to perform a pathway enrichment analysis with XGR25 and pathway annotations from Reactome to gain insight on potential pathways differentially expressed in COVID-19 monocytes (Supplementary Fig. 6 and Dataset 3). Interestingly, pathway enrichment identified glycolysis as the most enriched pathway in COVID-19 monocytes, and also included metabolism of lipids and lipoproteins among the statistically significant pathways (Supplementary Fig. 6). Other significantly enriched pathways included interferon signaling and cytokine signaling, results that are in agreement with previous reports on the role of these two pathways in COVID-19 pathogenesis6,16,22 (Supplementary Fig. 6 and Dataset 3).
Fig. 2: Gene expression signature of COVID-19 monocytes ex vivo. a Principal component analysis of the gene expression data computed from all genes from ex vivo healthy individual (white dots) and moderate COVID-19 (blue dots) monocyte samples. The variance explained by each component is stated in brackets. b Volcano plot of differentially expressed genes for ex vivo COVID-19 vs. healthy monocytes. Genes with fold change ≥1.5 and FDR < 0.05 are shown in red. c Bar plots depict significantly enriched (FDR < 0.05) pathways from Reactome for COVID-19 vs. healthy individual monocytes using upregulated genes (≥1.5 fold increase, FDR < 0.05). Fold enrichment plotted as log 2 (FC) and bars labelled with the adjusted p-value. d Heatmap of significantly upregulated genes in COVID-19 vs. healthy monocyte that are members of the pathways in c. Gene expression values are scaled by row, with relatively high expression indicated in red and relatively low expression in blue. Both rows and columns are clustered using Euclidean distance and Ward’s method. Representative example (e) and summary gMFI (f) of phosphorylated (p)-IRF3 (Ser 396) expression for healthy (n = 14), mild (n = 15) and moderate (n = 10) COVID-19 monocytes. g IFITM2 relative gene expression (to GAPDH) measured by real-time PCR in sorted CD14+ monocytes from healthy individuals (n = 7), mild (n = 7) and moderate (n = 13) COVID-19 patients. Representative example (h) and summary gMFI (i) of IκBα expression in healthy individuals (n = 14), mild (n = 15) and moderate (n = 10) COVID-19 monocytes. Representative example (j) and summary gMFI (k) of pNFκB p65 expression in healthy individuals (n = 14), mild (n = 15) and moderate (n = 10) COVID-19 monocytes. In e, h, and k, numbers in histograms represent the gMFI of healthy (black), mild (light blue), and moderate (dark blue) COVID-19 patients. In f, g, i and k, boxes extend from the 25th to the 75th percentiles and whiskers extend up to the maximum and down to the minimum values. The horizontal line within the boxes represents the median. One-way ANOVA with Tukey’s test for multiple comparisons in f, g, i, and k. *p < 0.05, **p < 0.005. Source data are provided as a Source Data file. Full size image
We subsequently examined the directionality of expression of the enriched pathways by analyzing downregulated genes and upregulated genes separately (Fig. 2c). Pathway enrichment analysis of genes significantly upregulated (≥1.5-fold change, FDR < 0.05) in COVID-19 compared to healthy individuals demonstrated a significant increase in the metabolism of a number of lipids, including sphingolipids, phospholipids, and lipoproteins. Other upregulated pathways in COVID-19 monocytes included interferon signaling, cytokine signaling, and transmembrane transport of small molecules (Fig. 2c). Heatmap showing the top 40 upregulated genes from the enriched pathways demonstrated a somewhat variable expression patterns among COVID-19 monocytes and included a number of type I interferon-stimulated genes (IFI27, IFITM2, IFI6, IFITM3, MX1), metabolic enzymes (ASAH1, CYP27A1, SGPP2, SPHK1) and others (Fig. 2d). Of note, the highest expressed IFN-related gene was IFI27, which has been suggested as a biomarker of early SARS-CoV-2 infection26. The increased type I IFN gene signature in COVID-19 monocytes was confirmed by the increased ex vivo phospho-IRF3 protein expression in moderate COVID-19 patients compared to healthy individuals (Fig. 2e, f) and by the increased expression of IFITM2 as an IFN-stimulated gene, measured by real-time PCR in an expanded cohort of mild and moderate COVID-19 patients that included samples from those individuals whose monocytes were subjected to RNA-seq (n = 6 healthy individuals and n = 10 moderate COVID-19 patients) plus additional samples of healthy individuals (n = 1), mild (n = 7) and moderate patients (n = 3, Fig. 2g). NFκB activation was examined ex vivo indirectly by IκBα expression (Fig. 2h, i) and directly by phosphorylation of the p65 NFκB subunit (Fig. 2j, k), as a readout for cytokine signaling27,28. While monocytes from mild COVID-19 patients displayed a decrease in the expression of IκBα compared to that of healthy individuals (Fig. 2i), monocytes from moderate COVID-19 patients did not. Furthermore, neither mild nor moderate COVID-19 monocytes displayed an increased expression of phospho-p65 NFκB (Fig. 2k). This observation suggests that other additional mechanisms may be regulating the activation of NFκB, and that NFκB-driven cytokine responses may be altered in patients with COVID-19, in agreement with the lack of increased pro-inflammatory cytokine expression by COVID-19 monocytes (Fig. 2c, Dataset 4) and with previous single cell transcriptomic data of acute COVID-19 PBMC29. Moreover, several of the genes contributing to the “Cytokine signaling” pathway enrichment (Fig. 2c) were interferon-stimulated genes (Dataset 4).
We subsequently selected the set of significantly downregulated genes in COVID-19 monocytes (≥1.5 fold decrease, FDR < 0.05) to perform pathway enrichment (Fig. 3). The only pathway that was significantly downregulated in COVID-19 monocytes was glycolysis (Fig. 3a and Dataset 5), with decreased expression of a number of enzymes involved in glucose degradation, including PFKP, ENO1, PFKB4 and others (Fig. 3b). This metabolic profile with increased metabolism of lipids (Fig. 2c) and decreased glycolysis was unexpected, as glycolysis is an important driver of innate immune cell function during the recognition of pathogens30. To confirm these gene expression data, we used SCENITHTM31 to metabolically profile CD14+ monocytes from COVID-19 patients and healthy controls ex vivo. SCENITHTM uses protein synthesis as a measurement of global metabolic activity. Puromycin incorporation is used as a reliable readout of protein synthesis levels (and therefore metabolic activity) in vitro and in vivo. In agreement with the pathway enrichment results, ex vivo puromycin incorporation was significantly decreased in moderate COVID-19 monocytes (Fig. 3c, d) compared to healthy individuals, suggesting decreased metabolic activity. Moreover, the glycolytic capacity of COVID-19 monocytes was significantly decreased in moderate patients and correlated with disease severity (Fig. 3e), and this was accompanied by a concomitant increase in mitochondrial dependency in monocytes from moderate COVID-19 patients (Fig. 3e). The decreased metabolic activity and glycolytic capacity were further confirmed by Seahorse analysis of extracellular acidification rate (ECAR) and oxygen consumption rate (OCR) as readouts for glycolysis and oxidative phosphorylation, respectively (Fig. 3f).
Fig. 3: Altered expression of glycolysis-related genes in COVID-19 monocytes ex vivo. a Bar plots depict significantly enriched (FDR < 0.05) pathways from Reactome for COVID-19 vs. healthy individual monocytes, using downregulated genes in COVID-19 vs. healthy (≥1.5 fold decrease, FDR < 0.05). The fold enrichment is plotted on the x-axis as log 2 (FC) and the bars labelled with the adjusted p-value. b Heatmap of the significantly downregulated genes in COVID-19 vs. healthy monocytes that are members of the pathways in i. Gene expression values are scaled by row, with relatively high expression indicated in red and relatively low expression in blue. Both rows and columns are clustered using Euclidean distance and Ward’s method. Representative example of ex vivo expression of puromycin in CD14+ monocytes measured by flow cytometry (c) and summary (d) of puromycin gMFI on healthy individuals (n = 10), mild (n = 8) and moderate (n = 10) COVID-19 monocytes (right). e Glycolytic capacity and mitochondrial dependency of monocytes from healthy individuals (n = 10), mild (n = 8) and moderate (n = 10) COVID-19 ex vivo. f Basal extracellular acidification rate (ECAR) and basal oxygen consumption rate (OCR) measured in sorted CD14+ monocytes from healthy individuals (n = 3) and COVID-19 patients (n = 4). The data in d, e, and f are shown as mean ± s.e.m. One-way ANOVA with Tukey’s test for multiple comparisons in d and e, and unpaired, two-tailed t-test in f. *p < 0.05, **p < 0.005. Source data are provided as a Source Data file. Full size image
These data suggest that monocytes from COVID-19 patients with moderate disease display a distinct gene expression signature, characterized by an impaired metabolic profile that is accompanied by decreased NFκB activation, and maintenance of an intact type I IFN antiviral response.
COVID-19 monocytes display impaired pathogen sensing ex vivo
The dysfunctional metabolic profile with a downregulation of glycolysis and the defective activation of NFκB, both pathways heavily involved in the activation of canonical innate immune cell functions upon virus encounter28,30, led us to examine the functional capacity of monocytes to sense and respond to SARS-CoV-2 ex vivo (Fig. 4). Upon UV-inactivated SARS-CoV-2 stimulation (106 viral particles per 106 cells for 20 h), CD14+ monocytes from healthy individuals displayed a significant increase in both TNF and IL-10 production (Fig. 4a, b). However, COVID-19 monocytes significantly produced less TNF as compared to healthy monocytes, while no differences were observed in IL-10 expression (Fig. 4a, b). The defect in TNF production upon stimulation was not SARS-CoV-2-specific, as stimulation with inactivated common cold coronaviruses (106 viral particles per 106 cells for 20 h) or bacterial lipopolysaccharide (LPS, 100 ng/ml for 20 h) also led to significantly reduced TNF production compared to monocytes from healthy individuals (Fig. 4c). In addition, the expression of CD40 (Fig. 4d, e), which is important for monocyte effector function and is upregulated after virus sensing32, was increased in monocytes from healthy individuals but not in COVID-19 monocytes. This decreased expression was confirmed after stimulation with common cold coronaviruses or LPS (Fig. 4f), suggesting that the activation defects in COVID-19 monocytes in response to pathogen sensing were not specific to SARS-CoV-2. In addition to CD40, we also examined the expression of other cell surface receptors involved in antigen presentation and activation of T cells (Fig. 4g). HLA-DR expression levels were not further upregulated upon SARS-CoV-2 stimulation in any of the patient groups, and stimulation still maintained the differences in expression observed ex vivo among groups (Fig. 4h). Moreover, while CD80 was significantly upregulated in healthy, mild and moderate COVID-19 monocytes after SARS-CoV-2 stimulation (Fig. 4g, i), only healthy monocytes increased the expression of CD86 after stimulation (Fig. 4j). These results were confirmed in additional in vitro stimulation with isolated CD14+ monocytes (Supplementary Fig. 7).
Fig. 4: Impaired ex vivo pathogen sensing by COVID-19 monocytes. Representative example (a) and summary (b) of TNF and IL-10 production by monocytes from healthy individuals (n = 19), mild (n = 18), and moderate COVID-19 patients (n = 19) after ex vivo stimulation with SARS-CoV-2. c Summary of percentage of TNF- and IL-10-producing monocytes after stimulation with a mixture of heat-inactivated common cold coronaviruses (CCCoV) or LPS in healthy individuals (n = 12 for CCCoV and n = 13 for LPS), mild (n = 21 for CCCoV and n = 18 for LPS) and moderate (n = 12 for CCCoV and n = 19 for LPS) COVID-19 patients. Representative histograms (d) and summary (e) of CD40 expression in healthy individual (n = 20), mild (n = 22), and moderate (n = 16) COVID-19 monocytes stimulated with vehicle (grey) or SARS-CoV-2 (orange). Numbers represent percentage of CD40+ monocytes relative to vehicle-stimulated cells. f Summary of percentage of CD40+CD14+ cells after stimulation with CCCoV or LPS in healthy individuals (n = 17 for CCCoV and n = 14 for LPS), mild (n = 18 for CCCoV and n = 22 for LPS) and moderate (n = 13 for CCCoV and n = 10 for LPS) COVID-19 patients. Representative histograms (g) and summary gMFI of HLA-DR (h), CD80 (i) and CD86 (j) expression of CD14+ monocytes from healthy individuals (n = 15), mild (n = 22) and moderate (n = 9) COVID-19 patients stimulated with vehicle (white) or SARS-CoV-2 (CoV2, orange). Lines link paired samples. Representative histogram (k) and summary (l) of monocyte energetic status measured by puromycin expression (gMFI) of monocytes from healthy individuals (n = 10), mild (n = 8) or moderate (n = 10) COVID-19 patients stimulated with vehicle (open bars) or LPS (striped bars). Glycolytic capacity (m) and fatty acid and amino acid oxidation capacity (n) of CD14+ monocytes from healthy individuals (n = 7), mild (n = 4), and moderate (n = 9) COVID-19 patients stimulated with LPS. The data in b, c, e, f, l, m and n are shown as mean ± s.e.m. One-way ANOVA with Tukey’s correction for multiple comparisons in b, c, e, f, m and n. Two-way ANOVA with Tukey’s correction for multiple comparisons in h, i, j and l. *p < 0.05, **p < 0.005, ***p < 0.001, ****p < 0.0001. Source data are provided as a Source Data file. Full size image
The apparent unresponsiveness of COVID-19 monocytes to pathogen sensing was accompanied by altered metabolic reprogramming. Innate immune cells that sense pathogens increase the rate of glycolysis over mitochondrial oxidative phosphorylation to enable fast energy availability33,34,35. However, COVID-19 monocyte energetic profile measured by SCENITHTM did not increase upon LPS stimulation, unlike that of healthy monocytes (Fig. 4k, l). Moreover, when stimulated with LPS, moderate COVID-19 monocytes showed a decreased glycolytic capacity (Fig. 4m) and an increase in fatty acid and amino acid oxidation capacity (Fig. 4n) compared to healthy monocytes, that correlated with a slight but significant decrease in glucose dependency and an increase in mitochondrial dependency compared to monocytes from healthy individuals (Supplementary Fig. 8). These data are in agreement with the enriched metabolic pathways from RNA-seq data (Fig. 2c, h). Seahorse experiments confirmed the defect in glycolysis in stimulated monocytes from COVID-19 patients (Supplementary Fig. 9). In summary, monocytes from COVID-19 patients display a profound defect in pathogen sensing ex vivo that is more evident in moderate than in mild patients and is characterized by an impairment in pro-inflammatory cytokine production, expression of activation-related receptors and metabolic rewiring upon secondary SARS-CoV-2 stimulation.
Pro-thrombotic gene expression signature of COVID-19 monocytes
To globally characterize the gene expression signature of activated monocytes in COVID-19, we performed RNA-seq of isolated monocytes from healthy individuals and patients with moderate COVID-19 stimulated for 20 h with UV-inactivated SARS-CoV-2 as in Fig. 4 (Fig. 5). PCA clearly separated COVID-19 from healthy monocytes, although some healthy monocytes clustered with COVID-19 in the principal component space (Fig. 5a, Supplementary Fig. 10). Quantification of differentially expressed genes yielded 1,437 upregulated and 2,073 downregulated genes in activated COVID-19 compared to activated healthy monocytes (≥1.5 fold change, FDR < 0.05, Fig. 5b). Pathway enrichment of differentially expressed genes (≥1.5 fold change vs. healthy monocytes, FDR < 0.05) using XGR software and the Reactome pathway database demonstrated a number of expected pathways involved in the innate immune response to pathogens, including type I IFN signaling, cytokine signaling, interactions between lymphoid and non-lymphoid cells, NLR sensing, etc. (Supplementary Fig. 11 and Dataset 6). However, when we focused our analysis on pathways enriched in upregulated genes in activated COVID-19 monocytes compared to activated healthy monocytes, the most significantly enriched pathways were involved in or closely related to hemostasis and coagulation, including integrin signaling, extracellular matrix organization, signaling by PDGF, interactions with activated platelets and general hemostasis (Fig. 5c and Dataset 7). Integrin receptors are used by cells to interact with other cells and with the extracellular matrix, by binding numerous matrix proteins including collagen, actin and laminin, being also involved in hemostasis and platelet aggregation36. In addition, monocytes actively bind to platelets forming pro-thrombotic aggregates in inflammatory and vascular pathologies37,38. Monocytes from COVID-19 patients expressed increased levels of various collagen subunits (COL1A1, PLOD2, COL6A3, COL6A1), enzymes involved in collagen triple helix synthesis (COLGALT1) and a number of matrix metalloproteinases (MMP1, MMP2, MMP14, Fig. 5d), which are not only involved in extracellular matrix remodeling, but they have also been implicated in contributing directly to platelet activation and priming for aggregation39,40. These results are in agreement with the clinical observations of hypercoagulability and acquired coagulopathies in patients with COVID-1941,42,43,44, and suggest that monocytes from moderate COVID-19 patients upregulate a pro-thrombotic gene expression signature upon secondary SARS-CoV-2 sensing.
Fig. 5: Gene expression signature of SARS-CoV-2-stimulated COVID-19 monocytes. a Principal component analysis of all genes from healthy (white) and moderate COVID-19 (blue) monocytes stimulated with SARS-CoV-2. The variance explained by each component is stated in brackets. b Volcano plots of differentially expressed genes for activated COVID-19 vs. activated healthy monocytes. Red shows genes with fold change ≥1.5 and FDR < 0.05. c Bar plots depict the top 10 significantly enriched (FDR < 0.05) pathways for stimulated COVID-19 vs. healthy individual monocytes using upregulated genes (≥1.5 fold increase, FDR < 0.05). Fold enrichment is plotted as log 2 (FC) and bars labelled with the adjusted p-value. d Heatmap of the top 40 significantly upregulated gene members of the pathways in c. e Bar plots depict the top 10 significantly enriched (FDR < 0.05) pathways for stimulated COVID-19 vs. healthy individual monocytes, using downregulated genes (≥1.5 fold decrease, FDR < 0.05), plotted as log 2 (FC) and bars labelled with the adjusted p-value. f Heatmap of the top 40 significantly downregulated genes in stimulated COVID-19 vs. healthy individual monocytes that are members of the pathways in e. g Phospho-IRF3 (Ser 396) expression (fold change to baseline gMFI) for healthy (n = 14), mild (n = 15) and moderate (n = 10) COVID-19 monocytes stimulated with LPS (mean ± s.e.m.). h IFITM2 gene expression (relative to GAPDH) measured by real-time PCR and stimulated monocytes from healthy individuals (n = 14), mild (n = 7), and moderate (n = 23) COVID-19 patients. Boxes extend from the 25th to the 75th percentiles, the horizontal line within the boxes shows the median, and the whiskers extend from the minimum to the maximum values. i Phospho-NFκB p65 (Ser 529) expression (fold change to baseline gMFI) for healthy (n = 14), mild (n = 15), and moderate (n = 10) COVID-19 monocytes stimulated with LPS (mean±s.e.m.). For d and f, gene expression values are scaled by row; red indicates relatively high expression, and blue low expression. Both rows and columns are clustered using Euclidean distance and Ward’s method. Mixed model with Tukey’s post hoc test for g and i. One-way ANOVA with Tukey’s test for h. For g and i, two-way ANOVA with Tukey’s correction for baseline vs. other time points within the same group. *p < 0.05, ***p < 0.001 for healthy individuals, #p < 0.05, ##p < 0.005 for mild COVID-19 patients, $$$p < 0.001 for moderate COVID-19 patients. ****p < 0.0001. Source data are provided as a Source Data file. Full size image
Interestingly, downregulated pathways in stimulated COVID-19 monocytes compared to stimulated healthy donor monocytes included most of the canonical immunological functions expected for innate immune cells upon virus sensing, i.e., interferon signaling, RIG-I/MDA5-mediated induction of interferons, activation of TCR signaling in T cells, innate immune functions and interactions with non-lymphoid cells (Fig. 5e and Dataset 8). The majority of the top 40 genes significantly downregulated in COVID-19 monocytes from these downregulated pathways consisted of different interferons (IFNA1, IFNA2, IFNA14, and IFNB1), interferon-stimulated genes (IFIT3, ISG15, IFIT2, ISG20, IRF7, and MX2) and pathogen-sensing receptors (TLR7, AIM2, Fig. 5f). This gene signature was functionally confirmed by examining the activation pattern of IRF3 in response to LPS in monocytes from healthy individuals and patients with mild and moderate COVID-19 (Fig. 5g). While healthy and mild COVID-19 monocytes significantly increased the expression of the phosphorylated form of IRF3 upon LPS stimulation compared to baseline levels, monocytes from moderate patients did not. This inability to activate IRF3 correlated with decreased expression of the interferon-stimulated gene IFITM2, examined in an expanded cohort of healthy, mild and moderate COVID-19 monocytes after stimulation with SARS-CoV-2 (Fig. 5h). Of note, examination of NFκB p65 activation, as a main transcription factor involved in cytokine signaling in innate cells, demonstrated a defective activation in both mild and moderate COVID-19 as compared to healthy individuals (Fig. 5i).
These findings in COVID-19 monocytes are consistent with an unexpected switch from canonical innate immune functions to a pro-thrombotic phenotype and potential cross-talk with other cells involved in hemostasis, which suggests that activated monocytes may contribute to COVID-19 severity by actively impacting hemostasis and by a reduction in innate immune functions necessary for efficient virus clearance.
Monocytes from COVID-19 patients are functionally pro-thrombotic
In order to functionally confirm the pro-thrombotic gene expression signature of monocytes from COVID-19 we performed in vitro assays to test the capacity of monocytes to form monocyte-platelet aggregates (MPA, Fig. 6), which are an important initiation factor in the generation of thrombi45,46,47. Isolated monocytes from healthy individuals and patients with mild or moderate COVID-19, either unstimulated or stimulated with UV-inactivated SARS-CoV-2 ex vivo, were co-cultured with freshly isolated platelets from a healthy individual to rule out the possibility that differential activation of platelets from healthy individuals and COVID-19 patients would lead to confounding results on the pro-thrombotic capacity of the monocytes. After 20 h of monocyte-platelet co-culture, we measured the generation of MPA by determining the expression of CD41 in monocytes, which is a standard method to identify MPA (CD41 is a marker of megakaryocytes and it is not expressed on monocytes48). Monocytes from patients with moderate COVID-19 aggregated significantly more platelets that those of healthy individuals or patients with mild disease, functionally supporting the pro-thrombotic signature obtained in the RNA-seq analysis (Fig. 6a‒c). Interestingly, the increase in MPA formation was observed after ex vivo stimulation with UV-inactivated SARS-CoV-2 (Fig. 6a, c) but also in ex vivo unstimulated monocytes, which was initially surprising due to the lack of hemostasis-related pathways being significantly enriched in the ex vivo RNA-seq datasets (Figs. 2 and 3). However, upon examination of the RNA-seq analysis from ex vivo unstimulated monocytes, we identified a number of significantly upregulated genes in COVID-19 monocytes compared to healthy individuals that belonged to pathways that included “Hemostasis” and “Platelet activation, signaling and aggregation” (Dataset 4). Enrichment of none of these two pathways was statistically significant when considering the adjusted p-value, but upregulation of the individual genes was, which could be due to the small number of RNA-seq samples and the large number of pathways to adjust the p-value for.
Fig. 6: Monocytes from moderate COVID-19 patients are functionally pro-thrombotic. Monocytes were isolated from healthy individuals, mild and moderate COVID-19 patients, and left unstimulated or stimulated with UV-inactivated SARS-CoV-2 for 20 h. a Representative dot plots of the expression of CD41 on ex vivo isolated (upper row) or stimulated (lower row) monocytes from healthy individuals (left), mild (middle), and moderate (right) COVID-19 patients (n = 4 individuals per group) after co-culture with freshly isolated platelets from a healthy individual. Numbers in each dot plot represent CD41 gMFI. b, c Summary of CD41 gMFI on unstimulated (b) or stimulated (c) monocytes after co-culture with healthy donor platelets (n = 4 individuals in each group). Boxes in b and c extend from the 25th to the 75th percentiles and whiskers extend down to the minimum and up to the maximum values. d RNA-seq datasets from ex vivo isolated monocytes from moderate COVID-19 patients were grouped into low and high D-dimer concentrations. Heatmap of z-score-transformed normalized read counts of significantly upregulated genes in “hemostasis” and “platelet activation, signaling, and aggregation” pathways in healthy (n = 6), low D-dimer concentration (n = 4) and high D-dimer concentration (n = 6) moderate COVID-19 monocytes. Gene expression values are scaled by column, and each row represents one individual. e Summary of normalized gene counts of the genes in d, shown as mean±s.e.m. f RNA-seq datasets from stimulated monocytes from moderate COVID-19 patients were grouped into low and high D-dimer concentrations. Heatmap of z-score-transformed normalized read counts of significantly upregulated genes in “Integrin cell surface interactions”, “Extracellular matrix organization”, “Response to elevated platelet cytosolic Ca2+”, “Signaling by PDGF”, “Hemostasis” and “Platelet aggregation (plug formation)” pathways in healthy (n = 12), low D-dimer concentration (n = 8) and high D-dimer concentration (n = 6) moderate COVID-19 monocytes. Gene expression values are scaled by column, and each row represents one individual. One-way ANOVA with Tukey’s correction for multiple comparisons for b, c, e. *p < 0.05, **p < 0.005. Source data are provided as a Source Data file. Full size image
We subsequently took advantage of the available clinical data of the patients for which RNA-seq analysis of monocytes was performed. For these patients we had information of the plasma concentration of D-dimer at the time of blood collection. D-dimer is routinely used in the clinic as a biomarker for activation of the coagulation and fibrinolysis systems49 and it has been extensively investigated for the diagnosis, monitoring and treatment of venous thromboembolic diseases, for which it is used routinely50. Plasma D-dimer concentration positively correlates with venous thromboembolic diseases in the general population and in patients with COVID-1951. We decided to group samples into high and low plasma D-dimer concentration as a readout of potential thrombotic issues. While most patients whose monocytes were used for RNA-seq had elevated D-dimer concentrations at the time of blood collection (>500 ng/ml, Dataset 9), we could clearly identify two groups of patients: those with D-dimer concentration >1600 ng/ml (High D-dimer, range 1647–20,000 ng/ml) and those with D-dimer concentration <1000 ng/ml (Low D-dimer, range 966–534 ng/ml). We then examined the expression of genes belonging to the pathways potentially associated with hemostasis and coagulation in both ex vivo RNA-seq data and RNA-seq data from stimulated monocytes in healthy individuals from low and high D-dimer COVID-19 groups (Fig. 6d–f).
Using the RNA-seq datasets from ex vivo isolated monocytes, we examined the expression of those genes that were significantly enriched in two pathways: “Hemostasis” and “Platelet activation, signaling and aggregation” (genes and pathways can be found in Dataset 4). In agreement with the increased capacity to form MPAs, we observed an increased expression of genes associated with these pathways in a D-dimer concentration-dependent manner (Fig. 6d). Moreover, while not all genes were significantly upregulated in the high D-dimer group, 10 out of 12 showed a trend toward an increased gene expression as D-dimer concentration increased (Fig. 6e). This observation was specific for these two hemostasis-related pathways, as the trend was not observed when we examined the normalized read counts of those genes enriched in another significantly enriched pathway i.e., “Transmembrane transport of small molecules”, with only 5 out of the 14 enriched genes showing a trend towards a D-dimer concentration-dependent increase in expression (Supplementary Fig. 12).
We also examined the expression (normalized read counts) of those genes enriched in pathways potentially related to a pro-thrombotic signature in RNA-samples from COVID-19 monocytes stimulated with UV-inactivated SARS-CoV-2, again dividing the samples into low and high D-dimer concentrations in plasma (Fig. 6f). The pathways tested were “Integrin cell surface interactions”, “Extracellular matrix organization”, “Response to elevated platelet cytosolic Ca2+”, “Signaling by PDGF”, “Hemostasis” and “Platelet aggregation (plug formation)” (Genes and pathways can be found in Dataset 7; 81 genes in total). Interestingly, while all the genes were significantly upregulated in COVID-19 patients as compared to healthy controls, no differences in their expression were found between the two groups of patients with low and high plasma D-dimer concentration in a heatmap built with z-score transformed normalized gene counts of all the genes within the abovementioned pathways (Fig. 6f). Moreover, heatmaps of individual pathways did not reveal any differences in the expression of the corresponding genes based on plasma D-dimer concentration (Supplementary Fig. 13). This observation suggests that secondary SARS-CoV-2 sensing may switch monocyte phenotype and functionality in a D-dimer concentration-independent manner.
Endotoxin tolerance signature enriched in COVID-19 monocytes
A number of works have suggested similarities between the characteristics of the immune response in COVID-19 patients and those of septic individuals, including multiple organ dysfunction, immunosuppression, coagulopathies and acute respiratory failure52. To determine the similarities between the transcriptional signature of COVID-19 monocytes with that of sepsis monocytes, we utilized publicly available microarray gene expression data on sepsis monocytes and healthy controls53 and we tested the estimated fold changes for correlation with those from our ex vivo (Fig. 7a) and activated (Fig. 7b) COVID-19 and healthy monocytes. The sepsis dataset compared 6 age-matched healthy individuals to 8 adult Gram-negative urinary sepsis patients, with samples taken within 4 h of hospital admission53. No clear correlation was observed in any of the two contrasts, which suggests that the transcriptional signature of CD14+ monocytes in moderate COVID-19 is not similar to that of monocytes in sepsis.
Fig. 7: Endotoxin-induced tolerance signature significantly enriched in COVID-19 monocytes. Correlation plot of sepsis vs. healthy individual gene expression signature and ex vivo (a) or stimulated (b) COVID-19 vs. healthy individual monocyte gene expression signature. Each point represents a gene detected in both the sepsis public microarray dataset and the COVID-19 RNA-seq dataset. The log 2 (FC) between sepsis and healthy controls is plotted against the log 2 (FC) for ex vivo COVID-19 monocytes vs. healthy control monocytes, and the points are colored according to the significance and direction of effect in the COVID-19 contrast (grey, not significant; red, significantly upregulated; blue, significantly downregulated). Correlation plot of endotoxin-induced tolerance gene signature and ex vivo (c) or stimulated (d) COVID-19 vs. healthy monocyte signature. Each point represents a gene detected in both the endotoxin gene signature public dataset and our COVID-19 vs. healthy RNA-seq dataset. The log 2 (FC) between endotoxin tolerance and LPS response is plotted against the log 2 (FC) for COVID-19 vs. healthy monocytes, and the points colored according to the significance and direction of effect in the COVID-19 contrast as in a. Some of the most differentially expressed genes in the COVID-19 vs. healthy monocyte dataset are identified in the plot. e Barcode plot showing enrichment of the endotoxin tolerance (ET) gene set in the differential gene expression results for SARS-CoV-2-stimulated COVID-19 vs healthy monocytes. The ranked test statistics from DESeq2 for the SARS-CoV-2-stimulated COVID-19 vs. healthy contrast are represented by the central shaded bar, with genes downregulated in COVID-19 on the left and upregulated genes on the right. The ranks of the ET gene set within the COVID-19 contrast are indicated by the vertical lines in the central bar. The weights of these genes (log 2 (FC) from the ET gene expression analysis) are indicated by the height of the red and blue lines above and below the central bar. The red and blue lines at the top and bottom indicate relative enrichment of the ET genes (split into genes with positive and negative FCs in the ET contrast) in each part of the plot. Full size image
The lack of cytokine expression, activation of costimulatory receptors, impaired antigen presentation potential and metabolic impairments displayed by moderate COVID-19 monocytes resembled the phenotype observed in LPS-induced tolerance54. We have previously defined an endotoxin tolerance gene expression signature from publicly available microarray data on monocytes stimulated in vitro with LPS55 that comprises 398 genes. Out of these, 318 genes were detected in our RNA-seq dataset. We tested for correlation of the endotoxin tolerance signature with ex vivo (Fig. 7c) and activated (Fig. 7d) COVID-19 monocytes, and while ex vivo COVID-19 monocytes did not display a clear correlation with the tolerance signature, activated COVID-19 monocytes displayed similar directionality of expression in those genes from the tolerance signature that were detected in the dataset. These data were further confirmed in barcode plots (Fig. 7e), showing a statistically significant enrichment of the endotoxin tolerance gene signature in the list of differentially expressed genes from stimulated COVID-19 monocytes compared to healthy controls, for both upregulated and downregulated genes. These data are in agreement with the observed diminished response of COVID-19 monocytes to secondary LPS stimulation in both total PBMC (Fig. 4c, f) and isolated CD14+ monocytes (Supplementary Fig. 14).