Lack of SIRT6 alters gene expression levels in the mouse brain
Brains missing SIRT6 functionality might present changes at multiple levels of molecular organization, from gene expression to metabolism. To explore these changes, we performed transcriptome profiling (RNA-seq) in brains derived from Wild Type (WT, n = 4) and brain-specific SIRT6-knockout (brSIRT6-KO, n = 4) mice (Supplementary Tables 1, 2). In addition, we applied LC–MS techniques to quantify the abundance of 34 metabolites in WT (n = 3) and SIRT6-KO (n = 3) replicates derived from the SH-SY5Y cell line and complemented them with mouse Embryonic Stem Cell (mESC) metabolomics data. Then, we conducted a multilayer bioinformatics analysis of WT and SIRT6-KO transcriptomic and metabolomic profiles (Fig. 1a).
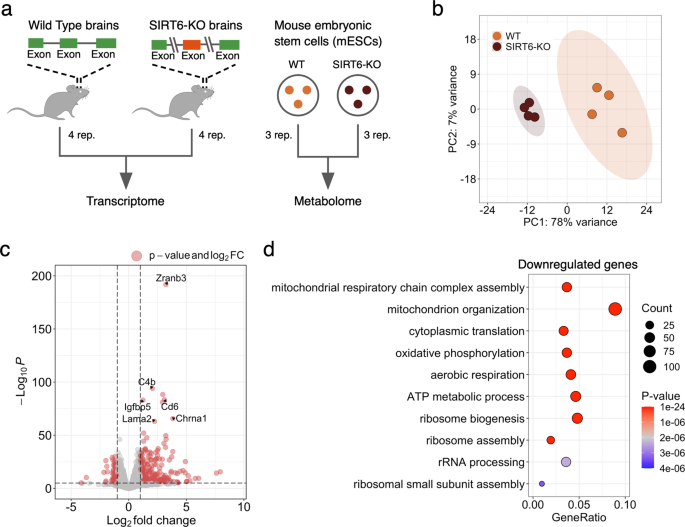
Fig. 1: SIRT6 regulates gene expression levels. a Schematic illustration of the experimental design used in this study. Transcriptome profiles were collected from Wild Type (WT) and SIRT6-knockout (brSIRT6-KO) mouse brain samples. WT and brSIRT6-KO SH-SY5Y metabolomic profiles were complemented with metabolomics data on mouse embryonic stem cells. b Principal Component Analysis (PCA) plot showing separation between WT (orange) and brSIRT6-KO (brown) samples. Orange and brown ovals represent confidence ellipses of WT and brSIRT6-KO groups. c The volcano plot showing up- and downregulated differentially expressed genes in brSIRT6-KO mice compared to WT mice. Red dots indicate significantly changed genes, and gray dots represent insignificant genes. d GO analysis showing the top 10 enriched biological processes for downregulated genes. Each circle corresponds to the enriched GO term and varies in size according to the number of significant genes belonging to this term. The gene ratio represents the number of DE genes belonging to the enrichment categories divided by the total number of genes per category. Full size image
Principal Component Analysis (PCA) of transcriptomic profiles revealed significant changes in gene expression levels between brSIRT6-KO and WT samples with a clear separation by the first principal component explaining 78% of the total variance (Fig. 1b). At the same time, transcriptomic profiles exhibited a high level of intra-group similarity, showing the Pearson’s R > 0.9986 for the WT group and Pearson’s R > 0.9992 for brSIRT6-KO replicates. In contrast, the inter-group Pearson’s R did not exceed 0.9978 (Supplementary Fig. S1a). Differential expression analysis between WT and brSIRT6-KO resulted in 2870 differentially expressed (DE) genes, ~85% of which were annotated as protein-coding sequences (Supplementary Table 3, Supplementary Fig. S1b). Consistent with the expected impaired deacetylase activity of SIRT6 upon knockout, 1481 DE genes exhibited elevated expression levels in brSIRT6-KO samples, while 1389 genes were downregulated (Fig. 1c). The list of top 10 significant features was represented exclusively by upregulated genes, including Zranb3 (FDR p value = 1.32 × 10−192), C4b (FDR p value = 8.8 × 10−95), Cd6 (FDR p value = 4.18 × 10−84), as well as Chrna1 (FDR p value = 2.47 × 10−66) and Lama2 (FDR p value = 9.95 × 10−64) (Supplementary Fig. S1c), which were previously found among the most significant signatures of SIRT6 deficiency in the brains of the full-body KO [24]. These results collectively indicate that SIRT6 deficiency has a major effect on transcriptional regulation in the mouse brain.
We further examined the functional roles of significant DE genes. GO enrichment analysis on upregulated genes revealed enriched terms associated particularly with ‘external encapsulating structure organization’ (FDR p value = 3.7 × 10−08), ‘axon guidance’, and ‘neuron projection guidance’ (FDR p value = 5.42 × 10−08 for both terms) (Supplementary Fig. 1d). Conversely, the list of downregulated features in WT compared to brSIRT6-KO was significantly enriched in genes functionally related to mitochondrial processes (Fig. 1d, Supplementary Table 4): ‘mitochondrial respiratory chain complex assembly’ (FDR p value = 1.21 × 10⁻²⁰), ‘mitochondrion organization’ (FDR p value = 9.05 × 10⁻¹⁹), ‘cytoplasmic translation’ (FDR p value = 5.06 × 10⁻¹⁷), and ‘oxidative phosphorylation’ (FDR p value = 6.60 × 10⁻¹⁷). Overall, our findings show that SIRT6 deficiency provokes significant gene expression changes in the mouse brain and induces transcriptional dysregulation of mitochondria-related genes.
SIRT6 regulates mitochondrial metabolism
Based on the significant association of DE genes with essential mitochondrial processes, we wondered whether SIRT6 silencing might induce alterations in mitochondrial metabolite levels. To study the role of SIRT6 in mitochondrial metabolism, we examined the differential metabolite abundance patterns in SIRT6-KO untargeted LC–MS profiles compared to WT in the mouse embryonic stem cells data (Supplementary Table 5). Similar to RNA-seq results, we observed a global difference between the abundance levels of WT and SIRT6-KO metabolite profiles, underlined by their clear separation by PC1 in the PCA plot (Fig. 2a). Differential abundance (DA) analysis revealed that 92 out of 235 metabolomic features (~39%, FDR < 0.05 and |log 2 (Fold Change)| > 0.58) changed significantly between experimental conditions (Fig. 2b), including Ascorbic acid (upregulated), Maleic acid (downregulated), and NAD+ (downregulated) as the most significant metabolites (Supplementary Fig. S2a, b). Consistent with the transcriptome analysis, we found a number of DA features related to mitochondrial energy system pathways. Several metabolites associated with catabolic processes were more abundant in the SIRT6-WT group compared with SIRT6-KO: four metabolites (Malic acid, Fumaric acid, Oxoglutaric acid, Thiamine Pyrophosphate) associated with TCA cycle and three metabolites (NAD+, NADH, ADP) associated with OXPHOS (Fig. 2c). The same tendency was observed for other DA metabolites related to the energy and carbohydrate metabolic pathways, of which only four metabolites were upregulated, while the rest fourteen were decreased in SIRT6-KO. In addition to these results, we found abundant alterations of metabolomic features that constitute the Lipid and Amino Acid metabolism pathways. Thus, our results show that SIRT6 silencing alters cellular and mitochondrial metabolism.
Fig. 2: SIRT6 deficiency triggers an abundance of energy metabolites. a PCA plot showing separation between the WT (orange circles) and SIRT6-KO (brown circles) groups based on the mESC metabolomic profiles. Orange and brown ovals represent confidence ellipses of WT and SIRT6-KO groups. b The volcano plot illustrating differentially abundant metabolites detected between WT and SIRT6-KO mESC samples. Up- and downregulated metabolites are represented by red and blue circles, respectively. The pie plot (on the right) demonstrates the number of upregulated (red), downregulated (blue), and insignificant (gray) metabolites in the analysis. c The abundance heatmap of 68 out of 92 significant metabolites classified according to the metabolic pathways they are involved in. Full size image
SIRT6 deficiency leads to impaired oxidative phosphorylation
Furthermore, we focused on the significant DE mitochondrial genes that affected mitochondrial pathways. SIRT6 deficiency resulted in 256 significant DE mitochondria-related genes out of 1140 genes with confirmed mitochondrial localization according to the MitoCarta database [36] (Fig. 3a). Importantly, downregulated genes constituted the majority (>91%) of all DE mitochondria-related genes. Of note, protein levels of one of the most significantly downregulated genes (Cycs, FDR p value = 3.00 × 10⁻¹⁹) were consistently decreased in both male and female SIRT6-KO brains (Supplementary Fig. S3a, b). On the contrary, both expression and protein levels of Vdac1 changed insignificantly between female WT and SIRT6-KO samples but showed a reduction in protein levels in male SIRT6-deficient brains (Supplementary Fig. S3a, b). Interestingly, we found that mitochondrial genes were overrepresented in their localization at the Mitochondrial Inner Membrane (MIM) compartment (Fig. 3b, Supplementary Fig. S3c). Given that MIM serves as a springboard for ATP synthesis, we hypothesize that significant mitochondria-related genes should be mostly associated with electron transport chain complexes. To explore biological functions related to DE mitochondrial genes, we performed GO enrichment analysis using information about mitochondrial pathways obtained from MitoCarta as a specific background. The top enriched categories included terms associated with mitochondrial respiratory chain complexes and mitochondrial ribosomes (Fig. 3c). Mitochondrial Complex I turned out to be the most affected by SIRT6 depletion (FDR p value = 1.09 × 10−07), with 27 downregulated out of 43 genes encoding this Complex. Of note, 57 out of 99 genes encoding the electron transport chain subunits were differentially expressed in our analysis. But only Succinate dehydrogenase complex flavoprotein subunit A gene (Sdha) demonstrated an elevated level of expression (Fig. 3d). Also, we confirmed that these changes also occur in brain RNA-seq samples of two human donors from Allen Brain Atlas [37], where the correlation between the expression of SIRT6 and the expression of OXPHOS-related genes is significantly stronger (p value = 0.000636 and p value = 0.000002, respectively) compared to other mitochondria-related genes (Supplementary Fig. S3d).
Fig. 3: OXPHOS impairment in SIRT6-KO. a Number of significant DE genes associated with mitochondrial functions in WT compared to SIRT6-KO. Red and blue bars show the number of up- and downregulated genes. b Percentage of significant (red bars) and insignificant (gray bars) genes across mitochondrial compartments. ‘IMS’ denotes intermembrane space, ‘MIM’ denotes mitochondrial inner membrane, and ‘MOM’ corresponds to the mitochondrial outer membrane. Black asterisks indicate the statistical significance of the enrichment (p value = 5.5 × 10−04, hypergeometric test). c Overrepresented mitochondrial pathways for WT compared to SIRT6-KO. The statistical significance threshold of 0.05 (hypergeometric test) is shown by a black dashed line. d Schematic illustration of the ratio between the number of significant DE genes associated with Cytochrome C oxidase and I–V complexes of the electron transport chain and the total number of genes per complex. Down- and upregulated genes are marked by blue and red colors, respectively. e Mitochondrial membrane potential measured in SH-SY5Y WT and SIRT6-KO cells under treatment with FCCP (10 µM), Hydrogen peroxide (800 nM), Rotenone (200 nM), Oligomycin (20 µM), and without treatment. Asterisks indicate the level of statistical significance (p < 0.05, t-test). f Mitochondrial ROS detection with MitoSox assay. The histogram shows fluorescence emission distributions measured in WT and SIRT6-KO cells that were non-stained and MitoSox-treated. Distribution of mean fluorescence intensity (MFI) values measured in WT and SIRT6-KO cells that were non-treated (green circles) and MitoSox-treated (red circles). Error bars are mean ± SD, ****p < 0.0001 (n = 3–5). g,h Z-score transformed expression levels of mtDNA genes detected in our RNA-seq experiment. Orange and brown circles represent WT and SIRT6-KO samples, respectively. i Difference in mitochondrial content between WT and SIRT6-KO SH-SY5Y cells. Asterisks indicate the level of statistical significance (p < 0.05, t-test). Full size image
We hypothesized that a global reduction in the expression of OXPHOS genes and electron transport chain (ETC) complex activity in SIRT6-KO models might be accompanied by the corresponding decline in mitochondrial membrane potential ΔѰ. In order to check this hypothesis, we first measured ΔѰ in WT and SIRT6-deficient SH-SY5Y cells stained with TMRE dye. Indeed, SIRT6-KO mitochondria showed a significant 1.21-fold decrease in ΔѰ compared to WT cells (FDR p value = 0.0006, Tukey’s multiple comparisons test, Fig. 3e, Supplementary Table 6). Then, we tested ΔѰ in the same WT and SIRT6-KO cells but treated with an uncoupler of oxidative phosphorylation FCCP. Interestingly, supplementation of FCCP enhanced the reduction effect of ΔѰ upon SIRT6 deficiency, resulting in 1.78-fold decrease of ΔѰ in SIRT6-KO cells (FDR p value = 0.0001, Tukey’s multiple comparisons test). Similar significant changes were observed when inhibitors of individual complexes of the ETC were added to the cells. SIRT6-KO cells with inactivated Cytochrome C complex by hydrogen peroxide showed 1.54-fold reduction in ΔѰ (FDR p value = 0.0001, Tukey’s multiple comparisons test), while mitochondria with inactivated Complex I (rotenone treatment) and ATP synthase (oligomycin treatment) showed the highest level of ΔѰ reduction in SIRT6-KO, in 1.81 and 1.93 times, respectively (FDR p value = 0.0001 in both cases, Tukey’s multiple comparisons test), suggesting higher dependence of SIRT6 for these complexes. Then, we speculated that an elevated ROS production could also accompany observed transcriptional changes of OXPHOS-related genes and ΔѰ reduction upon SIRT6 knockout. Indeed, using MitoSox staining, we detected significantly increased levels of ROS in SIRT6-KO cells compared to WT (Fig. 3f-g). All these results collectively indicate that the mitochondrial oxidative phosphorylation process is markedly impaired in SIRT6-deficient cells.
Lack of SIRT6 results in a reduction of mtDNA gene expression and mitochondrial content
Mitochondrial activity is regulated by both nuclear and mitochondrial DNA encoded genes. Since all mitochondrial-encoded genes are involved in oxidative phosphorylation, we studied the expression changes of these genes in SIRT6-KO brains. In particular, we extracted the expression of fifteen mtDNA genes detected in our RNA-seq data and the direction of their expression changes in WT and SIRT6-KO samples. Four out of these fifteen mtDNA genes were downregulated in SIRT6-KO mice, including statistically significant genes mt-Co3 (FDR p value = 3.8 × 10⁻¹⁸), mt-Rnr2 (FDR p value = 1.1 × 10⁻¹⁴), mt-Rnr1 (FDR p value = 1.0 × 10⁻¹¹), mt-Nd3 (FDR p value = 5.2 × 10−04) (Fig. 3h). In addition, six other mtDNA-encoded genes (mt-Co1, mt-Co2, mt-Atp6, mt-Atp8, mt-Nd1, mt-Cytb) showed a statistically significant reduction in expression (FDR < 0.05), but did not meet log 2 (Fold Change) criterion for significance. Since altered mtDNA gene expression levels might indicate co-directional changes in mitochondrial content, we also measured mitochondrial mass in WT and SIRT6-KO SH-SY5Y cells using the MitoTracker Green assay. Consistent with transcriptional downregulation patterns of mtDNA genes, mitochondrial mass was significantly lower in SIRT6-deficient cells (~21.8% decrease, T-test p value = 0.0087) than in WT cells (Fig. 3i, Supplementary Table 6), which in turn can be a marker of impaired mitochondrial biogenesis or increased degradation.
SIRT6-SIRT3,4 and SIRT6-YY1 axes promote OXPHOS in the brain
Next, we elucidated the mechanism behind the SIRT6-dependent regulation of mitochondrial activity and the oxidative phosphorylation process. First, we explored SIRT3, SIRT4, and SIRT5 genes from the sirtuin family, which encode proteins localized in mitochondria and coordinately impact mitochondrial pathways related to redox homeostasis and cellular metabolism [38]. To determine whether SIRT6 may transcriptionally regulate these genes, we examined their expression patterns upon SIRT6 knockout (Fig. 4a). SIRT3 and SIRT4 were significantly reduced in SIRT6-KO brains (FDR p value = 3.60 × 10⁻¹² and 3.33 × 10−06, respectively). At the same time, the lack of SIRT6 did not substantially affect SIRT5 expression. We further confirmed the positive association between SIRT6 and SIRT3-4 by analyzing publicly available gene expression data in the mouse brain from Zhang et al. [39] (Fig. 4b). SIRT6 expression levels positively correlated with the corresponding expression levels of all mitochondrial sirtuins (Pearson’s R = 0.5, 0.79, 0.71 for correlations with SIRT3, SIRT4, SIRT5, respectively). Then, we focused on SIRT3 and SIRT4 genes, which most significantly changed among mitochondrial sirtuins. To experimentally validate their role in OXPHOS regulation, we assessed the changes in mitochondrial membrane potential ΔѰ in SIRT6-KO SH-SY5Y cells with overexpressed SIRT3 and SIRT4. We found that increased expression of SIRT3 or SIRT4 significantly rescued ΔѰ in SIRT6-deficient cells compared to that in WT cells suggesting their importance for the regulation of oxidative phosphorylation when SIRT6 is absent (Fig. 4c).
Fig. 4: SIRT6-SIRT4 and SIRT6-YY1 axes in mitochondrial regulation. a SIRT3-5 expression levels in transcriptomic profiles of WT and SIRT6-KO mice. Asterisks indicate the statistical significance (FDR p value < 0.05) derived from DESeq2 differential expression analysis. b Spearman’s correlation coefficients of SIRT6 expression profile with expression profiles of mitochondrial sirtuins (SIRT3-5) in the brain RNA-seq data from Zhang et al. [39]. c Mitochondrial membrane potential measured in SH-SY5Y SIRT6-KO cells when SIRT3 or SIRT4 were exogenously overexpressed. SIRT6-KO SH-SY5Y cells were transfected with Flag-CMV, SIRT3-Flag-CMV, and SIRT4-Flag-CMV plasmids. After 48 h, cells were collected and stained with TMRE and Life/dead viability dye and the intensity of fluorescence was measured by CytoFLEX. d Venn diagram showing overlaps between significant mitochondria-related genes from the RNA-seq analysis (orange), YY1 mitochondrial targets (green) and SIRT6 mitochondrial targets (purple). Statistical significance of the overlaps was calculated using the permutation test. e Bar plot showing biological functions along with the number of the mitochondria-related genes overlapped between all datasets presented in (d). f YY1 peaks at SIRT3 promoter in two analyzed ChIP-seq replicates. Full size image
Given that SIRT6 is involved in the regulation of distinct cellular functions, we next wondered whether the transcription regulation of mitochondrial OXPHOS by SIRT6 was specified by a co-regulating transcription factor YY1. We have previously shown that SIRT6 and YY1 functionally interact by forming a complex that regulates several shared target genes [24]. To examine whether they might regulate mitochondrial processes in a coordinated manner, we analyzed two publicly available YY1 ChIP-seq datasets in cortical neurons (GSE128182 GEO accession). We searched for YY1 peaks corresponding to the promoters of mitochondria-related genes. In addition, we compared these peaks with both mitochondria-related DE genes from our RNA-seq analysis as well as with SIRT6 targets involved in mitochondrial regulation derived from public mESC ChIP-seq profiles (GSE65836). As a result, we detected 669 YY1 peaks associated with promoters of mitochondrial genes, including 168 peaks that were localized within 1 kb from the promoters of mitochondrial DE genes and 144 peaks colocalized with SIRT6 binding sites in mESC (Fig. 4d). We also identified only 11 SIRT6 binding sites in the absence of YY1 peaks at mitochondria-related gene promoters, also suggesting a smaller indirect mechanism of mitochondrial regulation by SIRT6.
Interestingly, both YY1 and SIRT6 peaks were overrepresented at the promoters of genes localized in the mitochondrial protein-containing complex (FDR p value = 1.01 × 10−38 and FDR p value = 3.96 × 10⁻¹², respectively) and the mitochondrial inner membrane (FDR p value = 1.82 × 10⁻²⁷ and FDR p value = 2.66 × 10−08, respectively), while YY1 target genes were also enriched for mitochondrial matrix (FDR p value = 3.41 × 10–37) and ATPase complex (FDR p value = 4.34 × 10⁻²²) (Supplementary Fig. S4a, b). Our analysis revealed that the expression of more than 66% of the detected mitochondria-related genes could be regulated by either YY1 or by YY1 and SIRT6 together. Both YY1 and SIRT6 peaks were found within promoters of 41 mitochondria-related DE genes that were also overrepresented (permutation test p value = 5.1 × 10−04) in this overlap compared to non-significant mitochondria-related genes. These genes are also related to OXPHOS, mitochondrial metabolism, and protein import regulation (Fig. 4e, Supplementary Fig. S4c). Besides its coordinated regulatory activity with SIRT6, YY1 can also independently bind to the promoters of mitochondria-related DE genes. In our analysis, it was enriched (permutation test p value = 1.0 × 10−03) at the promoters of such 127 DE genes, including SIRT3 (Fig. 4f), which importance for OXPHOS was shown above. Hence, our analysis suggests that SIRT6 acts as a regulator of mitochondrial functions via the SIRT6-YY1-SIRT3,4 axis.
Neuropathological role of SIRT6 through the prism of mitochondrial deregulation
Sirtuin 6 has been reported to be important in the protection against age-related and neurodegenerative diseases in the brain [18, 23, 40, 41]. Since, in our analysis, we observed a global reduction in the transcriptional level of mitochondrial genes, we explored whether these changes can be linked to pathways of age-associated diseases occurring in the brain. Therefore, we performed the Gene Set Enrichment Analysis (GSEA) based on all genes in our RNA-seq dataset. This analysis revealed 71 significantly affected KEGG pathways (Supplementary Table 7, Supplementary Fig. S5), including ‘Parkinson’s disease’ (FDR p value = 0.015), ‘Huntington’s disease’ (FDR p value = 0.0168), ‘Alzheimer’s disease’ (FDR p value = 0.0169), and ‘Amyotrophic lateral sclerosis’ (FDR p value = 0.0168) pathways (Supplementary Fig. S5). Interestingly, these neurodegenerative disease pathways formed one distinct cluster with ‘Oxidative phosphorylation’ pathway in the enrichment network, showing a large number of overlapping genes between them (Fig. 5a). To address whether the expression changes of mitochondria-related transcripts directly caused the enrichment of these pathways, we retrieved core enrichment genes from the pathways of interest. More than 67% of core enrichment genes in each selected pathway were associated with mitochondrial functions. The highest percentage was detected for Alzheimer’s disease (Fig. 5b). Moreover, the mitochondria-related core enrichment genes exhibited lower mean log 2 (Fold Change) values compared to non-mitochondrial genes in each of the selected neurodegenerative disease pathways.
Fig. 5: SIRT6 silencing triggers neurodegenerative disease pathways and normal brain aging. a Cluster of enriched KEGG pathways obtained using GSEA. Each circle represents an enriched pathway and is colored according to the FDR p value. b Violin plots representing the log 2 (Fold Change) expression for genes with the largest contribution to the GSEA enrichment result per neurodegenerative pathway. c Euler diagram showing ten common downregulated genes between publicly available aging brain gene expression datasets (GSE13120 and GSE48911 accessions in the GEO database) and significantly downregulated mitochondrial genes from this study. d Proposed model of the mitochondrial dysfunction caused by SIRT6 silencing and its involvement in neurodegenerative diseases and normal aging. The figure was generated using the BioRender website. Full size image
Since mitochondrial dysfunction is one of the most stable and crucial hallmarks of normal aging [25, 26, 42], we then compared our downregulated mitochondria-related genes with genes that were previously reported to be signatures of mouse brain aging [43, 44]. As a result, we captured ten downregulated mitochondrial genes that also showed a reduction in their expression levels in both neocortex and hippocampus aging data (Fig. 5c). Notably, this list of commonly downregulated genes included genes related to OXPHOS complexes (Sdhd, Ndufa7, Uqcrq) and mitochondrial protein import machinery (Timm10b). Another interesting overlapping gene was Uracil DNA Glycosylase (Ung), which has an important role in mitochondrial base excision repair (BER) initiation. Given the limited DNA repair mechanisms in mitochondria, one can expect that the decrease in Ung activity might provoke an accumulation of mutations in mtDNA. Taken together, the findings reported above suggest that the brain lacking SIRT6 expression is characterized by mitochondrial dysfunction (OXPHOS impairment, TCA dysregulation, reduced mitochondrial content and membrane potential) that causes a neurodegenerative-like phenotype and contributes to pathological aging of the brain (Fig. 5d).