Wi-Fi-confirmed attendance
Students’ Wi-Fi connection metadata were archived on the National University of Singapore (NUS) Institute for Applied Learning Sciences and Educational Technology (ALSET) Data Lake. Each time that a student’s Wi-Fi-enabled device associated with the NUS wireless network, the transmission data were logged. Data included the tokenized student identity, the anonymized media access control address used to identify the Wi-Fi-enabled device, the name and location descriptor of the Wi-Fi access point and the start and end time of each Wi-Fi connection. The campus wireless network at NUS comprises more than 6,500 Wi-Fi access points, including coverage of classrooms and lecture halls40. Students’ Wi-Fi connections at these locations were cross-referenced with their course timetables. These time and location data made it possible to identify students who connected to a Wi-Fi router in their classroom during class hours, thereby confirming their attendance.
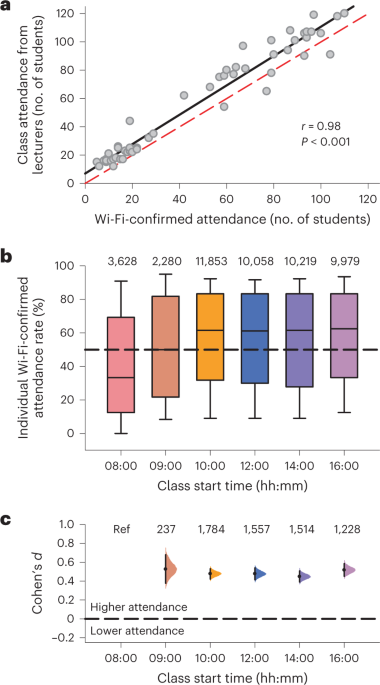
The method of using Wi-Fi connection data to estimate class attendance was validated by collecting attendance data from course instructors. Attendance data were obtained for 53 class sessions across 13 different courses. Instructors who provided attendance data were recruited from a convenience sample of faculty involved in educational research. In each of the class sessions, we determined the number of enroled students with at least one Wi-Fi connection during class. The strength of the linear correlation between instructor-reported attendance and Wi-Fi-confirmed attendance was assessed using Pearson’s correlation analysis (two-sided test; SigmaPlot v.14.5, Systat Software, Inc.).
Wi-Fi-confirmed attendance was investigated over three semesters (2018/19 semester one, 2018/19 semester two and 2019/20 semester one) using all available data on the ALSET Data Lake before the COVID-19 pandemic. We decided to focus on large lecture courses because we expected that students would be more likely to skip these classes compared with other types of courses that are smaller and more interactive. Absenteeism is less likely to be noticed or tracked in larger lecture courses, and in-class participation is not a key element of most lecture courses. Hence, students may be more willing to skip these classes in favour of their preferred sleep/wake schedule or personal interests. Courses were considered for the analysis if: (1) they were categorized as a lecture course according to the NUS timetable, (2) they were held once per week, (3) they were held at least seven times over the 13-week semester (half-semester courses were excluded), (4) they lasted 2 h per session and (5) they had at least 100 students enroled in the course. The rationale for these criteria was to ensure that comparable types of courses were included in the analyses across different class start times. The weekly 2-h format is the most common for lecture courses at the university, and setting a cut-off of 100 students per course ensured that classes took place in one of the lecture halls. Among the 436 courses that met these criteria, 71 were excluded because of missing or incomplete Wi-Fi connection data or inconsistencies with the class timetable (for example, cancelled or rescheduled classes). The remaining 365 courses were sorted by their start time, and data were analysed only for those start times in which there were at least five courses per semester to ensure that we had sufficient data to make meaningful comparisons between class start times (08:00, 21 courses; 09:00, 18 courses; 10:00, 89 courses; 12:00, 67 courses; 14:00, 72 courses; and 16:00, 70 courses). The final dataset included 337 courses and 23,391 unique students. Demographic characteristics of students are provided in Supplementary Table 1. The average class size (number of students enroled in the course) in the dataset was 193 ± 73 students (mean ± s.d.) and class size did not differ between lecture start times (one-way analysis of variance: F(5,331) = 0.91, P = 0.476). The Wi-Fi-confirmed attendance rate for each student was determined in each of the 337 courses. In a given course, this was calculated as the number of lectures in which a student was detected by Wi-Fi, divided by the total number of lectures held during the semester (Extended Data Fig. 1).
LMS data
Students’ interactions with the university’s LMS were analysed over five semesters (2016/17 semester two, 2017/18 semester one, 2017/18 semester two, 2018/19 semester one, 2018/19 semester two) using all available data on the ALSET Data Lake. The diurnal time courses of logins were analysed separately in each semester by sorting the data according to each student’s first class start time of the day. For a given semester and class start time, the total number of logins per 5-min bin was summed across all students starting from 19:00 on the previous evening until 19:00 in the evening of the day on which the class took place (288 epochs per day) (Supplementary Methods). Analyses were restricted to the most frequent class start times at NUS for which we also had sufficient actigraphy data to make comparisons (08:00, 09:00, 10:00, 11:00, 12:00, 14:00 and 16:00). Data were also analysed on non-school days, corresponding to weekends and weekdays with no scheduled classes. The aggregated time series data allowed us to compare students’ diurnal login behaviour by their first class of the day and relative to days with no classes. The dataset comprised 17.4 million logins from 39,458 students. Students’ demographic characteristics are provided for each semester in Supplementary Table 1.
The time courses of logins in each semester were used to derive the offset and onset of LMS login activity. These parameters were determined using a threshold crossing method. The LMS activity threshold was calculated as 50% of the average normalized number of logins per bin (1 bin/288 bins × 0.5 = 0.001736 or 0.17%) (Supplementary Methods). Therefore, the LMS login offset was defined as the clock time when the normalized number of logins dropped and remained below the 50% threshold, and the LMS login onset was defined as the time point when logins exceeded and stayed above the 50% threshold (Extended Data Fig. 3). The LMS inactive period was defined as the duration of time from the LMS login offset to the LMS login onset. The midpoint of the LMS inactive period was also calculated between the LMS login offset and onset.
Actigraphy study
NUS undergraduates aged 18–25 years were recruited to take part in a 6-week research study of their sleep–wake patterns during the school term. Participants were required to be non-smokers in good general health with a body mass index between 18.5 and 27.0 kg m−2. Individuals were ineligible if they reported shift work (paid work between 23:00 and 07:00) or if they planned on travelling across time zones during the study. Participants wore an actigraphy watch (Actiwatch Spectrum Plus or Actiwatch 2; Philips Respironics Inc.) on their non-dominant hand (Supplementary Methods) and made weekly visits to a classroom to have their data downloaded and to undergo a set of neurobehavioural tests (results not reported here). Among 202 undergraduate students who enroled in the study, 13 participants withdrew before the end of the data collection period (no longer available, n = 6; personal reasons, n = 5; falling ill, n = 2) and 5 participants were withdrawn from the study by the researchers for not complying with study procedures (for example, not wearing the actigraphy watch or not showing up on time for appointments). In the remaining 184 participants who wore the actigraphy watch for 6 weeks, two individuals were excluded because of poor quality data and one individual failed to provide his course timetable with his class start times. The dataset included 181 student participants with 7,329 nocturnal sleep recordings (range, 27–42 d per individual). The sample comprised students aged 21.3 ± 1.5 years (mean ± s.d.), including 115 women (63.5% female) and 162 Chinese (89.5%) enroled across four class years (number of students: first-year, n = 57; second-year, n = 59; third-year, n = 29; fourth-year, n = 35; missing data, n = 1). No statistical methods were used to predetermine the sample size for the actigraphy study but our sample size was similar to an earlier actigraphy study in high school students that compared sleep behaviour between different school start times25.
Actigraphy data were collected in 30-s epochs and analysed using Actiware software (v.6.0.9) (Supplementary Methods). The primary sleep variables were: (1) sleep onset, (2) sleep offset, (3) nocturnal total sleep time, (4) nocturnal time in bed for sleep and (5) midpoint of the sleep period. Each student’s actigraphy data were sorted by his/her first class of the day, and we restricted our analyses to class times in which there were at least 20 individuals whose first class of the day started at that time (08:00, n = 103; 09:00, n = 61; 10:00, n = 123; 11:00, n = 35; 12:00, n = 107; 14:00, n = 71; 16:00, n = 44). The cut-off of at least 20 students per class start time was chosen to ensure that we had enough participants to make meaningful comparisons between groups. The dataset comprised 3,701 nocturnal sleep recordings on school nights (at least one class occurred on the following day) and 3,129 nocturnal sleep recordings on non-school nights (no classes on the following day).
The frequency of instances in which students failed to wake up in time for class was evaluated by pooling data across participants for a given class start time. Two-sided chi-squared tests (SigmaPlot v.14.5, Systat Software, Inc.) were used to test for differences across class start times in the frequency of: (1) waking up after the start of class; and (2) waking up too late to reach class on time, which took into account travel time to reach school. The latter was assessed using the question ‘How long does it usually take for you to get from your residence to your first class of the day?’. The dataset comprised 6,546 sleep offset values from 174 participants who reported their travel time (start time of first class, number of sleep offset values: 08:00, 776 values; 09:00, 468 values; 10:00, 940 values; 11:00, 169 values; 12:00, 631 values; 14:00, 389 values; 16:00, 164 values; no class, 3,009 values).
The frequency of school days with naps was evaluated by pooling data across participants for different class start times. Naps were included in the analysis only if they were documented in a student’s daily diary and verified by their actigraphy record. A two-sided chi-squared test (SigmaPlot v.14.5, Systat Software, Inc.) was used to test for differences across class start times in the frequency of naps. The dataset comprised 336 school days with at least one nap (start time of first class, number of days with naps, number of days without naps: 08:00, 88 nap days, 716 non-nap days; 09:00, 50 nap days, 436 non-nap days; 10:00, 113 nap days, 889 non-nap days; 11:00, 18 nap days, 157 non-nap days; 12:00, 45 nap days, 633 non-nap days; 14:00, 14 nap days, 388 non-nap days; 16:00, 8 nap days, 162 non-nap days).
We tested whether population-derived LMS login parameters can reliably predict sleep behaviour in the average student by performing Pearson’s correlation analysis (two-sided test; SigmaPlot v.14.5, Systat Software, Inc.). Direct comparisons between individual observations were not possible because actigraphy-derived sleep parameters were measured in individual students (n = 181), whereas LMS-derived parameters were calculated for individual semesters (five consecutive semesters). We therefore computed average values for actigraphy parameters (averaged across participants) and LMS parameters (averaged across semesters) for each class start time (08:00, 09:00, 10:00, 11:00, 12:00, 14:00, 16:00 and non-school days) and entered these values into the correlation analysis (sleep onset versus LMS login offset; sleep offset versus LMS login onset; nocturnal total sleep time versus LMS inactive period; nocturnal time in bed for sleep versus LMS inactive period; midpoint of sleep versus midpoint of LMS inactive period). Pearson’s correlation analysis was also used to test for associations between sleep and LMS login behaviour on school days relative to non-school days (Δsleep onset versus ΔLMS login offset; Δsleep offset versus ΔLMS login onset; Δnocturnal total sleep time versus ΔLMS inactive period; Δnocturnal time in bed for sleep versus ΔLMS inactive period; Δmidpoint of sleep versus Δmidpoint of LMS inactive period). The best-fit linear regression line in each analysis was used to calculate the r.m.s.e. (the standard deviation of residuals), which was used to assess how well the LMS parameter predicted the corresponding sleep parameter.
Academic performance
Students’ course grades were analysed over the six semesters for which Wi-Fi connection data and LMS data were available (2016/17 semester two, 2017/18 semester one, 2017/18 semester two, 2018/19 semester one, 2018/19 semester two, 2019/20 semester one). At NUS, students are given a letter grade that is converted to a number for calculating the grade point (A+ or A = 5.0, A− = 4.5, B+ = 4.0, B = 3.5, B− = 3.0, C+ = 2.5, C = 2.0, D+ = 1.5, D = 1.0, F = 0.0). Students earn course credits based on the estimated workload hours per week, and the grade point average represents the cumulative performance weighted by the credits earned in each course. Because a course can have multiple class start times (for example, 10:00 lecture on Monday and 16:00 tutorial on Wednesday), we decided to group data by morning and afternoon courses. Morning courses were defined as having all classes (for example, lectures, tutorials and laboratories) start before 12:00, and afternoon courses were defined as having all classes start at 12:00 or later. Mixed-timing courses were defined as having class meetings in the morning and afternoon. In each semester, we restricted our analyses to students who earned 20 course credits (the mode of the distribution for course credits) to ensure that they had a comparable total workload. This usually corresponded to taking four or five courses concurrently. The final sample included 33,818 unique students, ranging from 9,201 to 11,823 students per semester. Students’ demographic information is provided in Supplementary Table 1. The dataset comprised 275,192 individual course grades.
Statistical models
The associations between class start time with Wi-Fi-confirmed attendance, LMS login parameters, actigraphy-derived sleep parameters and academic performance were examined using linear mixed-effects models (Supplementary Table 2). All models were implemented using the ‘lme4’ (v.1.1-29) and ‘lmerTest’ (v.3.1-3) packages with R statistical software (v.4.2)61,62. Models were fit by restricted maximum likelihood to estimate parameters associated with fixed and random effects. Model assumptions including linearity and normality of residuals were examined using the supplemental ‘redres’ package (v.0.0.0.9) to lme4. Satterthwaite’s method was used to perform two-tailed t-tests for fixed effects. In instances in which there was evidence of a statistically significant association between class start time and the outcome variable (P < 0.05), multiple comparisons between class start times were performed using Tukey’s test using the ‘emmeans’ package (v.1.6.1). Effect sizes were calculated with the ‘dabest’ package (v.0.3.0) using Python v.3.7.8 and R statistical software63.
The association between class start time (08:00, 09:00, 10:00, 12:00, 14:00, 16:00) and Wi-Fi-confirmed attendance was tested using a cross-classified model. Class start time was entered as a fixed effect factor (reference category = 08:00) with course module, school/faculty of enrolment and student included as crossed random effect factors. Covariates in the model included sex (male, female), age in years, ethnicity (Chinese, Indian, Malay, others), country of citizenship (Singaporean, Singapore permanent resident, foreigner), type of residence (on campus, off campus, mix of living on and off campus), students’ class year (Y1, Y2, Y3, Y4, Y5+) and semester (2018/19 semester one, 2018/19 semester two, 2019/20 semester one).
The association between class start time (08:00, 09:00, 10:00, 11:00, 12:00, 14:00, 16:00, no class) and each LMS-derived parameter (login offset, login onset, inactive period, midpoint of inactive period) was tested in separate linear mixed-effects models. Class start time was included as a fixed effect factor (reference category = no class) and semester was included as a random effect factor. Our analyses did not adjust for student-level characteristics (for example, age, sex, ethnicity or class year) or course-level characteristics because LMS login parameters were derived on a per-semester basis for each class start time using data that was pooled across students (that is, LMS login parameters were not determined in individual students or courses).
The association of students’ first class time of the day (08:00, 09:00, 10:00, 11:00, 12:00, 14:00, 16:00, no class) with each actigraphy-derived nocturnal sleep variable (sleep onset, sleep offset, total sleep time, time in bed for sleep, midpoint of sleep period) was tested in separate linear mixed-effects models. Class start time was entered in the model as a fixed effect factor (reference category = no class) with student included as a random effect factor. Covariates included age, sex, ethnicity, students’ class year and semester. Information on students’ citizenship, type of residence, course modules and school/faculty of enrolment were not included in the model because these data were not collected in the actigraphy study.
The association of grade point (individual course grade) with course start times (morning-only, afternoon-only, mix of morning and afternoon) was tested using a cross-classified model. Course start time was entered as a fixed factor (reference category = morning-only) with course module, student’s school/faculty of enrolment and student included as crossed random effect factors. Covariates included sex, age, ethnicity, citizenship, type of residence, students’ class year, semester and the proportion of morning classes that each student had during the semester. In a separate analysis, we tested the association between grade point average and the number of days per week that students had a morning class (0, 1, 2, 3, 4 or 5 d). The grade point average was calculated using all grades that a student obtained during a given semester, irrespective of the times that classes occurred. The cross-classified model included days per week with morning classes as a fixed effect factor (reference category = 0 d per week) with school/faculty of enrolment and student included as random effect factors. Covariates included sex, age, ethnicity, citizenship, type of residence, students’ class year and semester.
Ethics statement
The research complied with all relevant ethical regulations. Permission to analyse university-archived data was obtained from the National University of Singapore (NUS) Institute for Applied Learning Sciences and Educational Technology (ALSET). ALSET stores and links de-identified student data for educational analytics research on the ALSET Data Lake. University-archived datasets included students’ demographic information (age, sex, ethnicity, year of matriculation, country of citizenship, type of residence), course enrolment, Wi-Fi connection data, use of the LMS and grades. Analyses of these data were approved by the NUS Learning and Analytics Committee on Ethics (LACE). University and course characteristics are described in the Supplementary Methods. Students whose university-archived data were included in our study provided informed consent to the NUS Student Data Protection Policy, which explains that their data can be used for research. Analyses of university-archived data were exempt from review by the NUS Institutional Review Board (IRB) because they were performed retrospectively on data that were de-identified to the researchers. Permission for collecting attendance data from course instructors was approved by LACE. Research procedures in the actigraphy study were approved by the NUS IRB and students provided written informed consent to take part in the research. Participants were paid $250 in Singapore dollars for completing the actigraphy study. The research analytical approach was not registered in advance.
Reporting summary
Further information on research design is available in the Nature Portfolio Reporting Summary linked to this article.