Mice
All animal procedures followed animal care guidelines approved by Stanford University’s Administrative Panel on Laboratory Animal Care (APLAC) and guidelines of the National Institutes of Health. Investigators were not blinded to the genotypes of the mice. Male and female wild-type C57BL6/J (JAX 0064) mice were used for most behavioural experiments unless specified otherwise, and all mice were 8–12 weeks old at the time of starting behavioural experiments. Mice were housed in plastic cages with disposable bedding on a standard light cycle with food and water available ad libitum, except when placed on water restriction. When on water restriction, mice were provided with 1 ml of water each day and maintained above 85% of baseline weight. Behavioural experiments were performed during the dark phase.
Molecular cloning
A 685-bp fragment containing the promoter region of the mouse troponin gene was amplified from a wild-type mouse using CGCACGCGTGAGGCCATTTGGCTCATGAGAAGC and CATGGATCCTCTAGAAAGGGCCATGGATTTCCTG primers, cloned upstream of ChRmine-p2A-oScarlet using MluI and BamHI sites in an AAV backbone, sequence-verified and tested for expression in dissociated neonatal cardiomyocytes.
In vitro cardiomyocyte experiments
Dissociated neonatal mouse cardiomyocytes prepared using the Pierce Isolation Kit (Thermo Fisher Scientific, 88289) were transfected with rAAV-mTNT::ChRmine-p2A-oScarlet (1 µl of 8 × 12 viral genomes (vg) per ml in 500 µl of medium). Three to five days after infection, individual cardiomyocytes were identified under a light microscope. Optical stimulation was provided by a Spectra X Light engine at 585 nm (LumenCore) coupled to a Leica DM LFSA microscope and synchronized with video recording at 100 fps using LabView software. Laser power leaving the imaging objective was measured with an optical power meter (Thorlabs PM100D). Videos were analysed for contraction using custom scripts in MATLAB.
In vivo systemic viral delivery
Wild-type mice aged three to four weeks were anaesthetized with isoflurane and rAAV-mTNT::ChRmine-p2A-oScarlet (2 ×10¹¹ vg per mouse) or vehicle was delivered by retro-orbital injection. Our selected titres were previously used for systemic viral transduction of ChR2 in the heart26. A total volume of 60 µl 0.9% NaCl saline solution was injected into the right retro-orbital sinus using a 28G needle, then allowed to recover on a warming pad before being returned to the home cage.
Optical pacemaker in vivo characterization
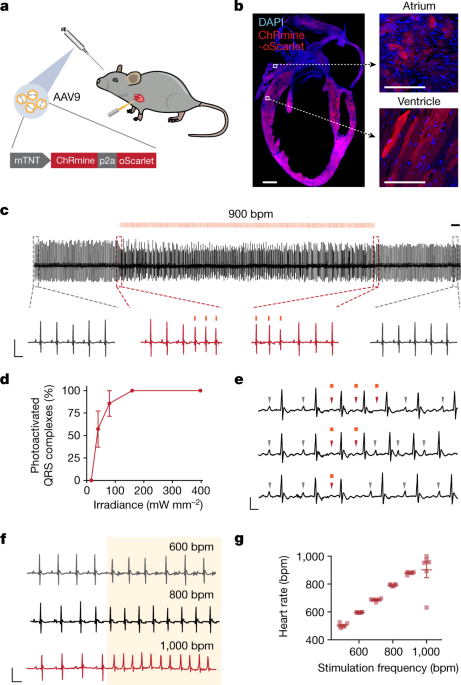
Mice were tested three weeks after injection of the pacemaker virus. Electrocardiography signals were collected using commercial instruments (Rodent Surgical Monitor+, Indus Instruments), with anaesthetized mice placed in a supine position and limbs placed in contact with electrode pads via a conductive gel. A 594-nm laser (LaserGlow) was attached to a fibre-optic patch cord (Thorlabs) terminating in a 200-µm-diameter, 0.39-NA fibre (Thorlabs) which was positioned against the chest. Optical power was adjusted using the laser’s built-in power modulator and measured with an optical power meter (Thorlabs) at the fibre tip. Stimulation was performed with a pulse width of 10 ms and an inter-pulse interval ranging from 120 ms (equivalent to 500 bpm) to 67 ms (900 bpm), controlled by a TTL signal generator (Master-8). Heart rate (bpm) was derived from the heart rate interval between successive R waves (RR interval) obtained from ECG recordings. Fidelity of photoactivated QRS complexes was quantified by counting the number of beats at a set frequency divided by the number of total beats measured during the middle 20 s of a 30-s stimulation period.
Measurements of systolic blood pressure
Mice were anaesthetized (1.5–2% isofluorane) and placed in the supine position with the chest shaved. Systolic blood pressure measurements were performed using a 1.4-F pressure sensor mounted Millar catheter (SPR-671, ADInstruments) and recorded using LabChart 7 Pro (ADInstruments). The catheter was inserted via the right carotid artery into the left ventricle. A 589-nm laser was used to deliver 240 mW mm−2 light across intact chest at either constant or intermittent (500 ms ON, 1,500 ms OFF) optical stimulation at 900 bpm with a 10-ms pulse width for 30 s to assess optogenetic pacing effects on systolic blood pressure in real time.
Wearable optical pacemaker hardware
Custom-made wearable optical stimulators were constructed using 3 × 4.5 mm 591-nm PC Amber Rebel LEDs (Luxeon LXM2-PL01-0000). 30AWG flexible silicone wire (Striveday) was soldered to the LED pad and coated with electrically insulating, thermally conductive epoxy (Arctic Alumina), and adhered to copper sheet cut to 10 × 15 mm for thermal dissipation and subsequently glued to a fabric vest designed for freely moving mouse behaviour (Coulbourn A71-21M25). Wiring was held in place on the vest using hot glue and the free ends were inserted into a breadboard for stimulus control by an LED Driver (Thorlabs LEDD1B T-Cube). The optical power was set to 160–240 mW mm−2 measured from the surface of the LED. Light was delivered at intervals consisting of a 10-ms pulse width at 15 Hz (900 bpm) for 500 ms with 1,500 ms OFF time by using either a Master-8 or an Arduino microcontroller synchronized to behaviour recording software. Computer-aided design schematics were created with Onshape. Thermal measurements were performed using a FLIR C2 Compact thermal camera (FLIR) and the thermal profile at the surface of the micro-LED is plotted in Extended Data Fig. 4c.
Freely moving behaviour with pacemaker
All mice were habituated to the experimenter and handled for at least three days, and in addition allowed to acclimatize to wearing optical pacemaker hardware for at least five days, before behavioural experiments. Fur over the chest was removed (Nair) at least five days before behavioural experiments. Mice were briefly anaesthetized with isoflurane before the placement of the optical pacing vest and allowed to fully recover in the home cage (at least 1 h) before experiments. We used a stimulation protocol consisting of a 10-ms pulse width at 15 Hz (900 bpm) with 500 ms ON time and 1,500 ms OFF time to introduce intermittent tachycardia or 10-ms pulse width at 11 Hz (660 bpm) with a Poisson distribution to introduce increased heart rate variability. Mice received optical stimulation during the ON periods of the behavioural assay from the wearable micro-LED device in both control and ChRmine cohorts. No statistical difference in behaviour was observed between virally transduced and control groups at baseline, suggesting that there were no side effects from transgene delivery. No statistical difference in behaviour was observed in control groups before, during and after optical stimulation, suggesting that there were no effects from light delivery alone.
RTPP
Mice were placed in a custom-built RTPP chamber (30.5 × 70 cm) on day 1 to determine their baseline preference for each side of the chamber. Behavioural tracking was performed using blinded automated software (Noldus Ethovision). On day 2, mice were stimulated whenever they were on one side of the chamber. Stimulation sides were randomly assigned and counterbalanced across mice. Each session lasted 20 min.
EPM
The EPM was made of grey plastic (Med Associates). Mice were gently placed in the closed arm of the EPM. Mice were allowed to freely explore the maze for a 5-min baseline ‘off’ period, followed by a 5-min ‘on’ period during which optical stimulation was delivered, and finally a 5-min ‘off’ period. Behavioural tracking was performed using blinded automated software (Noldus Ethovision) and the overall time spent in open arms was reported for each epoch.
OFT
Mice were placed in a 60 × 60-cm arena and allowed to freely explore during a 9-min session. Optical stimulation was delivered during the middle 3-min epoch. Movement was tracked with a video camera positioned above the arena. To assess anxiety-related behaviour, the chamber was divided into a peripheral and centre (48 × 48 cm) region.
Operant lever-pressing task
Water-restricted mice were trained to lever press for a small water reward (around 10 μl water) while freely moving in an operant condition box containing a single retractable lever and a shock grid floor (Coulbourn). Mice were allowed to retrieve a maximum of 50 rewards per day, and sessions were terminated after all rewards had been retrieved or after 30 min. After each lever press, the lever was retracted for 5 s before extending again. After mice retrieved 50 rewards for at least 3 consecutive days (typically 2–3 weeks of training), they were allowed to proceed with stimulation experiments. On shock days, mice were given a 1-s, 0.1-mA foot shock after 10% of lever presses instead of water. Shocks were delivered in a pseudorandom order on lever-press trials 5, 13, 24, 31 and 44, and the time to the next lever press was measured from the time elapsed for these trials until the subsequent lever press. During stimulation experiments (both baseline and shock days), optical stimulation was delivered throughout the experiment. Water was delivered using a custom set-up consisting of a lick spout (Popper and Sons, stainless steel 18-gauge) and a solenoid (Valcor, SV74P61T1) controlled by a microcontroller (Arduino Uno R3). Licking was monitored using a capacitive sensing board (Arduino Tinker Kit) wired to the lick spout and interfacing with the microcontroller. Shocks were delivered using an 8-pole scrambled shock floor (Coulbourn). Behavioural stimuli—lever presentations and retractions, and shocks—were controlled with Coulbourn Graphic State software. The timing of lever presses and licks was also recorded at 5 kHz using a data-acquisition hardware (National Instruments, NI PCIe-6343-X).
TRAP2 labelling
Fos2A-iCreER (TRAP2; JAX 030323) mice were backcrossed onto a C57BL6/J background and bred with B6;129S6-Gt(ROSA)26Sortm14(CAG-tdTomato)/Hze/J (Ai14; JAX 007908) mice, as previously described38. Both male and female mice were used for TRAP2 labelling experiments. Mice were injected retro-orbitally with rAAV9-mTNT-ChRmine-oScarlet or a vehicle control at three to four weeks of age. Four weeks later, mice were handled and acclimatized to fresh clean cages and optical pacing equipment for at least seven days before labelling. On the day of labelling, mice were allowed to acclimatize to optical pacing equipment for at least 2 h in a fresh clean cage with food and water, stimulated for 15 min (10-ms pulse width at 15 Hz for 500 ms every 1,500 ms) and left undisturbed for 2 h, at which time they were injected intraperitoneally with 5 mg kg−1 4-hydroxytamoxifen (Sigma) dissolved in normal saline containing 1% Tween-80 and 2.5% DMSO (as described previously37,39). Mice were then returned to their home cage and were euthanized at least two weeks later to allow for full expression of the fluorophore.
Whole-brain CLARITY and analysis
Mice were perfused with ice-cold phosphate-buffered saline (PBS) and 4% paraformaldehyde (PFA), then post-fixed in a 1% CLARITY hydrogel solution (1% acrylamide, 0.003125% bis-acrylamide, 4% PFA and 0.25% VA-044 in 1× PBS) for 2 days. Tissue was degassed, polymerized at 37 °C for 4 h and washed with 200 mM sodium borate with 4% sodium dodecyl sulfate solution overnight. Tissue was then electrophoretically cleared for 3–7 days at 80 V (Life Canvas), passively cleared for an additional 2 days, then washed in PBS containing 0.2% Triton-X and 0.02% sodium azide at least 6 times at 37 °C. Cleared samples were refractive-index-matched using RapiClear (Sunjin Labs) and imaged on a custom-built light-sheet microscope62 using a 10× objective and 5-µm step size or an LaVision Ultramicroscope with a 0.63× zoom macro lens with a step size of 5 µm. Images were visualized using Vision4D (Arivis).
For automated whole-brain registration and cell-segmentation analysis, images were loaded onto Arivis Vision4D software, and neurons were segmented using a built-in supervised pixel-based classifier package based on Ilastik63 (‘Trainable Segmenter’). Segmentation masks were converted to binary cell masks. Raw light-sheet microscopes images and cell masks were registered to a common reference space defined by the Allen Institute’s Reference Atlas and analysed in a region-based manner using our MIRACL package40.
Induction of Fos after pacing
Mice were injected retro-orbitally with AAV9-mTNT-ChRmine-oScarlet or vehicle at three to four weeks of age. At four weeks after injection, mice were handled and acclimatized to fresh clean cages and optical-pacing equipment for a minimum of seven days before pacing experiments. On the day of labelling, mice were allowed to acclimatize to optical-pacing equipment for at least 2 h in a fresh clean cage with food and water, stimulated for 15 min and euthanized 30 min after stimulation by perfusion with ice-cold PBS and 4% PFA under heavy anaesthesia. Tissue was post-fixed in 4% PFA on ice for an additional 24 h (brain) before staining and imaging.
In situ hybridization
Post-fixed brains were cut with a vibratome into 65-µm coronal slices. Heart and other organs were sliced at 200-µm thickness. Tissue slices were stored in 70% ethanol at −20 °C. Established protocols for third-generation hairpin chain reaction (HCR) in situ hybridization were used for coronal slice64. In situ hybridization probes (ChRmine, Fos and Slc6a2) were designed by and purchased from Molecular Instruments. Hybridization was performed overnight in hybridization buffer (Molecular Instruments) at 4 nM probe concentration. The next day, slices were washed (three times in wash buffer at 37 °C then twice in 2× SSCT at room temperature; 30 min each) and then incubated in amplification buffer. Dye-conjugated hairpins (B1-647, B3-488 and B5-546) were heated to 95 °C for 1 min and then cooled to 4 °C. Hairpin amplification was performed by incubating individual slices in 50 µl of amplification buffer with B1, B3 and B5 probes at concentrations of 240 nM overnight in the dark. Samples were stained with DAPI, washed three times with 5× SSCT for 30 min each and then equilibrated in exPROTOS (125 g iohexol, 3 g diatrizoic acid and 5 g N-methyl-d-glucamine dissolved in 100 ml deionized water with the refractive index adjusted to 1.458) (ref. 65), a high-refractive-index mounting solution, then imaged. Slices were imaged on a confocal microscope (Olympus FV3000).
Cardiac histology
At 48 h post-fixation, hearts were sectioned into 200-µm slices. For staining, slices were first incubated for 10 min in blocking solution (3% normal donkey serum (NDS) in PBST), followed by primary antibody staining overnight at 4 °C using the following antibodies: anti-vimentin (ab24525), anti-cardiac troponin I (ab188877) or anti-PGP9.5 (ab108986), purchased from Abcam at 1:200 dilution in blocking solution. Slices were then washed twice in PBST, then stained with secondary antibodies (1 mg ml−1) at 1:500 dilution for 3 h at room temperature using the following: F(ab’)2 anti-chicken 488 (703-546-155) and anti-rabbit 647 (711-606-152) purchased from Jackson ImmunoResearch Laboratories. The slices were then stained with DAPI and washed three times with PBST (30 min per wash). Sections were mounted onto slides and mounted with exPROTOS. Slices were imaged on a confocal microscope (Olympus FV3000).
Stereotaxic surgery for optogenetic experiments
For all surgeries, mice were anesthetized with 1–2% isoflurane, and placed in a stereotaxic apparatus (Kopf Instruments) on a heating pad (Harvard Apparatus). Fur was removed from the scalp, the incision site was cleaned with betadine and a midline incision was made. Sterile surgical techniques were used, and mice were injected with sustained-release buprenorphine for post-operative recovery. Mice were allowed to recover for at least two weeks after surgery before behavioural experiments.
For intracranial optogenetic experiments, virus was injected using a 33-gauge beveled needle and a 10-µl Nano-fil syringe (World Precision Instruments), controlled by an injection pump (Harvard Apparatus). Five hundred nanolitres of AAVdj-hSyn::iC++-eYFP or AAVdj-hSyn::eYFP (5×10¹¹ vg ml−1) was injected at 150 nl per min and the syringe was left in place for at least 10 min before removal. The following coordinates were used (relative to Bregma): posterior insula (−0.58 (anterior–posterior (AP)), ±4.2 (medial–lateral (ML)), −3.85 (dorsal–ventral (DV)); mPFC (1.8 (AP), ±0.35 (ML), −2.9 (DV)). Optical fibres (0.39 NA, 200 µm; Thorlabs) were implanted 200 µm above virus injection coordinates. Fibres were secured to the cranium using Metabond (Parkell). Mice were allowed to recover for at least two weeks before behavioural testing.
In vivo electrophysiology
The mice with or without cardiac-targeted ChRmine expression were implanted with custom-made headplates, reference electrodes and cyanoacrylate-adhesive-based ‘clear-skull caps’ as previously described66. After recovery, mice were water-restricted and habituated to head fixation, but they were allowed to drink water to satiate thirst before recording sessions. Craniotomies were made with a dental drill at least several hours before recording sessions and were sealed with Kwik-Cast (World Precision Instruments). Exposed craniotomies before, during and after recordings were kept moist with frequent application of saline until sealed with Kwik-Cast.
Before recordings, the mice were placed into the pacemaker vests and reliable pacing was confirmed by ECG under brief anaesthesia with isoflurane. Then the mice were head-fixed and allowed to recover. Next, one or two (for simultaneous bilateral recordings) four-shank Neuropixels 2.0 probes mounted on a multi-probe manipulator system (New Scale Technologies) and controlled by SpikeGLX software (Janelia Research Campus) were inserted through the craniotomies at variable angles (0–20°) depending on the recording geometry. Typically the probes were aimed to touch the skull around the insula, which could be inferred from probe bending or changes in local field potential, and then were retracted around 100 µm and allowed to sit in place for at least 15 min before recordings. Recordings were performed along each of the four shanks sequentially while mice received 5 s of optical stimulation (900 bpm (15 Hz)) with inter-trial intervals of at least 15–25 s. Probes were cleaned with trypsin between recording sessions. Spike sorting was performed by Kilosort 2.5 and auxiliary software as previously described66.
After recordings, the brains were perfused, cleared, imaged and registered to the Allen Brain Atlas as previously described66. Using the traces of lipophilic dye CM-DiI or DiD (which coated the probes before each insertion) and electrophysiological features, the atlas coordinates of the recorded single units were determined.
The spikes from single units were aligned to pacing onset, and the visualized peri-stimulus time histograms were calculated by subtracting 5 s baseline firing rate, 10 ms binning and 500 ms half-Gaussian filtering. The population-averaged firing rate of each region was calculated by combining z-scores (before filtering) over time for all single units in the region of interest. Specifically, we used hierarchical bootstrap to combine data from multiple levels as previously described66. For each condition, 100 bootstrap datasets were generated, and their mean and s.d. represented the mean and s.e.m. of the initial dataset. For statistical tests comparing ChRmine and control groups, the one-sided P value for the null hypothesis (the ChRmine firing rate subtracted by the control firing rate is zero) was calculated as the fraction of these subtracted values from the pairs of the resampled means (averaged over the time window of interest) that were smaller than zero.
Optogenetic freely moving behaviour
For optogenetic inhibition of iC++, a 473-nm laser (Omicron Laserage) was used to deliver constant light at 2–3 mW measured from the tip. Laser shutters were controlled using a Master-8 receiving synchronized input from behaviour apparatus and control software (Ethovision).
Statistical analysis
The target number of subjects used in each experiment was determined on the basis of numbers in previously published studies. No statistical methods were used to predetermine sample size or randomize. Criteria for excluding mice from analysis are listed in the methods. Mean ± s.e.m. was used to report statistics. The statistical test used, definition of n and multiple-hypothesis correction where appropriate are described in the figure legends. Unless otherwise stated, all statistical tests were two-sided. Significance was defined as alpha = 0.05. All statistical analyses were performed in GraphPad Prism 9.
Reporting summary
Further information on research design is available in the Nature Portfolio Reporting Summary linked to this article.