Study design overview
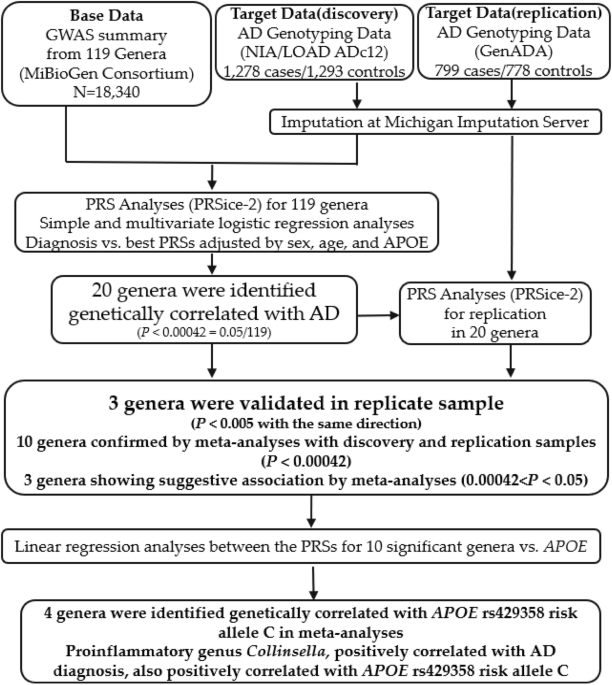
The overall design of our study is shown in Fig. 1. Briefly, we used PRSice-219 to calculate PRSs for individuals from our discovery sample. PRSs were calculated based on the summary statistics for 119 microbial genera from the MiBioGen consortium. The significant association between genera and AD diagnosis was determined when the “best-fit” PRS model had a Bonferroni-corrected p < 0.00042 (0.05/119 = 0.00042). We then replicated the results in an independent sample. We conducted logistic regression analyses between the PRSs of associated genera and AD diagnosis to generate relative odds ratios (ORs) for meta-analysis. The multivariate logistic regression model was used to determine whether sex, age, and APOE genotypes affected the correlation between the PRSs of the associated genera and AD diagnosis. Furthermore, we conducted a linear regression analysis to evaluate the genetic association between the PRSs of ten significant genera and the APOE genotypes of individuals in our discovery and replication samples. This study was approved by our institutional review board (IRB) at the University of Nevada Las Vegas (UNLV).
Figure 1 Study design flowchart. In the PRS analysis, “Base” data is used to provide effect sizes for SNPs shared with individuals in the “Target” data. Using PRSice-2, 20 genera were found to be significantly genetically associated with AD diagnosis in the discovery sample. Three genera were validated in the replication sample, and ten were confirmed by a meta-analysis from discovery and replicate samples. Linear regression analyses were used to determine the genetic correlation between the PRSs for ten significant genera and APOE genotyping. Three genera were identified as genetically correlated with APOE rs429358 risk allele C. Full size image
Data sources
Microbiome GWAS summary statistics (base data)
For our “base” GWAS data, we obtained summary statistics from the MiBioGen consortium initiative (www.mibiogen.org)23, which is the largest, multi-ethnic genome-wide meta-analysis of the gut microbiome to date (Table 1). The data includes 24 multi-ethnic cohorts comprising 18340 participants. 16S rRNA sequencing profiles from each individual were utilized to characterize their gut microbiota abundance using SILVA as a reference database24. The MiBioGen cohorts used a variety of platforms for genotyping their participants, such as the Illumina OmniExpress, Affymetrix 6.0, and more, which are detailed in the supplements of the original study23. The genotyping data from 23 cohorts were imputed at the Michigan Imputation Server (https://imputationserver.sph.umich.edu)25, while another genotyping data were imputed with IMPUTE2 software (v2.3.2)23. From the phylum to genus level, 31 loci were associated with gut microbiota taxa abundance (mbQTL, n = 20) or the presence/absence of taxa (mbBTL, n = 11) at the genome-wide significant threshold (p < 5.0 × 10⁻⁸)23. The SNP effect sizes reported in the mbQTL GWAS summary statistics represent how the host genetic loci affect the relative abundance of each microbiome taxa (mbQTLs)23. In the present study, we limited our analyses to the mbQTL summary statistics from the 119 microbial genera, as 16S rRNA sequencing correlates more accurately with the functional role of gut microbiota at lower taxonomic levels26.
Table 1 Information for studies used in our analyses. Full size table
AD genotyping data (target data): discovery and replication samples
For AD genotyping data we requested two datasets from dbGaP (https://www.ncbi.nlm.nih.gov/gap/), including the National Institute of Aging/Late-onset Alzheimer’s Disease Study (NIA/LOAD) cohort consents 1 and 2 (ADc12) (dbGaP phs000168.v2.p2)27, and the Multi-Site Collaborative Study for Genotype–Phenotype Associations in Alzheimer’s Disease Study (GenADA) (dbGaP phs000219.v1.p1)28,29. The ADc12 data were used as the discovery sample, and the GenADA data were used as the replication sample.
In this our study, AD cases were considered as any individual with dementia diagnosed with definite, probable, or possible AD at any point in their clinical course, according to the Criteria proposed in 1984 by the National Institute of Neurological and Communicative Disorders and Stroke, and the Alzheimer's Disease and Related Disorders Association (NINCDS-ADRDA)30. Included controls were neurologically evaluated individuals who were age-matched cognitively normal. Unspecified dementia, unconfirmed controls, and controls with other neurological diseases from the original studies were removed for our analyses, resulting in 1278/1293 cases/controls in the discovery sample ADc12, and 799/778 cases/controls in the replication sample GenADA. Demographic characteristics of the ADc12 and Gen/ADA samples are listed in Table 2, along with two major APOE SNP genotype information. More detailed descriptions of the data can be found in previous studies27,28,29.
Table 2 Demographic characteristics of the target data (ADc12 and GenADA) with APOE SNP genotyping. Full size table
The ADc12 genotyping data were originally generated with the Illumina Human610 QuadV1-B platform at 601273 SNPs, and the GenADA genotyping data with the Affymetrix 500k Set (Mapping 250k_NSP and Mapping 250k STY arrays).To maximize genetic variants, we conducted imputation for both discovery and replication samples at the Michigan Imputation Server (minimac4) (https://imputationserver.sph.umich.edu)25. The 1000 Genome Phase 3v531 was used as a reference. After the imputation, standard quality control was performed with the Plink command (--maf 0.01 --hwe 1e-6 --geno 0.01 --mind 0.01)32,33. The final datasets were composed of 2571 individuals with 9997692 SNPs in the discovery sample, and 1577 individuals with 8914585 SNPs in the replication sample.
Polygenic risk score (PRS) analyses via PRSice-2 software
PRSice-2 was mainly designed to calculate PRSs for individuals based on GWAS summary statistics data using the traditional “Clumping + Thresholding” (C + T) approach19. A key assumption of the C + T approach is that the SNPs comprising the PRS are independent of each other, which is controlled by thinning SNPs in linkage disequilibrium (LD) and retaining those that are the most significant (“Clumping”)34. SNPs are then thresholded by their p-values from the summary statistics, and the PRS is calculated for individuals at each threshold (“Thresholding”).
One major application of PRSice-2 is to evaluate the genetic correlation between different traits when provided GWAS summary statistics data from a base trait (base data) and genotyping data from a target trait (target data)19. The PRS itself is a numerical approximation of genetic liability for the base trait in the individuals in the target trait, based on their number of alleles from the target data and effect sizes drawn from the base data for a set of SNPs35. As mentioned above, the base (GWAS) data were from the 119 gut microbiome genera in the MiBioGen consortium study23. The target data were the discovery sample ADc1227 and the replication sample GenADA28,29. In this study, we first calculated PRSs for the 119 gut microbiome genera in the discovery sample ADc12 to determine which genera were genetically correlated with AD diagnosis. The best PRS model for each genus was calculated using the “best-fit” model implemented in the PRSice-2 program. For this purpose, a range of p-value thresholds applied to the base data, as well as the association p-value between the PRSs of each genus and AD diagnosis. For this purpose, a range of p-value thresholds was set from 5 × 10⁻⁸ to 1 with an incremental interval of 0.00005 (--interval 0.00005 --lower 5e-08) with LD clumping (--clump-kb 250 kb --clump-p 1.0 --clump-r2 0.1)19. In the discovery sample, a genus was considered significant if its assocation p-value from the “best-fit” model was less than 4.20 × 10⁻⁴ (0.05/119 with Bonferroni correction). To validate the significantly associated genera from the discovery sample ADc12, we conducted the same PRS analyses for them in the replication sample GenADA.
Logistic regression and meta-analysis
To further evaluate the overall association of the 20 significantly associated genera from the discovery sample, we z-score normalized the "best-fit" PRSs from both the discovery sample ADc12 and replication sample GenADA. We then performed a simple logistic regression analysis for both samples between the normalized PRSs from the “best-fit” threshold for AD diagnosis using the glm function from the R package stats36.
Next, we conducted a random effects meta-analysis from both samples using the R package metafor v3.8-137. The summary effect estimate of this meta-analysis identified ten significant genera that were used for all future analyses. Forest plots were generated to visualize the overall AD protective and risk effects across the significant genera using the “forestplot” R package38. To compare the normalized PRSs for the ten significant genera between AD cases and controls in the discovery sample, we conducted the unpaired Wilcoxon Rank Sum test with the wilcox.test function in R (v4.2.0)36 and visualized the results with box plots. Box plots were generated using the R program ggplot2 v.3.3.639.
To account for potential confounding variables in our analysis, multivariate logistic regression was conducted between AD diagnosis and z-score normalized PRSs for significant microbial genera using the glm function from the R stats package36. Sex, age, and APOE genotypes (rs429358, rs7412) were used as covariates.
Linear regression analyses between APOE genotypes and PRSs for the ten significant genera
Two APOE SNPs, rs429358 minor allele C and rs7412 major allele C, are well-known risk factors for AD40,41. We performed linear regression analyses to determine the genetic correlation between the two APOE SNPs and the normalized PRSs of the ten significant genera from the meta-analysis. The association was further evaluated by linear regression analysis adjusted for sex and age. All linear regression was performed using the lm function from the R stats package. Box plots with the ANOVA test (state compare means function) were created using the R packages ggplot2 (v3.3.6), ggpubr (v0.4.0), and stats (v0.1.0)36,39.
Statistical analyses
The p-value threshold for significant association in the discovery sample and meta-analysis was set as p < 4.20 × 10⁻⁴ (0.05/119 with Bonferroni correction). For the replication sample, one-side significant level p < 0.005 (0.1/20 with Bonferroni correction) was used. For all other statistical analyses, such as linear regression analysis, the ANOVA test, and Wilcoxon Rank Sum test, p < 0.05 was considered significant. The Wilcoxon Rank Sum method, also known as the Mann–Whitney test, is a non-parametric alternative to the unpaired two-sample t-test, which can be used to compare two independent groups of samples without knowing their distribution42. The ANOVA method was utilized to test the association between the normalized PRSs for the ten significant genera and APOE genotypes43.
Ethical approval and consent to participate
We are using the existing data for this study. Informed consent was obtained from all subjects and/or their legal guardian(s) in the original studies. Contributing studies received ethical approval from their respective institutional review boards (IRB). This study was performed per the Declaration of Helsinki and approved by the IRB at the University of Nevada Las Vegas (IRB #00002305, 10/12/2021).