Time-domain double-slit by synchrotron radiation
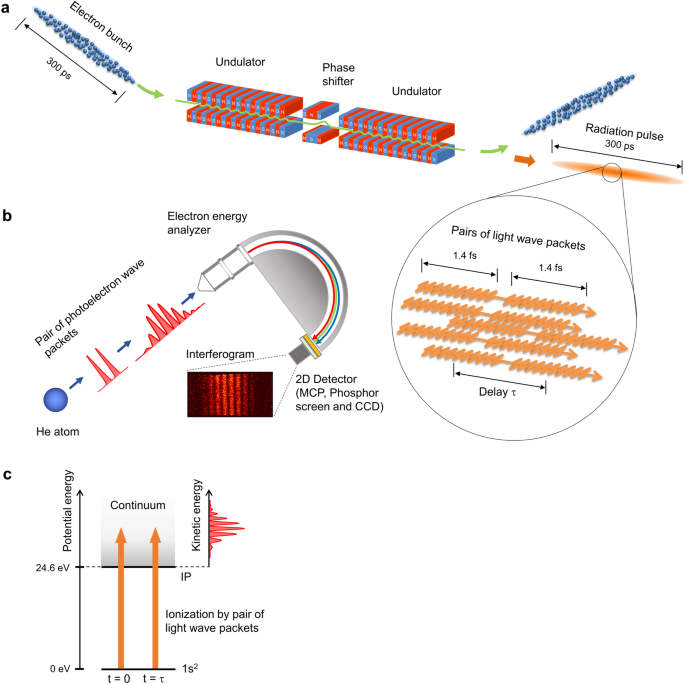
Figure 1 shows the experimental layout. To produce the temporal double-slit, we use a tandem-undulator system in which each relativistic electron in the bunch emits a pair of light wave packets that has a mutual coherence between them. The waveform of each light wave packet is characterized by 10-cycle oscillations with a rectangular envelope, reflecting the undulating motion of the relativistic electron in the undulator27. The radiation wavelength is set to about 43 nm. The duration of the 10-cycle oscillations is approximately 1.4 fs, which defines the width of the temporal slit. The time delay between the light wave packets in the pair defines the temporal separation between the two slits, and is precisely tuned in the femtosecond regime with attosecond resolution using a phase shifter magnet located between the two undulators.
Figure 1 Experimental layout for time-domain double-slit interference by synchrotron radiation. (a) Spontaneous radiation is emitted from a bunch of relativistic electrons passing through the tandem-undulator in the UVSOR-III synchrotron ring. Each of the relativistic electrons in the bunch emits a pair of light wave packets, reflecting the sequential undulating motion in two undulators. Numerous pairs of light wave packets are randomly distributed in the radiation pulse. (b) A pair of photoelectron wave packets is emitted from a helium atom that interacts with the pair of light wave packets. The interfering photoelectron wave packets are observed as an interferogram on the detection plane of the hemispherical electron energy analyzer. The buildup of quantum interference pattern is monitored by a 2D detector which allows for one-by-one detection of the photoelectrons, which stochastically arrive at the detector plane. (c) Energy level diagram of helium atom and the ionization process by a pair of light wave packets. Full size image
A pair of light wave packets sequentially interacts with a helium atom, producing a pair of photoelectron wave packets that propagate in free space (Fig. 1b). Due to the momentum dispersion of the matter waves, the first and second components of the photoelectron wave packet pair temporally spread in free space and overlap each other, leading to the appearance of the interference pattern in coordinate space15,16. This wave packet interference gives rise to the appearance of interference fringes in energy or momentum distributions. Therefore, the measurement of the photoelectron spectrum makes the observation of wave packet interference experimentally possible. Figure 1c shows a schematic drawing of the energy level of helium atom and the ionization process using a pair of light wave packets. Note that in the actual experiment, an incoherent mixture of numerous pairs of light wave packets in the radiation pulse interacts with a helium atom, leading to the production of pairs of photoelectron wave packets that are randomly distributed in a temporal duration of 300 ps. However, the incoherent properties among the photoelectron wave packets related to different light wave packets are canceled out in the observable quantities [see Methods]. Consequently, the interference pattern observed in this study directly reflects the quantum interference between photoelectron wave packets produced by a pair of light wave packets.
In order to visualize the buildup of the interference pattern, we observe the wave packet interference in the energy-domain. We record photoelectron images using a two-dimensional (2D) position-sensitive detector mounted in a hemispherical electron energy analyzer as shown in Fig. 1b. The 2D detector consists of a micro-channel plate (MCP), a phosphor screen, and a charge-coupled device (CCD) camera. We adjust the light intensity to ensure that there is only a single photoelectron in the electron analyzer at any given time, enabling the observation of photoelectron interference. The buildup process of the quantum interference pattern is monitored by accumulating the CCD images.
Buildup of photoelectron interference
Figure 2 compares the CCD images of photoelectrons recorded with the radiation from single- (Fig. 2a,b) and tandem-undulator configurations (Fig. 2c). The single-undulator configuration is prepared by setting the pole gap of one of the two undulators to its maximum, where the radiation power of the undulator becomes negligibly small. The field strength of the phase shifter magnet was fixed with the same coil current during the measurement. While the horizontal axis of the image shows the kinetic energy of the photoelectron, the vertical axis represents the ionization points of atoms along the light propagation axis in the gas cell. When the single-undulator is used, the helium atom is ionized by light wave packets emitted from either the upstream or downstream undulator, leading to the production of single (not-paired) photoelectron wave packets. Therefore, no interference pattern can be exhibited on the CCD image. In this case, the photoelectron distribution on the detector plane simply reflects the spectral distribution of the undulator radiation, which is characterized by a 10% width (FWHM) of the central photon energy. With increasing numbers of photoelectrons, broad structures centered at around 4.5 eV become visible in panels of Fig. 2a,b. On the other hand, interfering photoelectron wave packets are produced when the radiation from the tandem-undulator is used to ionize helium atoms. The CCD images in Fig. 2c shows the two-dimensional distribution of photoelectrons measured with pairs of light wave packets. The CCD image after accumulation of 2000 electrons shows an almost random distribution. An interference pattern exhibiting the wave-like nature of single photoelectrons appears at 2 × 10⁴ electrons, and becomes clearer as the number of electrons is increased.
Figure 2 One-by-one detection of single-photoelectrons. (a–c) CCD images of photoelectrons observed for radiation from (a) the upstream undulator, (b) the downstream undulator, and (c) the tandem-undulator. The phase shifter current was kept constant during the measurements. The total number of detected electrons are shown at the left side of the panels (a). The color bar ranges from 0 to 4 electrons in the upper three panels, and from 0 to 80 electrons in the images obtained at 1 × 10⁶ electrons. (d–f) One-dimensional distributions obtained by projecting the electron intensities in the images of 1 × 10⁶ electrons onto the energy axis. The interference fringes were fitted by a model curve using Eq. (3). Full size image
One-dimensional photoelectron spectra are obtained from the two-dimensional images at N e ~ 1 × 10⁶ by integrating the photoelectron counts onto the horizontal axis (Fig. 2d–f). The photoelectron spectra obtained by the single-undulator show single peak structures centered at around 4.5 eV kinetic energy. In contrast, the photoelectron spectrum measured with the tandem-undulator is characterized by an interference pattern. The photoelectron spectra in Fig. 2d,e can be well fitted by a single Gauss function which approximately represents the spectral distribution of the radiation from the single-undulator. The interference pattern in Fig. 2f, on the other hand, can be fitted by the probability density for pairs of photoelectron wave packets in the energy-domain (see “Methods”). In the fitting, the width of the temporal slit determines the envelope of the interference pattern which is experimentally obtained by the fitting for the photoelectron spectra measured with the single-undulator. The free parameters in the fitting were the time delay between the light wave packets and the fringe contrast. The theoretical curve well fits the interference pattern, and time delays are obtained to be 6.9 fs. The contrast of the interference fringes is limited to 0.7, mainly due to the reduction in temporal coherence resulting from electron beam properties such as the energy spread and angular divergence, which smear the time delay23.
Control of double-slit separation
Figure 3a shows the time-domain interferogram, which consists of photoelectron spectra measured as a function of time delay. The horizontal axis shows the time delay produced by the phase shifter magnet. To obtain the absolute time delay τ, it is required to add a minimum delay of approximately 1.9 fs which corresponds to the sum of the temporal duration of the light wave packet and the time delay due to the slippage effect in the drift space between the two undulators. The vertical axis is the kinetic energy of the photoelectron. The interferogram exhibits a periodical modulation of photoelectron intensity on the two-dimensional plot. Similar to the discussion on the interference between the electron wave packets in the bound state22, the periodic intensity modulation can be explained by time-domain Ramsey interference between the photoelectron wave packets. When the time delay is varied, constructive and destructive interference occurs between the plane waves which constitute the photoelectron wave packets. The interference condition is determined by the phase difference ωτ. Here, the photon frequency is given by ω = (E + E IP )/ħ where E and E IP are the kinetic energy of photoelectron and ionization potential of the atom, respectively15. Therefore, the photoelectron intensity oscillates at a temporal period of around 140 as. The time-domain Ramsey interference is clearly visible over the whole area of the interferogram, indicating that the photoelectron wave packet interference can be precisely controlled by adjusting the temporal separation between the two light wave packets at the attosecond level.
Figure 3 Time-domain photoelectron interferogram. (a) The photoelectron interferogram consists of photoelectron spectra measured as a function of the phase shifter delay. (b–d) Photoelectron spectra obtained at phase shifter delays of 0.51, 2.50, and 4.52 fs (vertical dashed lines in a). The photoelectron spectra are fitted by Eq. (3). The experimental data points and fitting curves are shown by gray circles and red curve, respectively, in (b–d). Full size image
Figures 3b–d show the photoelectron spectra at phase shifter delays of 0.5, 2.5, and 4.5 fs (indicated by vertical dashed lines in a), showing interference patterns dependent on the time delay. The photoelectron spectra in Fig. 3 are well fitted by Eq. (3), and the time delays are obtained to be 2.41, 4.40, and 6.41 fs, respectively. The photoelectron spectra exhibit fringe structures that vary with the time delay. This observation is a manifestation of the fact that the temporal separation between the two slits determines the spacing between the interference fringes, as in the space-domain double-slit interference. Similar to double-slit interference in the space-domain, the number of interference fringes increases with increasing time delay. This can be qualitatively explained by considering the interference condition between plane waves with specific momenta which constitute the photoelectron wave packets. Constructive or destructive interference occurs between the plane wave components when the phase difference is an even or odd multiple of π. As the time delay becomes longer, two neighboring kinetic energies that satisfy the constructive interference condition become closer. Therefore, in Fig. 3b–d, as the time delay increases, the spacing between fringes becomes narrower, and thus the number of fringes increases.