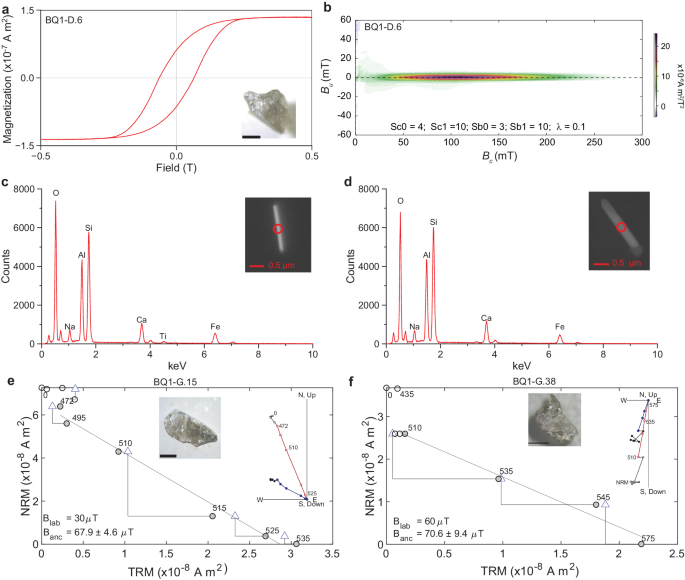
The plagioclase studied from the Bushveld pyroxenite and Passo da Fabiana Gabbros have ideal single domain magnetic behavior yet yield vastly different field strengths. The Bushveld value extends the Archean period of high time-averaged field intensity into the Paleoproterozoic (Fig. 3). In stark contrast, the Passo da Fabiana value is 30 times weaker, and the lowest time-averaged field strength known to date (Fig. 3a, b). When combined with the Sept Îles 565 Ma paleomagnetic dipole moment1, the data suggests the UL-TAFI (defined as fields equal to or less than 10% of the present-day) spanned at least 26 million years. If the UL-TAFI is the nadir of the proposed much longer-term decline of field strength preceding the onset of inner core nucleation1,22 (Supplementary Discussion—Long-term paleointensity history and ICN, Fig. 3), the duration of low (defined here as equal to or less than 20% of the present-day) to ultra-low fields could have been >200 m.y.
Fig. 3: Paleointensity, oxygen and animal evolution. a Field strength constrained from select Thellier (thermal) SCP studies (blue squares, hexagons) and bulk rock studies (gray squares) updated from Zhou et al.22, with new time-averaged SCP results (red hexagons) reported here. Large squares are time-averaged paleomagnetic dipole moments; small squares are virtual dipole moments (VDMs). Gray circles are select Phanerozoic VDMs from Bono et al.1. Field evolution model (3450 Ma to 565 Ma, red line) is weighted second-order polynomial regression of Precambrian field strength data from Bono et al.1; 565 to 532 Ma trend from Zhou et al.22. b Cryogenian to Cambrian field strength evolution corresponding to dashed rectangle in (a). Open circles are results from non-Thellier methods (non-thermal and thermal) and their sizes are weighted by the numbers of cooling units from Zhou et al.22. Key: green, microwave method; purple, Shaw method; black, Wilson method. Brown open circles are Thellier thermal results. Ultra-low time averaged field interval (UL-TAFI) highlighted by light purple rectangle. Also shown are selenium isotopic data (open symbols) and oxygenation interpretation from Pogge von Strandmann et al.20 (shown here with a 25 my window mean and 1σ error), summary animal radiation of bilaterian and non-bilaterians from Zhuravlev and Wood65), Wood et al.3, Darroch et al.66 and Muscente et al.67, and Shuram excursion ages from Rooney et al.42. Full size image
The new data confirming and extending the UL-TAFI strengthen a potential linkage with the Ediacaran evolution of macroscopic animals. While phylogenomic data indicate that the animal kingdom and many phyla may have diverged prior to the Ediacaran Period26,27, paleontological data show that the diversification of macroscopic animals, as archived in the Avalon and White Sea assemblages of the Ediacara Fauna, began at ~575 Ma and reached a climax at ~565 Ma28,29,30,31,32, in a striking temporal correlation with the UL-TAFI (Fig. 3b). Prior explanations for the appearance of the Ediacara Fauna and the Cambrian radiation have centered on genetic, ecological, or environmental driving factors33. The temporal coincidence between the UL-TAFI and the rise of the Ediacara Fauna, however, invites a refocus on environmental factors, particularly atmospheric and oceanic oxygenation events.
Oxygen has long been identified as a key “environmental gatekeeper”34, allowing for evolutionary innovation and for meeting the energy demands of animals35. Although sponges and microscopic animals can survive at low levels of dissolved oxygen (as low as ~1.5 μM, equivalent to 0.5% present atmospheric level [PAL]36,37), macroscopic, morphologically complex, and mobile animals require a greater amount of oxygen to support their metabolic demands38. A complex animal ecosystem involving long food chains and predators requires still greater amounts of oxygen, as indicated by the exclusion of such complex ecosystems from the modern oxygen minimum zone39, which is characterized by dissolved O 2 levels of <20–30 μM or <10% PAL. In this regard, it is important to note that mobile animals and macroscopic animals up to decimeters in size have been recorded in the ~565 Ma White Sea assemblage of the Ediacara biota40,41.
Multiple lines of geochemical evidence point to a possible increase in atmospheric and oceanic O 2 levels in the late Ediacaran Period, specifically in the period of ~575–565 Ma characterized by negative δ13C values of the Shuram excursion42 (Fig. 3b). These include elevated δ88Mo and δ82/76Se values, as well as [Mo], [U], and [V] concentrations in organic-rich shales deposited approximately at 565 ± 5 Ma and thus coincident with the diversification of macroscopic animals in the White Sea assemblage of the Ediacara biota20,43. Importantly, δ238U data of carbonate rocks, as well as Δ\({}^{{\prime} 17}\)O-δ34S-δ18O of carbonate-associated sulfate, point to multimillion years of oceanic oxygenation that temporally coincide with the Shuram excursion and the Avalon-White Sea assemblages44,45,46. We note that there is much uncertainty and controversy with the regard of the magnitude of this oxygenation event47,48, partly because different geochemical proxies have different sensitivities and hence sometimes give apparently conflicting inferences about oxygen levels. Such uncertainty is further complicated by the dynamic nature of oceanic redox history and spatial heterogeneity of oceanic redox conditions in the late Ediacaran Period49,50,51. However, the concurrence of these independent indicators of oxygenation, paleontological records documenting the rise of the Ediacara Fauna, and paleomagnetic data defining the UL-TAFI merits further exploration for potential linkages.
Hydrogen (H) can escape to space by thermal and non-thermal mechanisms resulting in net oxygenation of the atmosphere52. Changes in climate and/or methane release recorded by Ediacaran isotopic records, including the Shuram excursion42,53 (Fig. 3b), could have led to conditions favoring H loss, but these interpretations are debated54 (Supplementary Discussion—Oxygenation, Ediacaran climate and methane). Here we focus on the potential influence of the UL-TAFI on H loss through changes in the paleomagnetosphere.
Using solar wind evolution models based on solar analogs15, steady-state magnetopause stand-off distances would have been <4.5 Earth radii (r ⊕ ) at 565 Ma1 and <4.2r ⊕ at 591 Ma, compared to the present-day value of ~10.7r ⊕ . During extreme coronal mass ejection events, stand-off distances could have been as low as 1.6r ⊕ . These smaller standoff distances can lead to more hydrogen escape because they increase the polar cap area of open field lines16 where non-thermal H+ loss occurs today. The steady-state polar cap area of open field lines would have been 3.5 times greater at 591 Ma, and even greater during coronal mass ejection events impacting Earth (Supplementary Discussion—Magnetopause standoff, hydrogen loss and hydrogen supply). Moreover, at the reduced stand-off distances implied by our data, the magnetopause will approach, and even fall below Earth’s plasmapause16,55, below which plasma density, dominated by H+, markedly increases (Supplementary Discussion—Magnetopause standoff, hydrogen loss and hydrogen supply). In this case, increased global loss of H+ is expected. Greater global non-thermal H loss is also predicted for the much smaller magnetosphere resulting from the UL-TAFI because the solar wind has greater access to a higher density of H atoms (Supplementary Discussion—Magnetopause standoff, hydrogen loss and hydrogen supply).
Quantifying H loss for Earth with an ultra-low field is challenging as it is observationally inaccessible. The few available models predict greater H loss56, but the predicted change vary depending on assumptions (~30% to 10 times). The highest estimates could result in a few percent change of oxygen (PAL) that might represent a perturbation or crossing of a threshold, allowing Ediacaran animal diversification (Supplementary Discussion—Magnetopause standoff, hydrogen loss and hydrogen supply), but it should be noted that none of these nascent models consider all of the processes discussed above.
An effect that also warrants further consideration is that with decreased magnetopause standoff, greater penetration of highly energetic protons is expected over a larger solid angle, resulting in the formation of NO x compounds which can create ozone holes57. With the greater UV flux (Supplementary Discussion—Magnetopause standoff, hydrogen loss and hydrogen supply), dissociation of water vapor58 is expected, increasing the supply of H moving upward. Thus, the UL-TAFI could have led to both an increased supply of H available for loss, and an increased outflow.
Enhanced H loss from the magnetosphere could have acted over tens or hundreds of millions of years when the geomagnetic field was at low to ultra-low strengths (Fig. 3). The multiple pathways discussed above provide a framework for future studies quantifying hydrogen loss, oxygenation of the atmosphere and the potential consequences on the evolution of complex animals highlighted by the synchroneity of these phenomena and the near collapse of the geodynamo.