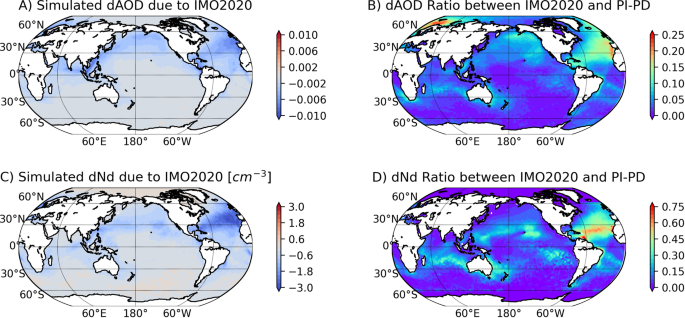
Here we combine satellite observations and a chemical transport model to quantify the radiative forcing of the inadvertent geoengineering event induced by IMO2020 and estimate its climate impacts. We simulate the impact of IMO2020 on maritime aerosol concentrations with the NASA GEOS-GOCART model. Figure 1 shows the modeled reduction in aerosol optical depth due to decreased SO 2 emission from the international shipping industry. The AOD reduction reaches peak values of around 0.01 in the South China Sea and Eastern North Atlantic off the coasts of Western Europe. In the South Atlantic the regulations create AOD reductions that follow the shape of shipping routes. We then calculate the ratio between the AOD change due to IMO2020 and that between pre-industrial and present day. Over most of the ocean, the ratio is smaller than 10% because of sparse shipping outside the major shipping routes. Over the North Pacific and North Atlantic, on the other hand, it can exceed 10% and reaches 25% in the Norwegian Sea and off the western European and northwestern African coasts. In these regions, the total anthropogenic aerosol concentration is relatively low because of declining emissions of aerosols and their precursors since the 1980s, making ship-emitted aerosols an important component of the anthropogenic maritime aerosols. The IMO2020 is therefore effective in reducing total aerosol loading for these regions. The impact of IMO2020 on the cloud droplet number concentration (N d ) of low-level maritime clouds as shown in Fig. 1C (see Methods). Globally, IMO2020 leads to a modest reduction of 0.5 cm−3 in mean modeled N d . Regionally, however, the reduction is more pronounced. The strongest reduction occurs in the North Atlantic, the Caribbeans and the South China Sea, reaching 3 cm−3. These are regions with the busiest shipping lanes and thus strongest reduction of ship emissions. The reduction in the South Atlantic shows the most well-defined shipping lane shapes likely due to the unique circulation pattern in this region18,20. Figure 1D shows the ratio between IMO2020 induced Nd decrease and estimated Nd difference between preindustrial and present day. The ratio is small over the major outflow areas downwind of major continental sources, but becomes substantially larger in more remote oceans, reaching 30%. In the tropical North Atlantic, IMO2020 induced change in Nd can be more than 50% of the total anthropogenic change.
We combine N d changes due to IMO2020 with satellite observations to estimate the forcing introduced by the inadvertent geoengineering event21. We consider both the Twomey effect and the effects of cloud liquid water path (LWP) and cloud fraction adjustments to N d (see Methods section). The LWP and cloud fraction adjustments follow the functional forms derived from a large sample of ship-tracks21 that depend on the background cloud N d , sea surface temperature (SST), estimated inversion strength, and background low cloud fraction (see Methods). Figure 2 shows the pattern of annual mean of forcing resulting from N d decrease due to IMO2020 averaged over different LWP and cloud fraction adjustment functional forms. The total forcing is +\(0.2\pm 0.11\)Wm−2 averaged over the global ocean with the Twomey effect contributing 40%, the LWP adjustment being near neutral, and the cloud fraction adjustment contributing 60%. The positive radiative forcing has strong regional variations. The North Atlantic experiences the strongest radiative forcing peaking around 1.4Wm−2 and whose basin-wide mean is around 0.56Wm−2. Weaker but still notable radiative forcing is seen in the North Pacific and the South Atlantic. This ordering is consistent with the amount of ship traffic and low cloud fraction in these regions. Our estimate of radiative forcing from IMO2020 is well within the range of estimates of the total forcing from shipping emissions in the literature22,23,24,25. We also compare our estimate with that from a recent observational study in the core shipping lane in the South Atlantic that used a different approach19. The two completely independent approaches yield very similar radiative forcing in the core shipping lane (supporting online material, SOM), which serves as a cross-validation. Similar global forcing, i.e., on the order of 0.1Wm−2, is reported by multiple modeling groups26.
Fig. 2: Calculated IMO2020 forcing maps from different components. The spatial patterns of three components of forcing from cloud adjustments: A the Twomey effect, B LWP adjustment, and C cloud fraction adjustment. Full size image
Using an energy balance model27, we calculate the expected amount of transient temperature increase due to warming resulting from IMO2020. For simplicity, we ignore the heat uptake by the deep ocean during the short-term, i.e. O(10) years. 0.2 W m−2 translates to around 0.16 K of warming with a timescale of 7 years. It is equivelant to 0.24 K/decade, which is more than double the average warming rate since 1880 and 20% higher than the mean warming rate since 1980, linear trend of 0.19 K/decade. We also calculated the lower and upper bounds of the forcing and corresponding expected warming (Fig. 3). The IMO2020 is expected to provide a substantial boost to the warming rate of global mean temperature in the 2020 s. The rate of warming is expected to ramp up quickly from 2020 and asymptotes to the longer-term trend line at the end of 202027. The 2023 record warmth is within the ranges of our expected trajectory. The magnitude of IMO2020 induced warming means that the observed strong warming in 2023 will be a new norm in the 2020 s. The mean temperature anomaly of the 2020 s will be 0.3 K higher than that of the 2010s. Regionally, the warming effect from IMO2020 on SST is harder to estimate since basin-wide SST changes can be affected by variations in factors like other aerosol concentration, ocean circulation, and air-sea interactions. However, the strong geographical variations in the forcing suggest the impact of IMO2020 on SST may have significant variation among ocean basins. For example, the North Atlantic SST may be disproportionally warmed more by the IMO2020 given the radiative forcing is more than three times the global average, which is likely a contributing factor to the pronounced warming of the North Atlantic SST in recent years28. A more robust quantitative estimate of the contribution of IMO2020 to regional SST warming requires coupled global climate models that have good representation of aerosol indirect effects.
Fig. 3: Time series of global temperature anomaly since 1980 (Lensen et al., 2019). The trend line is dashed. The expected warming trajectory from the combination of the linear trend and the calculated warming effect from IMO 2020 shock based on the energy balance model. The upper and lower bounds of the expected warming are shown in shades. The baseline period for temperature anomaly is between 1951 and 1980. Full size image
The IMO2020-induced radiative forcing exhibits considerable seasonal variations. This is evident in the North Atlantic where the IMO2020 produced the strongest forcing. Figure 4 shows the monthly mean time series of forcing and its three components. We use a simple functional form for cloud adjustments that only depends on background N d to illustrate the point. The total forcing varies between 0.19Wm−2 and 0.38Wm−2, a 100% relative change. The seasonal variation of incoming solar radiation is the dominant driver for this (SOM). But seasonal variations of background CF, N d , and ΔN d due to IMO2020 also contribute as they affect the magnitude of the Twomey effect and macrophysical (LWP and CF) cloud adjustments. We estimate the contribution from each variable after removing the seasonal change in solar insolation, and report the results in Fig. 4B–D (see Methods). ΔN d induced by IMO2020 is the strongest contributor. Its variations can affect the forcing by more than 30% in some months such as Jan, Apr, and Dec. Its impact on LWP and CF adjustments contributes equally to the total radiative forcing. The seasonal variation of background N d is also an important factor (Fig. 4C). Background CF also meaningfully contributes to the seasonal variations through mostly affecting the Twomey effect (Fig. 4D).
Fig. 4: Sensitivity of forcing components to different cloud variables. A The areal mean of forcing from IMO2020 in the North Atlantic (0o−80oW, 0o ~ 60oN) and its break down in three components. B–D sensitivity tests to gauge the impacts of seasonal variations in ΔN d , background N d , and cloud fraction, respectively. In each test, we use an annual mean map instead of seasonally changing fields to calculate the radiative forcing and plot their difference from the baseline. Details in Methods section. Full size image
We compare the radiative forcing due to IMO2020 and its effect on radiative energy balance with observed changes in relevant quantities. The comparison does not prove causality but provides a context to assess the impact of IMO2020. The low cloud dimming forcing of 0.2 Wm−2 from the IMO2020 represents a strong temporary shock to the net planetary heat uptake (Fig. 5A) that has been increasing at a rate of ~0.05 Wm−2/yr29 in measurements. The net planetary heat uptake has increased by 0.25 Wm−2 since 2020, making the 0.2 Wm−2 due to IMO2020 nearly 80% of the total increase. The long-term trend of CERES TOA net radiation is 0.46 Wm−2/decade while it changes to 0.67 Wm−2/decade since IMO2020 took effect. The difference is 0.21 Wm−2 that is consistent with our estimated forcing. However, the record since 2020 is too short to ascertain the impact of IMO2020 on the long-term trend of the energy balance given its large interannual variations. The IMO2020 effect also has an asymmetric impact on aerosol loading in the northern and southern hemispheres because of higher baseline ship emissions in the northern hemisphere. This creates interhemispheric contrast in the resulting radiative forcing, which has important implications for deliberate geoengineering schemes because interhemispheric forcing contrast can create significant perturbations in precipitation patterns6. We calculate the interhemispheric contrast in IMO2020 induced warming effect to be around 0.22 Wm−2, with the northern hemisphere at 0.32 Wm−2 and the southern hemisphere at 0.1 Wm−2. The 0.22 Wm−2 contrast is substantial when compared with recent measured changes in the interhemispheric contrast in absorbed solar radiation. Figure 5B, C shows measured time series of top-of-atmosphere (TOA) absorbed solar radiation of both hemispheres and their contrast, respectively. Since IMO2020 took effect, the northern hemisphere (NH) absorbed solar radiation has increased by 0.5 Wm−2 from a plateau between 2017 and 2020 while the southern hemisphere (SH) increased at a much slower rate. The low cloud dimming effect of IMO2020 represents around 60% of increase in NH absorbed solar radiation. The interhemispheric contrast in absorbed solar radiation has increased by ~0.2 Wm−2 based on measurements, one of the highest rates of increase during the whole record, which is almost the same as that induced by low cloud dimming effect of IMO2020. Another rapid increase period is associated with a phase shift in Pacific Decadal Oscillation (PDO) starting 2014/2015 followed by a strong El-Nino event29. The PDO entered a negative phase in 2020, which would favor a further decrease in the contrast rather than the observed increase. It is worth noting that in addition to modes of ocean variability such as PDO and El-Nino Southern Oscillation may contribute to variations in these quantities6.
Fig. 5: Observed time series of energy balance variables. A the planetary heat uptake; B trailing 48-month mean of absorbed solar radiation for both hemispheres. The 48-month mean is applied to remove high-frequency noise. C Time series of Interhemispheric contrast in absorbed solar radiation. The vertical dotted line marks the Jan 2020—details in the Methods section. Full size image
The combination of modeled \(\varDelta {N}_{d}\) and observed relationship for LWP and cloud fraction adjustments show that IMO2020 as a termination shock for the inadvertent geoengineering experiment of shipping emissions has had a non-trivial warming effect on the climate. The National Academy of Sciences, Engineering, and Medicines4 recommended the impact of any outdoor solar radiation management experiment on global mean temperature to be within 1 × 10⁻⁷K. The forcing magnitude of this inadvertent shock has exceeded this limit by a large margin. However, it does suggest that MCB is a viable solar radiation modification scheme in temporarily slowing the rate of climate warming. Our analysis also points to strong spatiotemporal heterogeneities in the forcing produced by the event. Such heterogeneities need to be considered in any MCB scheme to minimize their potential undesired impacts on regional climate in addition to the desired slowing of climate warming rate. Important part of the heterogeneity exists because of background low cloud distribution and its spatiotemporal variability creating an interhemispheric contrast of radiative forcing having similar magnitude as the global mean radiative forcing. Understanding this contrast is important because to achieve the goal of substantially slowing down the warming rate or limit the maximum warming to be within 1.530, much larger forcing than that of IMO2020, but of the opposite sign, would be needed. As a result, the interhemispheric contrast needs to be minimized to avoid substantial perturbations to regional monsoons and other precipitation patterns. It should be noted that the forcing due to IMO2020 will take time for it to be directly detectable at the global scale in the observation records, but regionally, e.g., in the North Atlantic, its impact may be detectable sooner. Regional radiative forcing is already detectable in the Southeast Atlantic shipping lane19. Finally, an important open question for policy makers to consider is the trade-off between the benefits of better air quality and the potential cost of additional warming as different parts of the world have reduced and are going to reduce aerosol pollution31,32. The trade-off consideration is also relevant for deliberate geoengineering schemes to select the right properties of emitted aerosols.
There are several sources of uncertainties in our estimate of the radiative forcing via cloud dimming induced by IMO2020. A key source is the magnitude of N d change. Here the N d change is modeled with a chemical transport model and not constrained with actual observations. The annual mean change in N d (0.5 cm−3) is small compared to the background N d (28 cm−3) and its variability. Counterfactual analyses of satellite-based N d changes due to ship emissions in the South Atlantic may provide useful regional constraint on \(\varDelta {N}_{d}\) once there are additional years of observations19. Although adjustments of LWP and cloud fraction are robust given the large number of samples, they have their own limitations as detailed in previous studies14,33,34,35,36. One way to gauge the possible range of uncertainty for our forcing estimate is to compare ours with that from Diamond (2023)19 in the South Atlantic (SOM). In the core shipping lane, the forcing is estimated to peak around 0.5Wm−2, the Twomey effect being the dominant factor in this region (see Fig. 2), in our analysis in excellent agreement with theirs19. The inadvertent nature of IMO2020 means that the ratio between radiative forcing and changes in aerosol mass is not optimized. Here we report 0.2Wm−2 for around 3.7 Tg of S reduction, which is much less efficient than a more optimized scheme due to factors such as emitted aerosol size distribution and the spatial distribution of emission changes9. Finally, our analysis does not consider feedback processes. The additional warming of the ocean can induce positive feedbacks from low clouds37,38, which can only be addressed in a coupled climate model.
In summary, IMO2020 represents a termination shock for the inadvertent geoengineering by global ship emissions through a reverse MCB and produces a positive forcing of + 0.2 ± 0.11 Wm−2. It is expected to provide strong additional warming rate this decade, more than doubling the long-term mean warming rate. The forcing has pronounced spatiotemporal heterogeneity. The IMO2020 effect also contributes to a strong temporary increase to the planetary heat uptake through cloud dimming, and it is around 80% of the measured increase in interhemispheric contrast of absorbed solar radiation since 2020. Our results offer useful guidance for MCB and aerosol-cloud interaction research.