Acute COVID-19, caused by infection with severe acute respiratory syndrome coronavirus 2 (SARS-CoV-2), is characterized by a broad spectrum of clinical severity, from asymptomatic to fatal1,2. The immune response during acute illness contributes to both host defense and pathogenesis of severe COVID-19 (ref. 3). Pronounced immune dysregulation with lymphopenia and increased expression of inflammatory mediators3,4 have been described in the acute phase. Following acute COVID-19 infection, a proportion of patients develop physical and neuropsychiatric symptoms lasting longer than 12 weeks (known as Long COVID, chronic COVID syndrome or post-acute sequelae of COVID-19 (ref. 5)), henceforth denoted as LC. Although similar syndromes have been described following infection with SARS-CoV-1 (ref. 6) and Middle East respiratory syndrome–related coronavirus7, LC often develops after mild-to-moderate COVID-19 (refs. 8,9). Symptoms persisting 6 months were observed in 76% of hospitalized patients, with muscle weakness and fatigue being most frequently reported10,11. LC affects between 10% and 30% of community-managed COVID-19 cases 2 to 3 months after infection12,13 and can persist >8 months after infection14. LC symptoms include severe relapsing fatigue, dyspnea, chest tightness, cough, brain fog and headache15. The underlying pathophysiology of LC is poorly understood.
Here, we analyzed a cohort of individuals followed systematically for 8 months after COVID-19 infection according to a predefined schedule, comparing them to healthy donors unexposed to SARS-CoV-2 (unexposed healthy controls (UHCs)) before December 2019, and individuals who had been infected with prevalent human coronaviruses (HCoVs; HCoV-NL63, O229E, OC43 or HKU1), but not SARS-CoV-2. The ADAPT study9 enrolled adults with SARS-CoV-2 infections confirmed by PCR at St Vincent’s Hospital community-based testing clinics in Sydney (Australia). For the majority of participants, their first visit occurred between months 2 and 3 after infection (median of 79 days after the date of initial diagnosis)9,14, with 93.6% and 84.5% of participants completing subsequent month 4 (median, 128 days) and month 8 (median, 232 days) visits (Table 1). Of the 147 patients recruited (70.5% through ADAPT sites and 29.5% externally), 31 participants (21.08%) were designated as LC based on the occurrence of one of three major symptoms (fatigue, dyspnea or chest pain) at month 4 (Supplementary Table 1). These participants were age and gender matched with 31 asymptomatic matched controls (MCs) from the same cohort who did not report symptoms at month 4 after infection but were symptomatic during the acute phase of the infection (Supplementary Table 2). There was a 10% trend toward some improvement of symptoms over time in LC, but this trend was not statistically significant (Fisher’s exact P = 0.44).
Table 1 Patient characteristics Full size table
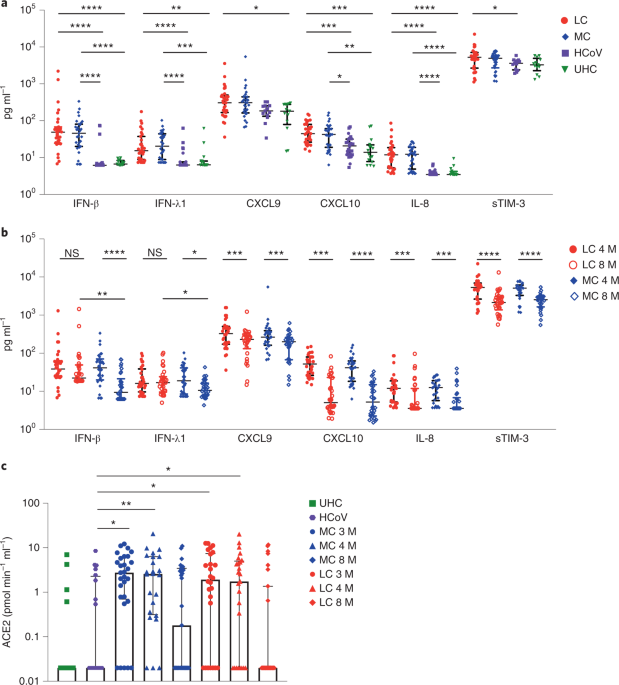
To examine biomarkers associated with LC, we assessed 28 analytes in the serum of patients from the LC, MC, HCoV and UHC groups at month 4 after infection using a bead-based assay. Six proinflammatory cytokines (interferon β (IFN-β), IFN-λ1, IFN-γ, CXCL9, CXCL10, interleukin-8 (IL-8) and soluble T cell immunoglobulin mucin domain 3 (sTIM-3)) were elevated in the LC and MC groups compared to the HCoV and UHC groups (Fig. 1), with no difference observed in the 22 other analytes, including IL-6 and IL-33 (Extended Data Fig. 1). There was no difference between LC and MCs for any individual analyte at this time point (Extended Data Fig. 1a, b). IFN-β was 7.92-fold and 7.39-fold higher in the LC and MC groups compared to the HCoV group and 7.32- and 6.83-fold higher compared to UHCs (Fig. 1a). IFN-λ1 was increased 2.44-fold and 3.24-fold in the LC and MC groups compared to the HCoV group and 2.42- and 3.21-fold compared to UHCs. IL-8 was higher in the LC (3.43-fold) and MC (3.56-fold) groups compared to the HCoV and UHC groups (Fig. 1a). CXCL10 was elevated in the LC group compared to the HCoV (2.15-fold) and UHC (3.2-fold) groups and in the MC group compared to the HCoV (1.7-fold) and UHC (3.06-fold) groups. CXCL9 was 1.69-fold higher in the LC group than in the UHC group, and sTIM-3 was elevated in the LC group, but not the MC group, when compared to the HCoV group (1.46-fold) (Fig. 1a and Extended Data Fig. 1c).
Fig. 1: Elevated levels of proinflammatory cytokines that persist more than 8 months following convalescence. a, Higher levels of IFN-β, IFN-λ1, CXCL9, CXCL10, IL-8 and sTIM-3 at 4 months in the LC group (n = 31) and MC (n = 31) compared to individuals infected with common cold coronavirus (HCoV) (n = 25) and unexposed healthy donors (n = 13). b, Reduction of cytokine levels at 8 months. IFN-β and IFN-λ1 levels were higher in the LC group than the MC group at month 8. c, ACE2 activity increased at months 3 and 4 after SARS-CoV-2 infection and then decreased at 8 months in both groups. ACE2 activity in the HCoV and unexposed healthy donors (UHC) groups was minimal. Data are shown as medians with error bars representing interquartile ranges (IQRs). Kruskal–Wallis with Dunn’s correction was used for the 4-month analysis; two-tailed P values <0.05 (*), <0.01 (**), <0.001 (***) and <0.0001 (****) were considered significant. A Wilcoxon t test was used for paired comparison of 4- and 8-month data, and a Mann–Whitney t test was used for unpaired samples. HCoV, human endemic coronavirus infected; M, months; NS, not significant. Full size image
IFN-β and IFN-λ1 decreased 4.4-fold and 1.8-fold, respectively, in the MC group at month 8 compared to month 4 (Fig. 1b). In the LC group, IFN-β decreased by 1.5-fold, and IFN-λ1 increased by 1.05-fold at month 8 compared to month 4, which was not statistically significant (Fig. 1b). At month 8, IFN-β and IFN-λ1 remained significantly elevated in the LC group compared to the MC, HCoV and UHC groups (Extended Data Fig. 2a). Reductions in CXCL9, CXCL10, IL-8 and sTIM-3 were observed in the LC and MC groups at month 8 compared to month 4 (Fig. 1b). At month 8, there was also decreased expression of some of the 22 analytes that were not significantly different among the four groups at month 4 (Extended Data Fig. 2b,c).
Because plasma ACE2 activity has been reported to be elevated 114 days after SARS-CoV-2 infection16, we investigated whether this occurred in our cohort at months 3, 4 and 8 after infection. Median plasma ACE2 activity was significantly higher in both LC and MC groups compared to the HCoV group at month 3 (LC, 1.92-fold; MC, 2.47-fold) and month 4 (LC, 1.75-fold; MC, 2.62-fold) after infection (Fig. 1c). At month 8, plasma ACE2 activity in the LC and MC groups decreased to levels observed in the HCoV and UHC groups (Fig. 1c). No difference was observed within LC and MC groups at months 3, 4 or 8, but both groups had higher activity compared to the HCoV group, suggesting that this parameter is specific to SARS-CoV-2 infection and is not a common feature of other coronaviruses.
Next, we used a classification model to determine an optimal set of analytes most strongly associated with LC. This linear classifier was trained on log-transformed analyte data to reduce the bias observed in each of the analytes and improve model accuracy. This log-linear classification model was used to develop a metric for feature importance17. To identify analytes that were associated with LC and not MC, we used the analyte data at month 8, the time point with the greatest difference between the LC and MC groups. The performance of each of the log-linear models was quantified by an accuracy estimate and an F1 score evaluated by taking averages after bootstrapping, which randomly sampled from the original population to create a new population. By considering every possible pair of the 28 serum analytes and plasma ACE2 activity, a classification model including two analytes (IFN-β and pentraxin 3 (PTX3)) had an LC prognostic accuracy of 78.54% and an F1 score of 0.77. Three analytes (IFN-β, PTX3 and IFN-γ) achieved an accuracy of 79.68%, with an F1 score of 0.79. Four analytes (IFN-β, PTX3, IFN-λ2/3 and IL-6) achieved an accuracy of 81.59% and an F1 score of 0.81. When all 29 analytes were featured, the calculated accuracy was 77.4%, with an F1 score of 0.76 (Table 2).
Table 2 Accuracy and F1 score (with confidence intervals) for the top two, three and four features and all features identified by machine learning utilizing a log-linear classification model Full size table
After generating 1,000 randomly sampled populations, we counted the number of times each feature appeared in the best performing set of features, combining sets if several sets achieved the same accuracy. This revealed that IFN-β was the most important feature, appearing in 89%, 93% and 94% of the best sets of two, three and four features, respectively (Fig. 2a). Linear classifiers defined a decision boundary. Each patient analyte concentration at month 8 lied on either side of the boundary, and its positioning relative to the boundary determined whether the patient was predicted to experience LC or asymptomatic COVID (Fig. 2b). Although the decision boundary of the four featured analytes at month 8 is four dimensional, the boundary can be visualized with two-dimensional projections of IFN-β against the other highly associated analytes (PTX3, IFN-γ, IFN-λ2/3 and IL-6 (Fig. 2b). Longitudinal levels of these key feature cytokines indicate the advantage of log-linear models in differentiating LC from MCs (Fig. 2c).
Fig. 2: Minimal set of analytes highly associated with LC. a, Representative bar graph of long-linear classification data showing the frequency of analytes appearing as the top features highly associated with LC following 1,000 sampled populations. b, Two-dimensional scatterplot separating LC (red dots) and MCs (blue dots) with a decision boundary (straight light) based on the concentrations of IFN-β and PTX3, IFN-β versus IFN-????, IFN-β versus IFN-λ2/3 and IFN-β versus IL-6. Data points found above the decision boundary have a strong association with LC. c, Representation of the longitudinal levels of the five key cytokines. Data are shown as medians with error bars representing interquartile ranges (IQRs). Two-tailed P values <0.01 (**), <0.001 (***) and <0.0001 (****) were considered significant. A Wilcoxon t test was used for paired samples, and a Mann–Whitney t test was used for unpaired samples. Full size image
To investigate differences in immune cell profiles between LC and MCs, we developed a 19-parameter flow cytometry panel and phenotyped peripheral blood mononuclear cells (PBMCs) from LC and MC donors at months 3 and 8 after infection. Dimensional reduction via TriMap coupled with Phenograph clustering (n = 14; LC = 7, MC = 7) identified 24 distinct cell clusters at month 3 and 21 clusters at month 8 (Extended Data Fig. 3a) including T, B, NK and myeloid cell clusters (Extended Data Fig. 3b,c). Concatenated phenotype data from each of the 7 LC or MC and 7 UHC contributed to every population cluster (Extended Data Fig. 4a–d). Of the 24 subsets identified at month 3, five were absent in LC donors: naive CD127lowGzmB−CCR7+CD45RA+CD27+CD8+ T cells, CD57+GPR56+GzmB+CD8+ T cells, naive CD127loTIM-3−CCR7+CD45RA+CD27+CD4+ T cells, innate-like CD3+CD4−CD8− T cells (may comprise natural killer T cells and γδ-T cells), and naive CD127loTIM-3−CD38lowCD27−IgD+ B cells (Fig. 3a). Three clusters remained absent at month 8 in LC donors (naive CD127lowGzmB−CCR7+CD45RA+CD27+CD8+ T cells, naive CD127lowTIM-3−CCR7+CD45 RA+CD27+CD4+ T cells, and naive CD127lowTIM-3−CD38lowCD27−IgD+ B cells) (Fig. 3b), indicating perturbations at month 8 in LC donors. Naive T and B cells expressing low levels of CD127 and TIM-3 were detected in the MC and UHC groups but were absent in the LC group at months 3 and 8 (Extended Data Fig. 4e,f).
Fig. 3: Distinct activation phenotype in nonlymphoid cells and absence of unactivated naive T and B cells found in LC. a, Dimensional reduction utilizing TriMap and clustering with phenograph was used to visualize immune cell phenotypes. Five populations consisting of unactivated naive and cytotoxic phenotypes were absent in the LC group when compared to MCs at 3 months (n = 14, seven samples per group). Absent populations are outlined in red (middle and right panel), with median percentages of the LC and MC contribution to each cluster population shown in the bar graph. b, Unactivated naive T and B cell populations with low expression of CD127 and no TIM-3 expression remained absent in peripheral blood at 8 months in the LC group (clusters 1, 3 and 5). The phenotypes of the clusters are as follows: (1) CD127lowGzmB−CCR7+CD45RA+CD27+ naive CD8+ T cells, (2) CD57+ highly cytotoxic (GPR56+GzmB+) CD8+ T cells, (3) CD127lowTIM-3−CCR7+CD45RA+CD27+ naive CD4+ T cells, (4) CD3+CD4−CD8− innate-like T cells (may comprise natural killer T cells and γδ-T cells) and (5) naïve CD127lowTIM-3−CD38lowCD27−IgD+ B cells. c, Activated nonlymphoid (myeloid) cells with combined expression of CD38 and HLA-DR in the LC and MC groups at 3 months; levels were not significantly reduced at 8 months in the LC group. Elevated levels of activated monocytes and pDCs were found in the LC group when compared to MCs at 3 and 8 months. d, No difference in PD-1 levels was found on CD4+ T cells, but higher expression by CD8+ T cells was found in the LC group at both time points. Higher TIM-3 expression on CD8+ T cells was observed in the LC group at 3 months. Data are shown as median with IQR. Two-tailed P values <0.05 (*), <0.01 (**), <0.001 (***) and <0.0001 (****) were considered significant. A Wilcoxon t test was used for paired samples, and a Mann–Whitney t test was used for unpaired samples. Full size image
The frequency of highly activated CD38+HLA-DR+ myeloid cells was elevated at month 8 in the LC group compared to MCs (Fig. 3c). Frequencies of activated CD14+CD16+ monocytes were higher in the LC group compared to MCs at months 3 and 8. The percentages of plasmacytoid dendritic cells (pDCs) expressing the activation markers CD86 and CD38 were also higher in the LC group at both time points compared to MCs (Fig. 3c). There was no difference in the frequencies of activated CD11c+ myeloid dendritic cells between month 3 and month 8 (Extended Data Fig. 5a). The T cell activation and exhaustion markers PD-1 and TIM-3 were more highly expressed on CD8+ T cells in the LC group compared to MCs at month 3 (PD-1, 3.04-fold; TIM-3, 1.6-fold) and month 8 (PD-1 2.86-fold) (Fig. 3d). However, PD-1 and TIM-3 coexpression was similar on CD4+ and CD8+ T cells in the LC and MC groups (Extended Data Fig. 5b).
Here, we show that convalescent immune profiles after COVID-19 are different from those following infection with other coronaviruses. Several cytokines (mostly type I and III IFN, but also chemokines downstream of IFN-γ) were highly elevated in individuals following the resolution of active SARS-CoV-2 infection compared to HCoVs and UHCs at month 4 after infection. IFN-β and IFN-λ1 remained elevated in the LC group at month 8 after initial infection, while their levels began to resolve in MCs. Elevated plasma ACE2 activity was noted in the LC and MC groups at month 4 but trended toward normal by month 8 after infection. We identified a set of analytes (IFN-β, PTX3, IFN-γ, IFN-λ2/3 and IL-6) that highly associated with LC at month 8, indicating that components of the acute inflammatory response and activation of fibroblast or epithelial cells, T cells and myeloid cells are associated with LC. Immune cell phenotyping indicated chronic activation of a subset of CD8+ T cells, with expansion of PD-1+ and TIM-3+ subsets and pDCs and monocytes persisting from month 3 to month 8 in the LC group. These changes were accompanied by an absence of naive T and B cell subsets expressing low levels of CD127 and TIM-3 in peripheral blood of patients with LC. These findings suggest that SARS-CoV-2 infection exerts unique prolonged residual effects on the innate and adaptive immune systems and that this may be driving the symptomology known as LC.
IFN-β and IFN-λ1 were highly elevated in convalescent COVID-19 samples compared to HCoV and UHC samples. Although these levels decreased over time in patients who recovered, they remained high in patients with LC. The morbidity of acute COVID-19 infection appears to correlate with high expression of type I and III IFN in the lungs of patients18. IFN-λ produced by murine lung dendritic cells in response to synthetic viral RNA is associated with damage to lung epithelium19, and IFN-λ signaling hampers lung repair during influenza infection in mice20. Severe acute COVID-19 has been associated with diminished type I IFN and enhanced IL-6 and tumor necrosis factor (TNF) responses19. Although our cohort of individuals with LC consisted mostly of patients with mild or moderate initial illness, elevated type I and III IFN levels were maintained to month 8 after infection and are consistent with the observed prolonged activation of pDCs, indicating a chronic inflammatory response.
Patients with COVID-19 who are admitted to the intensive care unit have high plasma levels of sTIM-3 (ref. 21). We found elevated levels of sTIM-3 in the LC group, but not in the MC or HCoV groups, which is consistent with the expanded subsets of memory CD8+ T cells expressing TIM-3 and PD-1 and indicates chronic T cell activation and potentially exhaustion. Similarly, shedding of membrane-bound protein ACE-2 during acute infection22 resulting in increased activity in plasma16 continues into convalescence, regardless of symptom severity at month 4, and normalizes at month 8 in most patients.
We employed a log-linear classification model to assess all combinations of analytes to determine the subset of analytes most strongly associated with LC. IFN-β, together with PTX3, IFN-λ2/3, IFN-γ and IL-6, differentiated LC from MCs with high accuracy at month 8. IFN-λ2/3 are secreted by pDCs following viral RNA sensing by TLR7, TLR9 and RIG-123,24. PTX3 increased in lung epithelia and plasma of patients with severe COVID-19 and can serve as an independent strong prognostic indicator of short-term mortality25,26,27. IL-6 is a pleiotropic mediator that drives inflammation and immune activation28. A high IL-6/IFN-γ ratio is associated with severe acute COVID-19 infection29. The observation that the best correlate for LC is an eclectic combination of biomarkers reinforces the breadth of host response pathways that are activated during LC.
T cell activation (indicated by CD38 and HLA-DR), T cell exhaustion and increases in B cell plasmablasts occur during severe COVID-19 (refs. 30,31,32). These markers identified highly activated monocytes and pDCs, the frequencies of which decreased over time in MCs, but not in patients with LC. Type I and type III IFN upregulate major histocompatibility complex expression, including HLA-DR33. An unbiased large-scale dimensional reduction approach identified the depletion of three clusters of naive B and T cell subsets present in the LC group at month 8 after infection. Altogether, these observations suggest persistent conversion of naive T cells into activated states, potentially due to bystander activation secondary to underlying inflammation and/or antigen presentation by activated pDCs or monocytes. The ultimate result of this chronic stimulation may be expansion of PD-1+ or TIM-3+ CD8+ memory T cells. Bystander activation of unactivated naive subsets into more activated phenotypes is consistent with observations in acute severe COVID-19 (refs. 34,35).
Although individuals with LC and MCs were matched for age and gender, it is possible that the differences observed reflect differences in unrecognized factors between these groups. Although more LC donors had severe acute disease (eight LC donors and two MCs), sensitivity analyses excluding these patients did not alter the statistical significance of the major associations described here. Because of the timing of ethics approval and cohort setup, samples were not collected during acute infection. We were therefore unable to determine whether elevations in biomarkers during convalescence correlate with levels during acute infection. Although some perturbations observed here are potentially consistent with a hypothesis that the major drivers of the expression of biomarkers in convalescence are those in the acute infection, others are not. Our results require validation in other LC cohorts. Finally, our definition of LC was set internally given the lack of international consensus. Nevertheless, the inclusion of three of the most common persisting symptoms and blinding of cases and controls helped ensure the validity of our findings.
In summary, our data indicate an ongoing, sustained inflammatory response following even mild-to-moderate acute COVID-19, which is not found following prevalent coronavirus infection. The drivers of this activation require further investigation, but possibilities include persistence of antigen, autoimmunity driven by antigenic cross-reactivity or a reflection of damage repair. These observations describe an abnormal immune profile in patients with COVID-19 at extended time points after infection and provide clear support for the existence of a syndrome of LC. Our observations provide an important foundation for understanding the pathophysiology of this syndrome and potential therapeutic avenues for intervention.