Setting
We used the electronic healthcare databases of the US Department of Veterans Affairs to conduct this study. The VHA, within the US Department of Veterans Affairs, provides healthcare to discharged veterans of the US armed forces. It operates the largest nationally integrated healthcare system in the United States, with 1,255 healthcare facilities (including 170 VA Medical Centers and 1,074 outpatient sites) located across the United States. All veterans who are enrolled with the VHA have access to the comprehensive medical benefits package of the VA (which includes preventative and health maintenance, outpatient care, inpatient hospital care, prescriptions, mental healthcare, home healthcare, primary care, specialty care, geriatric and extended care, medical equipment and prosthetics). The VA electronic healthcare databases are updated daily.
Cohort
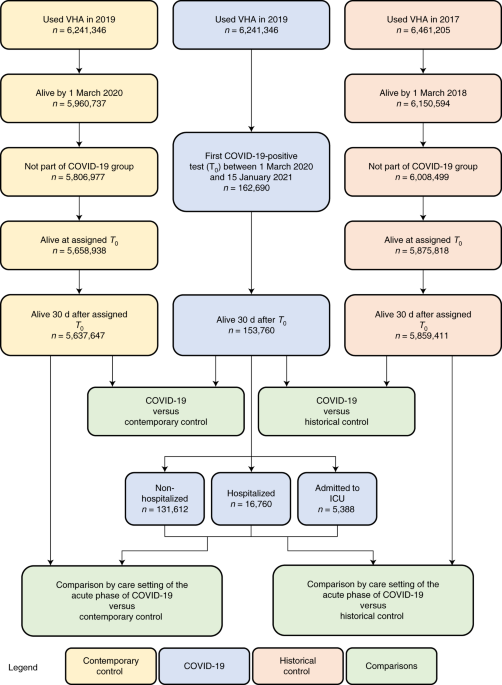
A flowchart of cohort construction is provided in Fig. 1. Of 6,241,346 participants who encountered the VHA in 2019, 162,690 participants who had a positive COVID-19 test between 1 March 2020 and 15 January 2021 were selected into the COVID-19 group. To examine post-acute outcomes, we then selected participants from the COVID-19 group who were alive 30 d after the date of the positive COVID-19 test (n = 153,760). The date of the COVID-19-positive test served as T 0 for the COVID-19 group.
A contemporary control group of people with no evidence of SARS-CoV-2 infection was constructed from those who had encountered the VHA in 2019 (n = 6,241,346). Of those who were still alive by 1 March 2020 (n = 5,960,737), 5,806,977 participants were not in the COVID-19 group and were selected into the contemporary control group. To ensure that this contemporary control group had a similar follow-up time as the COVID-19 group, we randomly assigned T 0 in the contemporary control group based on the distribution of T 0 in the COVID-19 group so that the proportion of people enrolled on a certain date would be the same in both the contemporary and COVID-19 groups. Of 5,658,938 participants alive at the assigned T 0 , 5,637,647 participants in the contemporary control group were alive 30 d after T 0 . In the COVID-19 and contemporary control groups, 31 October 2021 was the end of follow-up.
To examine the associations between COVID-19 and cardiovascular outcomes compared to those who did not experience the pandemic, a historical control group was constructed from 6,461,205 participants who used the VHA in 2017. Of the 6,150,594 participants who were alive on 1 March 2018, 6,008,499 participants did not enroll into the COVID-19 group and were further selected into the historical control group. To ensure that this historical control group had a similar follow-up time as the COVID-19 group, we randomly assigned T 0 in the historical control group with a similar distribution as T 0 minus 2 years (730 d) in the COVID-19 group. Of 5,875,818 historical control participants alive at assigned T 0 , 5,859,411 were alive 30 d after T 0 . In the historical control group, end of follow-up was set as 31 October 2019.
Data sources
Electronic health records from the VA Corporate Data Warehouse (CDW) were used in this study. Demographic information was collected from the CDW Patient domain. The CDW Outpatient Encounters domain provided clinical information pertaining to outpatient encounters, whereas the CDW Inpatient Encounters domain provided clinical information during hospitalization. Medication information was obtained from the CDW Outpatient Pharmacy and CDW Bar Code Medication Administration domains. The CDW Laboratory Results domain provided laboratory test information, and the COVID-19 Shared Data Resource provided information on COVID-19. Additionally, the Area Deprivation index (ADI), which is a composite measure of income, education, employment and housing, was used as a summary measure of contextual disadvantage at participants’ residential locations22.
Pre-specified outcomes
The pre-specified outcomes were selected based on our previous work on the systematic characterization of Long COVID1,23. Incident cardiovascular outcomes in the post-acute phase of COVID-19 were assessed in the follow-up period between 30 d after T 0 until the end of follow-up in those without history of the outcome in the year before T 0 . Each cardiovascular outcome was defined based on validated diagnostic codes. We also aggregated individual outcomes in a related category of composite outcome (for example, stroke and TIA were aggregated to cerebrovascular disease). We also specified two additional composite outcomes: (1) MACE was a composite outcome of all-cause mortality, myocardial infarction and stroke; and (2) the composite of any cardiovascular outcome was defined as the first incident occurrence of any of the cardiovascular outcomes investigated in this study.
Covariates
To adjust for the difference in baseline characteristics between groups, we considered both pre-defined and algorithmically selected high-dimensional covariates assessed within 1 year before T 0 . Pre-defined variables were selected based on prior knowledge1,7,24,25. The pre-defined covariates included age, race (White, Black and Other), sex, ADI, body mass index, smoking status (current, former and never) and healthcare use parameters, including the use number of outpatient and inpatient encounters and use of long-term care. We additionally specified several comorbidities as pre-defined variables, including cancer, chronic kidney disease, chronic lung disease, dementia, diabetes, dysautonomia, hyperlipidemia and hypertension. Additionally, we adjusted for estimated glomerular filtration rate and systolic and diastolic blood pressure. Missing values were accounted for by conditional mean imputation based on value within the group26. Continuous variables were transformed into restricted cubic spline functions to account for potential non-linear relationships.
In addition to pre-defined covariates, we further algorithmically selected additional potential confounders from data domains, including diagnoses, medications and laboratory tests27. To accomplish this, we gathered all patient encounter, prescription and laboratory data and classified the information into 540 diagnostic categories, 543 medication classes and 62 laboratory test abnormalities. For the diagnoses, medications and laboratory abnormalities that occurred in at least 100 participants within each group, univariate relative risk between the variable and exposure was calculated, and the top 100 variables with the strongest relative risk were selected28. The process of algorithmically selecting the high-dimensional covariates was independently conducted for each outcome-specific cohort in each comparison (for example, the COVID-19 versus contemporary control analyses to examine incident heart failure and the COVID-19 versus historical control analyses to examine incident heart failure).
All pre-defined and algorithmically selected covariates were used in the models.
Statistical analyses
Baseline characteristics of the COVID-19 and contemporary and historical control groups, along with standardized mean difference between groups, were described.
We then estimated the risks, burdens and excess burdens of incident cardiovascular outcomes for COVID-19 compared to the contemporary control group and, separately, compared to the historical control group, after adjusting for differences in baseline characteristics through inverse probability weighting. To estimate the risk of each incident cardiovascular outcome, we built a subcohort of participants without a history of the outcome being examined (that is, the risk of incident heart failure was estimated within a subcohort of participants without history of heart failure in the year before enrollment). In each subcohort, a propensity score for each individual was estimated as the probability of belonging to the VHA users group in 2019 (target population) based on both pre-defined and algorithmically selected high-dimensional variables. This propensity score was then used to calculate the inverse probability weight as the probability of belonging in the target population divided by 1 − the probability of being in the target population. Covariate balance after application of weights was assessed by standardized mean differences.
HRs of incident cardiovascular outcomes between the COVID-19 and contemporary cohorts and the COVID-19 and historical cohorts were estimated from cause-specific hazard models where death was considered as a competing risk, and the inverse probability weights were applied. Burden per 1,000 participants at 12 months of follow-up and the excess burden based on the differences between COVID-19 and control groups were estimated.
We conducted analyses in subgroups by age, race, sex, obesity, smoking, hypertension, diabetes, chronic kidney disease, hyperlipidemia and cardiovascular disease. And, separately, we undertook analyses in a cohort without history of any cardiovascular outcomes before cohort enrollment.
We then developed causal difference-in-differences analyses to estimate the adjusted incident rate ratios of all cardiovascular outcomes in the pre-COVID-19 and post-COVID-19 exposure period relative to both contemporary and historical controls29,30,31,32. To enhance the interpretability of difference-in-difference analyses, the pre-exposure period was defined as with same follow-up time as the post-exposure period, and the incident rate ratio for the pre-exposure period was examined within those without history of the outcome within 1 year before the period. Incident rate ratios for all groups in the pre-exposure and post- exposure periods were weighted toward the common target population (VHA users in 2019) based on pre-exposure characteristics. The adjusted incident rate ratios in the pre-exposure and post-exposure periods were then compared. Difference-in-differences analyses were also conducted in mutually exclusive groups according to care setting of the acute phase of the disease. We also evaluated the associations between COVID-19 and risks of post-acute cardiovascular sequelae in mutually exclusive groups according to care setting of the acute phase of the disease (that is, whether people were non-hospitalized, hospitalized or admitted into the intensive care unit during the first 30 d of infection). Inverse probability weights were estimated for each care setting group using the approach outlined in the previous paragraph. Cause-specific hazard models with inverse probability weighting were then applied, and HRs, burdens and excess burdens were reported.
We conducted multiple sensitivity analyses to test the robustness of our study results. (1) To capture additional potential confounders, we expanded our inclusion of high-dimensional variables from the top 100 to the top 300 when constructing the inverse probability weight. (2) We then modified our adjustment strategy by using only pre-defined variables when constructing the inverse probability weight (not including the 100 high-dimensional covariates used in the primary analyses). Finally, (3) we alternatively applied a doubly robust approach, where both covariates and the inverse probability weights were applied to the survival models, to estimate the associations33.
COVID-19 is associated with an increased risk of fatigue in the post-acute phase of the disease, which is generally considered as a signature post-acute sequela34. To test whether our approach would reproduce known associations, we, therefore, examined the association between COVID-19 and fatigue as a positive outcome control. Reproducing this known association (using our data, cohort design and analytic strategy) would provide some measure of assurance that our approach yields result consistent with a priori expectations.
We also subjected our approach to the application of a battery of negative-outcome controls where no prior knowledge supports the existence of a causal association between the exposure and the risks of negative-outcome controls35. The negative-outcome controls included hypertrichosis, melanoma in situ, sickle cell trait, perforation of the tympanic membrane, malignant neoplasm of the tongue, B cell lymphoma and Hodgkin’s lymphoma. We also developed and tested a pair of negative-exposure controls (defined as exposure to influenza vaccine in odd-numbered or even-numbered calendar days between 1 March 2020 and 15 January 2021). Our pre-test expectation was that there would be no differences in risk of any of the pre-specified cardiovascular outcomes examined in this analysis between those who received influenza vaccine in odd-numbered versus even-numbered calendar days. The successful application of negative controls might reduce concern about the presence of spurious biases related to cohort building, study design, covariate selection, analytic approaches, outcome ascertainment, residual confounding and other sources of latent biases.
Estimation of variance when weightings were applied was accomplished by using robust sandwich variance estimators. In all analyses, a 95% confidence interval that excluded unity was considered evidence of statistical significance. This study was approved by the institutional review board of the VA St. Louis Health Care System (protocol number 1606333), which granted a waiver of informed consent. Analyses were conducted using SAS Enterprise Guide version 8.2 (SAS Institute), and results were visualized using R version 4.04.
Ethical approval
This research project was reviewed and approved by the institutional review board of the VA St. Louis Health Care System (protocol number 1606333).
Reporting Summary
Further information on research design is available in the Nature Research Reporting Summary linked to this article.