Unevenly distributed livestock production
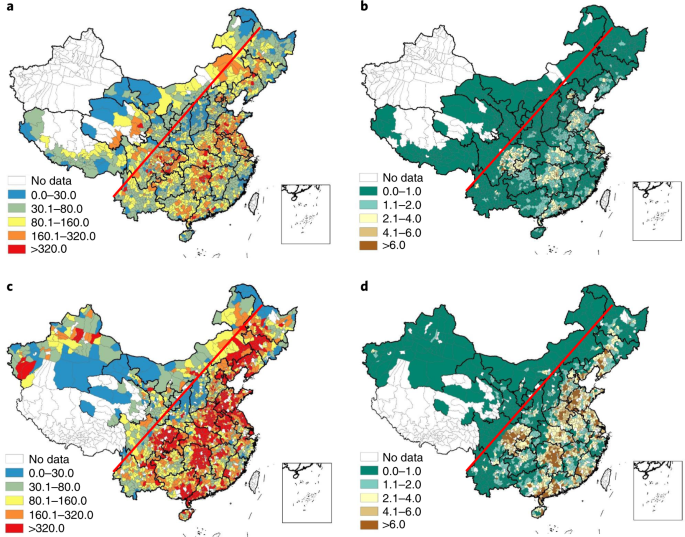
The livestock population in China increased by 80% between 1990 and 2012, from 240 to 430 million standard livestock units (LU). A standard livestock unit equals a 500 kg dairy cow19. About 98% of the increase occurred to the right of the Huhuanyong Line (Hu Line) (Fig. 1a,c). The main livestock production counties (that is, counties with more than 320,000 LU), contributed 9.2% to the total LU in 1990 and 55% in 2012 (Fig. 1a,c and Extended Data Fig. 1). The geographic connection between crop and livestock production greatly decreased between 1990 and 2012, as reflected by the rapid increase in livestock density and the increasing ratio of annual manure nitrogen excretion to annual crop nitrogen uptake in some counties (Fig. 1b,d and Extended Data Fig. 2). Over 37% of the counties to the right of the Hu Line had a livestock density >4.0 LU ha−1 in 2012 (Fig. 1b,d and Extended Data Fig. 1). For comparison, Denmark regulates maximum livestock density to 2.0 LU ha−1 to limit nutrient pollution by livestock production20. A livestock density of ≤2 LU ha−1 is a rough indication that the produced manure nutrients can be absorbed by the growing crops in that area, depending also on soil and climatic conditions and management.
Fig. 1: Geographic distribution of livestock production. a–d, Maps describing livestock production in terms of livestock population (1,000 LU) (a,c) and livestock density (LU per hectare of agricultural land) (b,d) at county level in China in 1990 (a,b) and 2012 (c,d). Note: there are 34 provinces and 2,850 counties in China. The red line represents the Huhuanyong Line. Full size image
The concentration of livestock production in regions is not unique to China; it has been observed in many developed and emerging countries, including the United States (Extended Data Fig. 3). The ratio of annual manure nitrogen excretion to annual crop nitrogen uptake was >2.0 in 11% of the 3,100 counties in the United States in 1992 and in 22% of the counties in 2012. The contribution of these counties to the total manure nitrogen production has increased from 21% to 32% between 1992 and 201221 (Extended Data Fig. 3). Although the United States and China have roughly similar areas of land and cropland, the numbers of humans and livestock are much larger in China, and hence the concentrations of humans and livestock in specific regions are much higher in China than in the United States (Extended Data Figs. 2 and 3). The ratio of synthetic fertilizer nitrogen use to crop nitrogen uptake has a different geospatial trend to the ratio of manure nitrogen excretion to crop nitrogen uptake in the United States than in China. This suggests that more manure nitrogen was recycled effectively and substituted for synthetic fertilizer nitrogen in the United States than in China. This has resulted in a relatively low fertilizer nitrogen application rates in livestock-dense regions in the United States compared with those in China in 2012 (Extended Data Fig. 3).
Driving forces of uneven livestock distribution
The location of livestock farms is influenced by several factors, such as vicinity of markets, traffic infrastructure, availability of animal feed, availability of animal health and epidemic prevention services, and slaughter and milk processing services9,22,23,24. Concentration of livestock production near markets contributes to improving livestock production efficiency, lowering production costs and shortening the delivery distances25,26. Our panel data analysis showed that the livestock production of a county was significantly and positively correlated with human population and gross domestic product, suggesting that the thickness of local demand played an important role in shaping the geospatial patterns of livestock production during the period 1990–2012 (Extended Data Table 1). River intensity had a significant positive correlation with livestock density in the no-fixed-effects model (Extended Data Table 1). Feed availability (measured by the production of maize and soybean of a county) and feed accessibility (measured by the road length of a county) were also not significantly related to livestock density in the fixed-effects model analysis (Extended Data Table 1).
Nitrogen pollution impacted by unevenly distributed livestock
There were positive correlations between livestock density, NH 3 emissions and nitrogen losses to water in counties in 1990 and 2012 (Fig. 2). There was also positive correlation between livestock density and average synthetic nitrogen fertilizer use per hectare of cropland in counties in 1990 and 2012, which indirectly suggests that little or no synthetic fertilizer nitrogen was replaced by animal manure nitrogen (Fig. 2). The slightly higher slope of the linear regression between livestock density and NH 3 emission intensity in 1990 than in 2012 is probably related to lower crop–livestock integration and to improved animal feeding in 2012 compared to 1990. The uneven distribution of livestock production at county level led to a summed manure surplus of 1.8 TgN in 1990 and of 4.6 TgN in 2012 (Fig. 3b). Manure nitrogen surplus is defined here as the difference between total manure nitrogen excretion and total crop nitrogen demand, corrected for the supply of nitrogen by soil, crop residues, waste, biological N 2 fixation and atmospheric deposition (thus without synthetic fertilizer nitrogen), at county level (for more detail, see equation (3)). Hence, this manure nitrogen surplus could not be recycled in cropland and thus was largely lost to air and water bodies5. At the same time, there was a rapid increase in synthetic nitrogen fertilizer use, which hindered the effective recycling of livestock manure nitrogen further3,5.
Fig. 2: Relationships between livestock density, NH 3 emissions and nitrogen losses in 1990 and 2012. a–d, Relationships between livestock density and average NH 3 emission intensity (a), reactive nitrogen losses to surface waters (b), synthetic nitrogen fertilizer use (c) and total nitrogen surplus (d) (including the nitrogen from synthetic fertilizer) at county level in 1990 and 2012. Counties with average livestock density >3 times the standard deviation of the average livestock density (3.7 LU ha−1 in 1990 and 4.3 LU ha−1 in 2012) were excluded from the analysis. The calculated NH 3 emissions are not independent of livestock density because a higher livestock density usually produces more manure nitrogen which is vulnerable to NH 3 emissions. The blue dots represent data in 1990, and green dots represent data in 2012. Full size image
Fig. 3: Nitrogen use, surplus and loss, and NH 3 emissions for various scenarios. a, Total synthetic nitrogen fertilizer use. b, Cumulative manure nitrogen surplus due to uneven distribution of crop and livestock production. c, Total NH 3 emissions. d, Total nitrogen losses from the whole food system to watercourses. e, The percentage of counties exceeding the UN-recommended NH 3 emission intensity threshold value (31 kgNH 3 -N per hectare of agricultural land). f, The percentage of people living in these counties. Manure nitrogen surplus is defined as the difference between total manure nitrogen excretion and total crop nitrogen demand, corrected for the supply of nitrogen by soil, crop residues, wastes, biological N 2 fixation and atmospheric deposition (thus without synthetic fertilizer nitrogen), at county level (see equation (3)). Values are given for 1990, 2012 and for four different scenarios (BAU, SNT, ITI, SP-NH 3 and S-CLI) in 2050. Full size image
Average airborne PM 2.5 concentrations in a county were more positively correlated with livestock nitrogen excretion per county, rather than with fertilizer nitrogen input, or with airborne SO 2 and NO x concentrations (Extended Data Fig. 4). Regions with high airborne PM 2.5 concentrations correlated with regions with high livestock density. High PM 2.5 concentrations contribute to respiratory diseases; there were 1.8 million people aged >65 years with premature mortality related to PM 2.5 exposure in China in 201227, and over 60% of these deaths occurred in regions in which PM 2.5 concentration was substantially correlated with livestock nitrogen excretions (Extended Data Fig. 4).
Impacts of livestock production in 2050
It is probable that China will continue to suffer from unevenly distributed livestock production in the near future, especially with the predicted increase in the demand for livestock products. Domestic crop production and livestock production are projected to increase by 20% and 40%, respectively, in terms of protein production between 2012 and 2050 according to a business-as-usual (BAU) scenario28. As a result, total NH 3 emissions and nitrogen losses to water bodies will increase by 12% between 2012 and 2050 (Fig. 3c,d). The modest increases of nitrogen losses to the environment in the BAU scenario reflect the balance between the expected increased production and hence increased nitrogen losses, and the expected impacts of policies and measures to decrease these losses (for example, Zero Fertilizer Action29,30, improved crop husbandry practices, improved irrigation and nutrient management31,32 and the replacement of fertilizer nitrogen by manure nitrogen33). The policies and measures together will reduce the average nitrogen losses per unit of crop product and especially per unit of animal product produced.
Around 26% of counties will have a livestock density >4.0 LU ha−1 and these counties will accommodate 58% of total LU in the BAU scenario in 2050 (Fig. 4a and Extended Data Fig. 1). This will result in a summed manure nitrogen surplus of 11 Tg; a surplus that cannot be recycled to cropland in an economically feasible and environmentally sound manner (Fig. 3b). This surplus may have to be converted to N 2 via nitrification and denitrification process technologies or converted into desired manure nitrogen products, which would allow transport between counties in an economically feasible manner. The mean NH 3 emission intensity will exceed the suggested threshold of 31 kgNH 3 ha−1 in 56% of counties in the BAU scenario; the NH 3 emission intensity threshold is one of the criteria for achieving Sustainable Development Goal 234. Around 60% of China’s population will live in regions with NH 3 emission intensities higher than 31 kgNH 3 ha−1 in the BAU scenario in 2050 (Fig. 3e,f).
Fig. 4: Livestock density, NH 3 emission intensity and nitrogen losses to watercourses in 2050 for five scenarios. a–o, Livestock density (LU ha−1) (a,d,g,j,m), average NH 3 emission intensity (kgNH 3 -N ha−1) (b,e,h,k,n) and average nitrogen losses to watercourses (kgN ha−1) (c,f,i,l,o) in 2050 for five scenarios: BAU (a–c), SNT (d–f), ITI (g–i), SP-NH 3 (j–l) and SP-CLI (m–o). Full size image
Impacts of pig relocation and improved technologies
The south-to-north transfer of pigs (SNT) scenario follows the pig relocation policy of the national government as proposed in 2017; it will reduce nitrogen losses to water bodies by 52% when compared to the BAU scenario due to the transfer of pigs from the watercourse-dense south to the semi-arid north. However, NH 3 emissions will increase by 13% in the SNT scenario compared to BAU, in part due to a higher manure nitrogen recycling because discharge of manure from intensive livestock farms to watercourses has been banned (Fig. 3 and Extended Data Fig. 5). Much of the increase of the NH 3 emissions will occur in northern China, where air pollution is most serious (Fig. 4b,e). Thus, the SNT scenario leads to pollution swapping from south to north: swapping water pollution in the south for air pollution in the north35,36.
In the integrated technology improvement (ITI) scenario, synthetic fertilizer nitrogen use, NH 3 emissions and nitrogen losses to water will reduce by 82%, 63% and 77%, respectively, compared with the BAU scenario (Fig. 3a–d). Evidently, the improved recycling of livestock and human excreta, food waste and crop residues contributed to the substitution of synthetic fertilizers, and reduced nitrogen losses greatly6. However, a total of 11 Tg of manure nitrogen could not be effectively recycled due to the geographic separation of crop and livestock production systems in the ITI scenario. In addition, 40% of the population will still live in counties with NH 3 emission intensities higher than the threshold value of 31 kgNH 3 ha−1 yr−1 (Fig. 3f).
Impacts of livestock spatial planning
Based on optimized spatial planning in the NH 3 emission intensity criteria (SP-NH 3 ) scenario, which was developed on top of the ITI scenario, we estimate that some 10 billion animals need to be relocated to be able to achieve a lower NH 3 emission intensity for most of the population of China (Extended Data Fig. 6). This number is equivalent to 344 million LU, and includes 484 million pigs, 10 million dairy cattle, 30 million beef cattle, 9,300 million chickens, 146 million sheep and goats, and 1.5 million mules and donkeys (Extended Data Fig. 6). The number accounts for 56% of the domestic livestock population in the SP-NH 3 scenario, and is equal to the current livestock populations of the United States and the Russian Federation combined30. Livestock need to be transferred mainly from southern and eastern China to north and southwest China (Extended Data Fig. 6). About 15% of the livestock need to be relocated within provincial borders, mainly to shorten the transportation distance to ensure the stability of food supply and reduce transportation costs (Extended Data Fig. 7).
In the SP-NH 3 scenario, total NH 3 emissions to air and nitrogen losses to water bodies will decrease by 60–70% compared with the BAU scenario. However, the SP-NH 3 scenario had slightly higher total NH 3 emissions to air and total nitrogen losses to water bodies than the ITI scenario (Fig. 3c,d). However, the SP-NH 3 scenario decreased the proportion of people in counties with exposure to NH 3 emissions higher than the threshold value compared with the BAU and ITI scenarios (Fig. 3e,f). Regions exceeding the NH 3 emission intensity threshold value were mainly found in semi-arid intensive cropping areas, that is, mainly in the North China Plain (Fig. 4k). Manure nitrogen surplus and synthetic nitrogen fertilizer use were higher in the SP-NH 3 than in the ITI scenario (Fig. 3a,b). This is counter to the objective to decrease manure nitrogen surplus and fertilizer nitrogen use through improved manure nitrogen recycling. Evidently, there is a trade-off here between keeping the NH 3 emission intensity below the threshold value and bringing livestock production more closely to cropland.