1. Introduction
2 emissions of digital technology increased by 450 million tons since 2013 globally [ Everything we do in our daily life has some impact on the environment. Human awareness and the social responsibility of business are important for sustainability’s sustained improvement. Even though the internet and technological advances have improved human lives (e.g., communication, sanitation, transportation, health care, and entertainment), there are still some drawbacks of technology. Consider, for instance, environmental sustainability. Each online activity comes with a cost as it causes a few grams of carbon footprint emission, especially due to the data centers and servers needed to support the internet. Online services are associated with a carbon footprint from data centers, network infrastructures, and other heavy devices. For instance, COemissions of digital technology increased by 450 million tons since 2013 globally [ 1 ]. It is still an arguable and debated topic, as to how this carbon footprint is best calculated. Therefore, we try here to analyze how much carbon dioxide is generated by online activity and to compare the results of four different calculation methods.
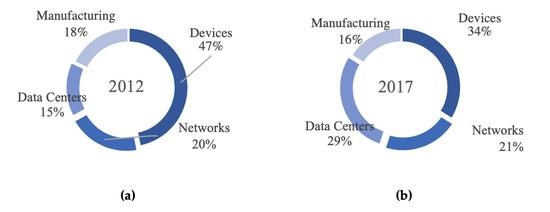
As of today, data centers are mostly used for organizational emails, internet, and online social interaction activities. A data center is a group of computer servers designed for processing, storing, and distributing a large amount of data. The main purpose of the data center is to manage user interactions with server-based software tools and web portals. Generally, data centers consist of 15 components such as redundant computing hardware setups, infrastructure, connectivity, cabling system, energy production system, networks, uninterrupted power supply, and automatic transfer switch devices [ 2 ]. From the architectural perspective, the datacenter can be on-premises, hybrid or cloud-based. The hybrid data center is a combination of on-premises and cloud-based infrastructure that allows data to be shared over the network. Generally, the data center architecture is based on business needs.
2 while office buildings consume 7–10 W/ft2. From 2000 and 2005, data center energy usage increased by 16.7%, then by 56% between 2005–2010 per year. Data center energy consumption amounted to 205 TW in 2018 and the amount rose to 416 TW in 2020 globally [ Data centers are basically huge devices that consume high electrical power, water for cooling, and produce heat. A typical data center consumes 100 W/ftwhile office buildings consume 7–10 W/ft. From 2000 and 2005, data center energy usage increased by 16.7%, then by 56% between 2005–2010 per year. Data center energy consumption amounted to 205 TW in 2018 and the amount rose to 416 TW in 2020 globally [ 3 ]. As a result of Moore’s law, global data centers might consume between 658 TW and 752 TW per hour by 2030. In recent years, user-to-data center IP traffic has been increased due to a large volume of data transfer such as live video streaming or videos. According to Cisco Systems’ data center, the annual growth of each component between 2016 and 2020 is as follows: application workloads—18.6%, storage—31.2%, networking—24.7%, respectively. Comparing traditional data centers to cloud data centers, a cloud data center is more efficient in terms of energy consumption. IP traffic, due to 5G and mobile device usage, is estimated to increase at 25.2% average growth for data-to-user and at 32.7% for data center-to-data center traffic. Data center storage will also increase to meet a growth of social networking storage needs of 35.6% and 37% exclusively in 2021 [ 4 ].
Data centers consume a lot of energy and water, which contributes to carbon dioxide emissions that are harmful to the environment. However, data centers have been redesigned by means such as reducing water consumption using water-cooling technology, green power to reduce electricity consumption, and recycling programs, in order to reach sustainability goals. The growth in data centers and electricity use of servers increase carbon dioxide (CO2) emissions. While there is an industry adopted metric of PUE (power usage effectiveness) defined by the Green Grid consortium, there is currently no commonly agreed methodology of measuring the PUE because data center operators can define non-IT facility/IT equipment energy differently [ 2 ].
2 /kWh. In contrast, average coal mining factory emissions are 4 times less than data centers—around 1 kg CO 2 /kWh. A globally increasing number of internet users creates a demand for data center services while new forms of technology and information services accelerate the demand rapidly. Another example is that watching 30 min of Netflix generates 1.6 kg of CO 2, which is the same as driving 4 miles. Netflix streaming services consume 370 TWh per year which is 1.8 times larger than the combined total for the world’s data centers [ According to U.S. Energy Information Administration (2020), the global data centers consumed 205 billion kWh, using around 4.4 kg CO/kWh. In contrast, average coal mining factory emissions are 4 times less than data centers—around 1 kg CO/kWh. A globally increasing number of internet users creates a demand for data center services while new forms of technology and information services accelerate the demand rapidly. Another example is that watching 30 min of Netflix generates 1.6 kg of COwhich is the same as driving 4 miles. Netflix streaming services consume 370 TWh per year which is 1.8 times larger than the combined total for the world’s data centers [ 5 ].
One of the Shift Project findings was that one hour of watching online video streaming consumes 6.1 kWh which is the same as driving an electric car more than 30 km, using LED power for more than a month constantly, or boiling a kettle for three months. Recent studies have shown how much energy and electricity have been consumed for Information Communication Technology but how this online habit impacts the environment is less analyzed. Understanding environmental sustainability and consumption behaviors are the most important factors of being sustainable. However, individuals have less information about how our daily simple internet surfing habits contribute to carbon footprint [ 6 ].
Energy and electricity consumption are getting more demanding due to the internet of things and blockchain technologies. There are 23 papers that estimated the carbon footprint of data centers, networks, or general consumption of ICT (Information and Communication Technology). However, some papers overestimated or underestimated electricity consumption by not including the contribution of data centers. Therefore, this paper aims to define the carbon emission of top-visited online applications using four different calculation formulas. The paper consists of two main sections. The first presents previous research papers and findings on this topic and the second presents an analysis and estimation of online activities used by many people.