The Meta-Analysis of Observational Studies in Epidemiology (MOOSE) guidelines have been used for reporting this meta-analysis20. The protocol of the study was registered at Open Science Framework (https://osf.io/tvam2; registered form: osf.io/4vu5s; registration https://doi.org/10.17605/OSF.IO/TVAM2).
Search strategy
We performed a comprehensive systematic search on all literature issued earlier than April 2021 in online databases including PubMed/Medline, Scopus and ISI Web of Science. We did not exert any limitation in term of language or time of publication. We used search terms relevant to type 2 diabetes, carbohydrate, and study design to find potential eligible cohort studies (Supplementary Table 1). Reference lists of retrieved articles and relevant reviews were also manually searched. Unpublished data was not included.
Inclusion and exclusion criteria
Relevant articles with all of the following inclusion criteria were included: (1) published prospective cohort studies conducted in the general population; (2) reported carbohydrate consumption (as either g/d or percentage energy) and LCDS as exposure; (3) considered T2D incidence as the outcomes of interest; (4) provided estimates of the effect size in the form of relative risk, hazard ratio (HR) or rate ratio with corresponding 95% confidence intervals (CIs) for ≥ 2 quantitative categories of carbohydrate consumption or LCDS; and (5) provided the numbers of cases and non-cases or person-years in each category of dietary carbohydrate or LCDS. Studies that reported continuous estimation from the associations were also included. For duplicate publications form the same cohort, the one with the greater number of cases was included in our meta-analysis. We excluded letters, comments, reviews and meta-analyses, and ecologic studies. We also did not include studies that were performed on children or adolescences or those that were conducted among patients with type one diabetes. All outcomes were classified based on the World Health Organization’s international classification of disease criteria.
Data extraction
Data extraction process was executed by two reviewers in duplicate (FH and AJ), and any divergences were resolved by consultation the principal investigator (SS-B). We extracted the following information from the publications identified: name of the first author, publication year, country, age, sex, study participants, number of cases, duration of follow-up, method of assessment of carbohydrate consumption and LCDS, the fully-adjusted estimates and their 95%CI and list of potential confounders entered into the multivariable statistical model. Gender-specific estimates were combined a by fixed-effects model to include each cohort once in the main analysis. We used web plot digitizer (http://plotdigitizer.sourceforge.net/) to extract numerical estimates from graphs.
Data synthesis and analysis
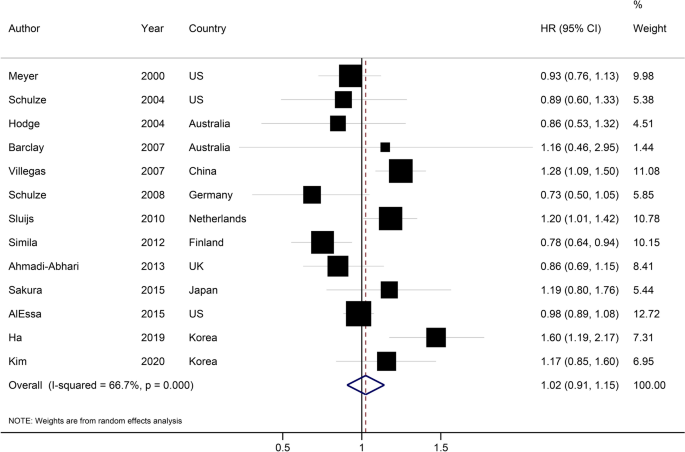
We considered the HR and its 95%CI as the effect size for the present study. Relative risks were considered equal to HR21. We first performed a pairwise meta-analysis by combining the reported effect sizes for the highest compared with the lowest category of dietary carbohydrate or LCDS in each study. Study-specific results were combined with a random-effects model22. The Cochran Q23 and I2 statistic24 were used to test for presence of heterogeneity.
Subgroup analyses of dietary carbohydrates were performed based on sex, geographic location, number of cases, duration of follow-up and adjustments for main confounders including body mass index (BMI), smoking status, alcohol drinking, and energy and fiber intakes. P value for subgroup difference was generated using meta-regression analysis. Subgroup analyses of LCDS were performed based on sex, study location, and duration of follow-up. Publication bias was assessed by visual inspection of funnel plot23 and Egger’s25 and Begg’s26 tests, when at least 10 studies were available. To determine whether the pooled effect size was influenced heavily by a single cohort, sensitivity analysis was done by step-by-step omission of each cohort at a time.
We used the method introduced by Greenland27 and Orsini28 for dose–response meta-analysis. We calculated the HRs for a 10% increment in carbohydrate intake or a 10-point increment in LCDS in each study. Study-specific HRs were combined by a random-effects model. For this purpose, each cohort study must report the number of cases and person-years and median or range of dietary carbohydrate or LCDS across categories of exposures. For studies that reported dietary carbohydrate as g/d, we converted g/d to percentage calorie from carbohydrate by using the average daily energy intake of the study participants. For studies that reported the results per unit increment in dietary carbohydrate (i.e., per 200 g/d increment), we first converted g/d to percentage energy from carbohydrate and then translated it to a 10% increment in energy intake from carbohydrate. For studies that used different units (for example, 5% increase in carbohydrate intake), we calculated the logarithm of the HR and its 95%CI, multiplied by the corresponding unit, and then exponentiated the results. For studies that reported carbohydrate intake as a range in each category, we used the midpoint of lower bounds as a proxy of the median. The widths of the open-ended categories were considered equal to the closest categories.
Finally, we performed a one-stage weighted mixed-effects meta-analysis to model dose–response associations29. This method estimates the study-specific slope lines and combines them to obtain an overall average slope in a single stage. We included all studies in the main analysis. However, due to substantial difference in carbohydrate consumption in Asian and Western countries, we performed separate nonlinear dose–response analyses in Asian and Western countries. Statistical analyses were conducted using STATA software, version 15.0. P < 0.05 was considered statistically significant.
Quality assessments and grading the evidence
The quality of the original studies included in the present meta-analysis was evaluated using a 9-point Newcastle–Ottawa Scale by two independent investigators (FH and AJ)30. Accordingly, studies with 1–3, 4–6, and 7–9 points were rated as poor, fair, and high quality, respectively. The certainty in the estimates was rated by the Grading of Recommendations Assessment, Development, and Evaluation (GRADE) approach. GRADE tool is a metric to assess the certainty of the evidence31. This tool grades observational studies as low with downgrades for study limitations, inconsistency, indirectness, imprecision, and publication bias, and upgrades for large effect size, dose–response gradient, and attenuation by plausible confounding.