The study complied with all relevant ethical and legal regulations, and all procedures were approved by the Institutional Animal Care and Use Committee of the University of California, Davis.
Subjects and living arrangements
Our target cohort comprised n = 89 (56 females) infant rhesus monkeys (Macaca mulatta) born in 2019 at the California National Primate Research Center. Mean age of the animals was 109.1 days (SD = 7.96 days, range = 90–124 days) at the time of testing in the BioBehavioral Assessment (BBA) program (see below). Conception was defined as the date of birth minus 165 days, reflecting the mean gestation at our facility45, and ranged from 9 Oct 2018 to 27 Dec 2018. Animals were classified as exposed (n = 52, 37 females) to WFS if their conception date was 22 Nov 2018 or earlier, and non-exposed (n = 37, 19 females) if conception occurred on 23 Nov 2018 or later.
A control cohort of n = 2490 animals (1336 females) was drawn from the larger BBA database based on the following criteria: reared in the same outdoor environments as the target cohort; born between 2001 and 2018; and conceived between 9 October and 27 December of the year prior to birth. Animals were classified as in our target cohort, with those conceived between 9 October and 22 Nov (n = 1812, 976 females; the early control group) contrasted with animals conceived from 23 Nov to 27 Dec (n = 678, 360 females, the late control group) to match the exposed and non-exposed groups in 2018. Mean age was 109.2 (SD = 9.33, range = 88–133 days) at time of BBA testing.
All animals were born and reared in outdoor field corrals built of pipe and chainlink, and measuring 0.2 ha in area, each containing up to 200 animals of all ages, with a population structure approximating that seen in the wild. Animals were fed twice daily, water was continuously available, fresh produce was given once or twice per week, and each cage contained a variety of climbing and shelter structures.
Air quality
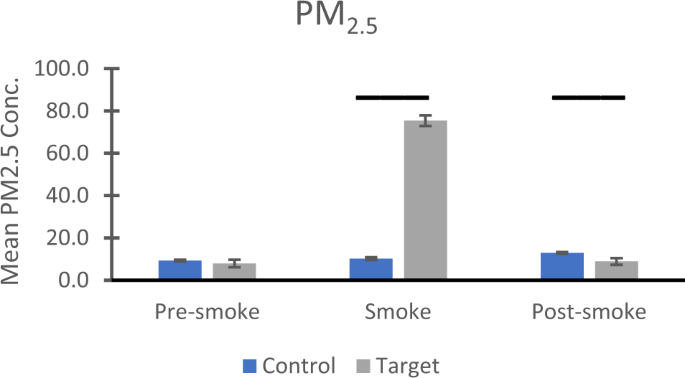
Mean daily values for PM 2.5 from 2003 to 2018 were obtained from a dedicated air quality monitoring site on the University of California, Davis campus, operated by the California Air Resources Board (https://www.epa.gov/outdoor-air-quality-data/download-daily-data). The monitoring instrument is a Met One BAM 1020. For 2000–2002 PM 2.5 data, we relied on data from a site located in Woodland ~19 km from CNPRC, which used Anderson RAAS2.5-300 and R&P Model 2000 units for PM 2.5 measurements. For the years 2003 and 2004, we had data for n = 48 dates from both the Davis and Woodland sites, which correlated strongly (r = 0.957, p < .001) with no mean difference (t(47) = −1.030, p = .308). Consequently, we combined the data from the two locations to assess air quality for our entire control cohort from 2000 to 2017.
BioBehavioral Assessment (BBA) program
Details of the BBA program have been published46,47. Briefly, mothers and infants were net captured from their field corrals, separated from each other, and delivered to the indoor testing room (infants) or to holding cages (mothers) that were outside sensory range of the infants. Three-to-four month old infants, which were always tested in cohorts of 5–8 animals, arrived at 0900 h, and were housed individually in standard-sized holding cages (0.58 m × 0.66 m × 0.81 m, Lab Products, Maywood, NJ). A variety of behavioral assessments were performed throughout the day and early the next day. Infants were returned to their mothers at 1000 h the following day, where they were given an hour to nurse prior to return to their corrals with their mothers. Each infant holding cage contained a stuffed cloth toy duck, a towel, and a novel object that the infants could manipulate. Infants were provided with water ad libitum, orange-flavored drink, fresh fruit, rice cereal, and commercial monkey chow. Monkeys from the target and control cohorts experienced identical procedures at the same times of day. Four sets of assessments were examined in the present report.
Physiological data were obtained from two blood samples obtained on the first day of BBA testing. Sample 1 (1 ml) was drawn at 1100 h, approximately two hours after subjects were separated and relocated – sample 1, therefore is a stress sample. Sample 2 (0.5 ml) was obtained at 1600 h, and reflects animals’ responses to sustained stress. In all cases, blood was drawn into unheparinized syringes from a femoral vein following manual restraint, and was immediately transferred to tubes containing EDTA. 0.5 ml from sample 1 was delivered to CNPRC’s Clinical Laboratory for analysis of C-reactive protein. The remaining 0.5 ml from sample 1, and the 0.5 ml from sample 2 were spun in a refrigerated centrifuge at 4 °C for 10 min at 1277 g. Plasma was removed and frozen at −80° until assay.
Cognitive data were provided by a test of Visual Recognition Memory, administered at 1130 h on Day 1. Each animal was hand-carried to a test cage measuring 0.387 m × 0.413 m × 0.464 m that was positioned 0.686 m from a 0.813 m monitor (Panasonic KV 32540), was given 30 s to habituate, and was presented with seven problems from a pre-recorded video. Each problem included three trials, a familiarization trial and two recognition trials. After a 5 s blank screen, a 20 s familiarization trial began, in which two identical pictures were presented, each measuring 19.7 cm × 22.9 cm, separated by 25.4 cm of white space onscreen. After another 5 s delay, an 8 s recognition trial occurred, in which the now-familiar stimulus was presented simultaneously with a novel stimulus (side determined randomly). Following another 5 s delay, the same two stimuli were presented again for 8 s, with positions reversed. Seven such problems were presented. All stimuli were pictures of unfamiliar juvenile and adult monkeys of both sexes (stimuli are available as supplementary material for Sclafani et al.43). A tone of 1000 Hz was presented 250 milliseconds prior to trials in order to orient the animal. A low-light camera (Radio Shack Observation 49–2502 through 2004, then KT&C Corporation KTL CMB5010EX), attached to the display monitor and situated midway between the two projected images, was used to record the subjects’ looking responses. For each problem, the proportion of looking time directed at the novel stimulus was computed: duration of viewing the novel stimulus on the two recognition trials divided by the duration of viewing both the novel and familiar stimuli in the recognition trials. The principal outcome measure was a mean of this proportion across the seven problems. Chance responding was indicated by a mean of 0.50, with lower values suggesting a preference for the familiar stimuli, and higher values indicating preference for the novel stimulus. A variety of studies have shown that normal rhesus monkeys show a preference for the novel stimuli, and monkeys that are impaired tend to show no preference, or prefer the familiar stimuli48. Upon completion of testing, the subject was returned to its holding cage, and the test area cleaned and prepared for the next subject.
Behavioral data were recorded from two situations, using a standard ethogram for infant rhesus monkeys (see Table 2 in47) and The Observer49 software package. Inter- and intra-observer reliability were established at 85% agreement or better on behavior categories. Holding Cage observations comprised five minute focal animal observations on each animal (using a pre-determined random order) on two occasions – beginning at 0915 h (15 min after arrival in the test area) and on Day 2 at 0700 h (three hours prior to return to mother). The Day 1 observations reflect initial responses to the separation and relocation, and the Day 2 responses reflect adaptation to the BBA situation. Analyses focused on the proportion of time spent in passive (sit, crouch, hang from side of cage), avoidant (sleep, lie), and active/inquisitive (locomotion, stand) behavior, and rates (per 60 s) of coo and bark vocalizations. The Human Intruder observations were made at 1400 h on Day 1. The Human Intruder test assesses responsiveness to a standardized challenge, and comprises four one-minute trials (a) technician 1 m in front of the animal’s cage (far position), presenting left profile; (b) technician ~0.3 m (near position) with left profile; (c) far position while making direct eye contact with the animal; (d) near position, direct eye contact. Predominant responses on this brief test included time spent sitting, standing, active, and hanging from the side of the cage, and rates of bark vocalization and environment exploration (which, in this context, is an avoidant behavior). For both the Holding Cage and Human Intruder tests, behavioral data were collected as frequencies and/or durations. However, owing to slight variations in the length of each observation session (eg, for the one-minute trials in the Human Intruder test, one animal may have experienced a condition for 58.6 s and another animal for 61.1 s), durations were converted to proportion of time observed by dividing the duration by the length of the observation for that specific animal. Frequencies were converted to rate per 60-sec.
Temperament data were obtained at the end of the 25-h assessment period by a trained observer that did all of the testing with the animals. Each animal was rated on a list of 16 adjectives (listed in Table 3 in45) describing affect quality using a Likert-type scale of 1–7, with 1 reflecting a total absence of the trait and 7 reflecting an extremely large amount of the trait.
Assays
C-reactive protein was assessed using a high sensitivity assay (Beckman Coulter, OSR6199, Brea, CA) according to manufacturer instructions, utilizing CNPRC’s Clinical Laboratory’s Chemistry Analyzer (Beckman Coulter AU480, Brea, CA). Animals were selected only if they had values less than 10 mg/L, which is considered the normal range for our facility. All animals in the target cohort met this criterion, but since CRP was assayed beginning in 2016, only n = 317 animals were available in the control cohort for this measure (six animals were excluded whose CRP values were greater than 10.0).
Cortisol concentrations were assessed via I 125 radioimmunoassay using validated kits from Siemens Corporation through 2013, after which a quantitative competitive immunoassay that employs direct chemiluminescent technology on the ADVIA Centaur CP platform (Siemens Healthcare Diagnostics, Tarrytown, NY, USA) was used. Both assays measure total cortisol. The assay consists of dimethyl acridinium ester labeled cortisol which competes for binding to a polyclonal rabbit anticortisol antibody bound to a monoclonal mouse anti-rabbit antibody covalently coupled to paramagnetic particles. The immune complex is captured and separated by application of a magnetic force. Addition of acid (hydrogen peroxide and nitric acid) and base (sodium hydroxide) reagents produce a chemically induced light emission measured by luminometer in relative light units (RLUs). The RLUs are inversely proportional to the amount of cortisol in the unknown sample. Samples were diluted 1:10 with ADVIA Centaur Multi-Diluent 3 (Siemens Healthcare Diagnostics, Tarrytown, NY, USA) prior to analysis to obtain accurate results. Cortisol data from the chemiluminescent and radioimmunoassay were harmonized as described50 using multiple regression based on n = 32 samples assayed on both platforms (R2 = 0.88).
Data analysis
Data were analyzed (using SPSS v.26) with analysis of variance (using log 10 transformations as needed) and nonparametric statistics when transformations could not produce homoscedasticity. We expected biobehavioral differences in our target cohort based on WFS exposure (exposed animals were conceived on 22 Nov 2018 or earlier vs. non-exposed animals, who were conceived later than that). Because there was no a priori reason to assume that animals from the control cohort that were conceived late (i.e., after 22 Nov) were different on any of our measures compared to animals conceived earlier, however, we expected non-significant results for all analyses for this cohort, despite the larger sample size and increased power. Because no statistically significant results were found in the control cohort between early and late conceptions (see Results), we combined those groups in order to visually compare, using confidence intervals, control data with the two groups in our target cohort. This comparison enabled us to identify which group in our target cohort – exposed or non-exposed – was most similar or different to data from the control animals.
Sample sizes for all analyses are shown in Table 1. For the target cohort, all analyses involved the full sample of n = 89 animals except for the physiological measures (CRP, cortisol), for which blood samples were obtained for n = 71 of the 89 animals. Among controls, many analyses had slightly fewer animals than in the full cohort, due to missing data from equipment failure or animals that became ill and had their assessments cut short. The principal exception, as noted above, was for CRP, collection of which began with the animals tested in 2016 (who were conceived in 2015).
Independent variables were exposure condition (for the target cohort: exposed vs non-exposed) or conception timing (for the control cohort: early vs. late), and sex. Specific Pathogen Free (SPF) status (monkeys that have been bred to be free of four viral pathogens51) was a covariate in all analyses, as previous work in our laboratory has shown that some of our measures are affected by SPF status. Initial analyses included repeated measures as additional independent variables (two days for Holding Cage; four conditions for Human Intruder; two samples for cortisol). No interactions between the repeated measures and exposure condition were found in any analyses; consequently, mean values were computed across the repeated measure variables, which also served to improve homoscedasticity. Effect sizes are indicated by partial eta-squared (η p 2); for context, Cohen25 considers values of .01, .06, and .14 to represent small, medium, and large effect sizes, respectively. For all analyses, results are presented only for exposure condition (target cohort) or conception timing (control cohort), and for interactions of these variables with sex. Figures show means and 95% confidence intervals for exposed vs. non-exposed groups in the target cohort, and for the full control cohort for comparison. All tests were two-tailed. (We recognize that some readers might prefer three-way ANCOVA, with cohort as a third factor, rather than our preferred separate two-way ANCOVAs for the exposed vs. non-exposed, and the early vs. late, contrasts. We note that such an analysis does indeed replicate our findings; we believe our approach provides greater clarity, however. All data are included as Supplementary Material for the reader’s further examination of the data).
Reporting summary
Further information on research design is available in the Nature Research Reporting Summary linked to this article.