Synthesis of iron oxide nanoflowers
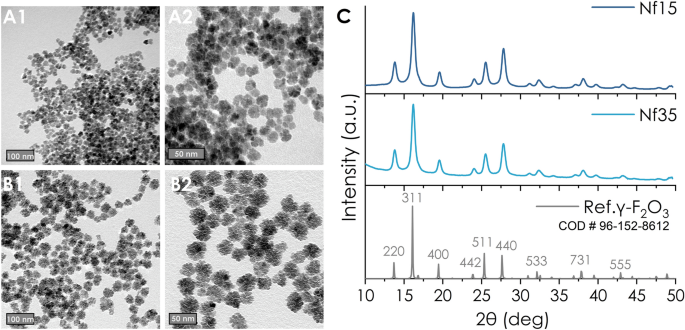
Iron oxide nanoflowers (Nfs) were synthesized by reduction of hydrate iron salts in a 1:1 v/v mixture of N-methyldiethanolamine (NMDEA) and diethylene glycol (DEG) at 210 °C at a heating rate of 2 °C/min31,34. NMDEA and DEG act as reducing agents and surfactants mediating the formation of flowerlike multicore iron oxide nanoparticles with narrow size distribution and exceptional colloidal stability35. We produced two different sizes of Nfs by varying the reaction time at 210 °C; 30 min for 15 nm (Nf15) and 60 min for 35 nm (Nf35). TEM images (Fig. 1A,B) revealed consistent morphology and lognormal size distribution (Nf15 d TEM : 15.1 ± 2.8 nm and Nf35 d TEM : 35.0 ± 3.8 nm) (Supplementary Fig. S1A).
Figure 1 TEM images of (A1-2) Nf15 and (B1-2) Nf35 (scale bars at 50 and 100 nm), (C) X-ray diffraction spectrum of Nf15 and Nf35 compared to maghemite standard. Full size image
The oxidation into maghemite (γ-Fe 2 O 3 ) crystalline structure is confirmed by XRD (Fig. 1C), in accordance with literature36. Maghemite is the preferable form of iron oxide for biological applications because it has less reactive sites than magnetite, thus minimizing the production of harmful reactive oxygen species in the healthy cellular microenvironment37,38,39,40. The crystallite size-determined by Scherrer’s equation- (Nf15 d XRD : 7.6 nm and Nf35 d XRD : 8.1 nm) is considerably smaller than the corresponding d TEM owing to their multicore nature29,41,42. This is supported by higher resolution TEM images where multi-grain constituents of the Nfs are observable while maintaining homogenous crystalline orientation (Supplementary Fig. S1B). In the FT-IR spectrum (Fig. 3A), the peak at 550 cm−1 corresponds to the υ(Fe–O). DLS measurements (Table 1 and supplementary Fig. S6) of the as-synthesized Nf15 and Nf35 showed a hydrodynamic diameter by intensity (d H ) of 30.03 nm (0.366 PdI) and 61.66 nm (0.215 PdI) with a zeta potential of (+)40.7 mV and (+)37.1 mV, respectively. In colloidal systems, d H appears augmented compared to d TEM due to aggregation effects or molecular interactions between the dispersant—in our case water—and the surface of the nanoparticles43,44,45. Nf15 showed some aggregation demonstrated by the increased PdI value and the appearance of a second peak in the size distribution graph (Supplementary Fig. S6), whereas Nf35 appeared with a slight increase in the diameter justified by larger hydration shell volume from the adsorbed water molecules43,45.
Table 1 DLS data from all nanoformulations; hydrodynamic diameter (d H ), polydispersity index (PdI) and zeta potential (ζ). Full size table
The room temperature isothermal magnetization of both ferrofluids Nf15 and Nf35 studied by SQUID magnetometry lies in the superparamagnetic regime indicated by the absence of hysteresis while demonstrating high magnetization saturation (M s ) values of 93.3 and 105.9 emu/g Fe , respectively (Fig. 2A), below but close to bulk state46. Irreversibility temperature (T irr ) is defined as the bifurcation point between zero field cooled (ZFC) and field cooled (FC) curves, whereas the blocking temperature (T B ) represents the maximum of the ZFC curve. T irr of both samples are well below room temperature, also pointing to a superparamagnetic regime. The specific values of T B are; 163 K for Nf15 and 181 K for Nf35 (Fig. 2B). The magnetic hyperthermia (MHT) response after the application of an AMF (f = 395 kHz, H = 18.6 kA/m or 233 Oe) testifies to a concentration-dependent behavior for both nanostructures (Fig. 2C), whilst Nf35 displayed superior SAR values and saturation temperature than Nf15 (Fig. 2D) for the same concentrations. The magnetothermal properties of the synthesized Nfs is strongly dependent on their morphology. The distinctive lower values for M s , T b and SAR of smaller sized Nf15 compared to Nf35 can be ascribed to the size and shape anisotropy20,47,48,49 factors having a positive contribution for larger particles.
Figure 2 Nf35 shows superior magnetic properties towards magnetic hyperthermia compared with Nf15, as demonstrated by the corresponding (A) Hysteresis loop, (B) ZFC/FC curves, and their (C,D) Magnetothermal response. Full size image
Functionalization of iron oxide nanoflowers
Trisodium citrate, a common biocompatible functionalization agent, was grafted on the surface of Nfs (cit-Nf15 and cit-Nf35). In the FT-IR spectrum, the appearance (Fig. 3A and supplementary Fig. S2) of intense peaks at 1587 cm−1 and 1390 cm−1 (υ as + υ s (COO)) supports the presence of chemisorbed carboxylate moieties of citrate radicals50. Additionally, the active fluorescent molecule Rhodamine B (RhB) was incorporated on the surface of bare Nfs (RNf15 and RNf35), and citrate functionalized Nfs (Rcit-Nf15 and Rcit-Nf35) by adsorption. The results suggest successful incorporation of RhB onto all four nanostructures preserving their colloidal stability. FT-IR spectra (Fig. 3A, supplementary Fig. S2) reveal characteristic peaks of RhB (1646–1587 cm−1 (υ(C=C) in aromatic rings), 1380–1130 cm−1 (δ (C–H) in =N + (C 2 H 6 ) + υ(C–N)), 1179 cm−1 (υ s (C–O–C)), 924 cm−1 (δ(OH)) confirming its adsorption on the nanostructures. Uv–vis spectra of RhB modified nanoflowers demonstrate a peak at 554 nm (Fig. 3B) indicative of RhB incorporation in the structure51. RhB adsorption was quantified by standard curve method (5.5 μM RhB in RNf15, 5.6 μM RhB in RNf35, 7.6 μM RhB in Rcit-Nf15, 7.9 μM RhB in Rcit-Nf35). Citrate-coated Nfs demonstrated increased adsorption of RhB compared to the uncoated, which is justified by the electrostatic interactions between the negatively charged carboxylate moieties of citrate-already coordinated on the surface of the nanoparticles- and the cationic pendant group [R = N + (C 2 H 6 )] of RhB.
Figure 3 (A) Juxtaposed FT-IR spectra of all formulations where highlighted areas indicate the different functionalities (brown: iron oxide, yellow: citrate, pink: RhB, grey: lipids). (B,C) Observable RhB adsorbed on Nfs or loaded in liposomes in normalized UV–vis spectra at 554 nm. Full size image
The colloidal stability of the functionalized nanoflowers was assessed via DLS measurements (Table 1 and Fig. S6). After citrate coating, we observed a shift in the zeta potential from highly positive to highly negative, with minimized PdI in cit-Nf15 and cit-Nf35. The apparent increase in d H after citrate and/or RhB functionalization is due to interactions between the carboxylate ions and water molecules or aggregation effects52. RhB has a molecular weight almost twice that of trisodium citrate (MW RhB : 479.02 vs. MW cit : 258.06 g/mol); thus, higher d H was anticipated and confirmed, especially on the bare Nfs coated only with RhB as the absence of citrate as stabilizing agent is essential on the colloidal behavior of the particles.
Encapsulation in fluorescent thermosensitive liposomes
Based on the localization in vitro data (Fig. 6), negatively charged cit-Nfs demonstrated increased internalization after 24 h of incubation with both cell lines. Thus, we selected cit-Nf15 and cit-Nf35 to encapsulate in thermosensitive liposomes containing RhB and in plain liposomes as control. DPPC (1,2-dipalmitoyl-sn-glycero-3-phosphocholine) is a thermosensitive lipid with a transition temperature (T m ) at 41.4 °C and is used as a liposome constituent for drug or nanoparticle delivery and release, especially for magnetic nanoparticles to facilitate the effect of MHT53,54. DSPE-mPEG 2000 (N-(Carbonyl-methoxy polyethylene glycol-2000)-1,2-distearoyl-sn-glycero-3-phosphoethanolamine) is a pegylated lipid used in liposome synthesis to increase their stealth in terms of bioavailability55. Our liposomes consist of DPPC and DSPEmPEG 2000 at a ratio of 95:5 mol% and have a hydrodynamic diameter around 100 nm confirmed by DLS (Table 1 and supplementary Fig. S6). RhB (1 mM) was incorporated in the organic lipid phase, whereas Nfs (5 mg/ml) were added during hydration at 60 °C. The increased temperature during hydration and extrusion favors the liquid crystal state of the lipid sheets56 thus increasing the ability to engulf cit-Nfs in the final liposomal formulation After 24 h dialysis, the remaining RhB was calculated at 317 μΜ for cit-Nf15@LipoR and 252 μM for cit-Nf35@LipoR according to the UV–vis generated standard curve. FT-IR (Fig. 3A, supplementary Fig. S2) and Uv–vis (Fig. 3C) spectra for all magnetoliposomes confirm the incorporation of Nfs as well as RhB and (Fig. 3B). Although all magnetoliposome nanoformulations were synthesized according to the same procedure, some differences in their colloidal behavior were observed. During the final step of encapsulating cit-Nf35 and cit-Nf15 in plain liposomes through extrusion, we used 100 nm-pore filters and subjected the formulations to dialysis. Size measurement in DLS (Table 1 and supplementary Fig. S6) for cit-Nf35@Lipo exhibited a d H ~ 92 nm, whereas cit-Nf15@Lipo was ~ 100 nm. This was also evidenced in the case of RhB functionalized magnetoliposomes, where we observed d H values of ~ 114 nm for cit-Nf35@LipoR and ~ 125 nm cit-Nf15@LipoR. According to the results the concurrent entrapment of cit-Nfs in thermosensitive liposomes was successful and can be further evaluated for their theranostic potential in comparison with the plain and functionalized Nfs.
Hemocompatibility assessment
Nanoparticles destined for in vivo biological applications can easily enter systemic circulation and interact with blood components before they reach their target, especially if the desired route of administration is intravenous57. Several nanomaterials have been reported to cause hemolysis or disruption of red blood cells’ (RBCs) morphology, the extent of which has been linked to size as well as shape and composition effects58,59. Therefore, clinical application of bionanomaterials is dependent on their hemocompatibility.
Herein, all nanostructures were evaluated for their hemocompatibility by calculating the hemolytic effect and the structural changes on RBCs from whole blood (wbRBCs) or isolated (iRBCs). For the hemolysis assay, serial dilutions of the samples were prepared in PBS (5–300 μΜ) and incubated with RBCs for 3 h. All samples exhibited minimal hemoglobin release from the RBCs (< 1%), indicating negligible hemolysis (Fig. 4A, supplementary Fig. S3A) according to the < 10% acceptance limit for biopharmaceuticals60. Water and PBS were used as positive and negative hemolysis controls, respectively, illustrated as 100% and 0% hemolyzed control samples. Fluctuations in the measurements are in the error range of the instrument.
Figure 4 Whole blood RBCs: (A1) Optical assessment of hemolysis and (Α2) hemoglobin percentage present in each supernatant after 3 h incubation with the samples at different concentrations as measured in ELIZA, (B) Optical microscopy (scale bars at 10 μm) and (C) SEM images (scale bars at 1 μm) of RBCs after 3 h incubation with the samples at a selected concentration (150 μΜ) on coverslips in 24-well plates. Full size image
Structural interactions of the samples at 150 μΜ Fe and controls with wbRBCs and iRBCs were studied live after 3 h incubation in PBS under an optical microscope (Fig. 4B and supplementary Fig. S3B). After fixation, the same samples were analyzed with SEM for detailed observation (Fig. 4C and supplementary Fig. S3C). Positive control of fully hemolyzed RBCs incubated in water (Fig. 4B,Cviii) appears colorless and deflated. In contrast, the negative control treated with PBS (Fig. 4B,Ci) appears well-rounded and uniform. Citrate coated and liposomal encapsulated Nfs were stable in PBS and did not affect the RBCs morphologically despite attaching on their surface (Fig. 4B,Ciii,x,vi,xiii). Bare Nfs didn’t cause any morphological transformations to the RBCs (Fig. 4B,Cii,ix), but they aggregated and precipitated easily in PBS, also observed by the clear color of the supernatants during the hemolysis assay. Some aggregation was observed in the RhB coated Nfs and cit-Nfs. Aggregation is not an acceptable factor for biological applications. RNf15, R-citNf15 and RNf35 caused deformation of RBCs (Fig. 4B,Civ,v,xi) that may be associated with the presence of RhB leading to different surface interactions with the erythrocytes’ membrane than the non-RhB functionalized samples. Interestingly, this is not the case for Rcit-Nf35 as no aggregation or membrane deformation was observed (Fig. 4B,Cxiii).
The results suggest that all nanoformulations are non-hemolytic, but some of them may cause deformations to the RBC’s morphology. Seemingly, RhB modified bare Nfs of both sizes caused some morphological alterations. Citrate coated Nfs modified with RhB had a contradicting effect between the treated samples of RBCs. While Rcit-Nf15 seems to have caused some deformation on the RBCs, Rcit-Nf35 did not have this effect leaving their morphology intact. This observation can be an indication of size effects; smaller sized nanoparticles are more prone to cause morphological alterations on the RBC membrane61. Rcit-Nf35 maintains the highly negative zeta potential compared to the other three Rhodamine B modified nanostructures, thus we can assess that this behavior depends not only on size but also because of more effective repulsive interactions58.
Cytocompatibility and localization in lung cancer cell lines
We chose two lung cancer cell lines, LLC and CULA, to test our samples for cytotoxicity (Fig. 5) at a wide range of concentrations (5–1000 μM Fe ) commonly encountered in literature11,62. According to a two-way ANOVA test followed by Dunnett’s multiple comparisons test, there is a negligible difference between control untreated cells (100% viability) and those treated with each nanostructure up to 300 μΜ Fe , whereas between 500 and 1000 μΜ Fe most samples exhibit significant reduction in viability. Hence, there is a linear regression for increasing concentrations of each sample, with the lowest value appearing for Nf15 and cit-Nf15 at ~ 70% at the highest concentration in LLC cell line, whereas in CULA cells the corresponding values are at ~ 80%. According to a second two-way ANOVA test followed by Tukey’s multiple comparisons among the different types of samples, no notable differences were observed for the same concentrations, except slightly significant decrease in viability of LLC treated with 1000 μΜ Fe Nf15 and cit-Nf15 when compared with liposomal encapsulated samples. Bare or citrate coated Nf15 compared to Nf35 and cit-Nf35 showed 10% less viability at the highest concentrations in LLC. This pattern could be an indication that smaller sized nanoparticles are indeed more prone to cause toxic effects, while the addition of a lipid bilayer offers a stealth property to them, which is in accordance with literature63. Between the two cell lines, LLC cells showed a slight insignificant decrease in viability compared to CULA cells, which seem to be more resistant to the different sample treatments at higher concentrations.
Figure 5 MTT assay results illustrating %Viability of LLC and CULA lung cancer cells after 24 h incubation with each formulation at different iron concentrations (Statistical analysis by two-way ANOVA test with Dunnett’s multiple comparisons test, *0.01 < p < 0.05, **0.001 < p < 0.01, ***0.0001 < p < 0.001). Full size image
To explore the route of intracellular localization of our formulations, we followed two different in vitro imaging protocols; observation of magnetic nanoparticles via Prussian blue staining under optical microscopy (Fig. 6A) and fluorescent microscopy for the RhB modified formulations (Fig. 6B). Prussian blue staining revealed differences in cellular internalization depending on the size and the surface modification of the samples. Smaller-sized Nf15 with or without functionalization had an overall observable profile of decreased endocytosis compared to Nf35. Citrate-coated Nfs (Fig. 6Aiii,ix,xvi,xxii) exhibited increased localization in the cytoplasm in both cell lines, compared to bare Nfs (Fig. 6Aii,viii,xv,xxi). Rhodamine modified Nf15 with or without citrate (Fig. 6A iv-v, xvii-xviii) appeared to be rather aggregating than internalizing, whereas the corresponding functionalized Nf35 (Fig. 6Ax–xi,xxiii–xxiv) were observed in the cytoplasm, especially Rcit-Nf35. Liposomal encapsulated cit-Nfs (Fig. 6Avi,xii,xix,xxv) showed increased internalization compared to plain cit-Nfs, with a slight decrease in the RhB modified magnetoliposomes (Fig. 6Avii,xiii,xx,xxvi) but still higher than the unencapsulated ones. This was further verified by fluorescent microscopy and quantification of the fluorescent signal with respect to the background (Supplementary Fig. S7). Rcit-Nfs (Fig. 6Bix–xii,xxi–xxiv) showed more intense signal-originating from the cytoplasm-than RNfs (Fig. 6Bv–viii,xvii–xx) and even greater for Rcit-Nf35 and cit-Nf35@LipoR (Fig. 6xxi–xxiv,xxv–xxviii). The non-leaching profile of RhB modified samples (Supplementary Fig. S5)-discussed in the next section- validates that the signal originates solely from the internalized particles.
Figure 6 (A) Optical microscopy images of all Nf formulations stained with Prussian blue (B) Fluorescent microscopy images of RhB modified samples. Both sets of images were acquired after 24 h treatment and incubation in either CULA or LLC cell lines. (All scale bars at 10 μm). Full size image
The results from the two different protocols followed to assess the cellular localization of our nanoformulations come into an agreement, as both methods revealed an accumulation of the particles in the cytoplasm. Especially for the Nf35 family of samples we observed increased internalization in the cytoplasm, compared to the Nf15 family of samples, validated by both Prussian blue staining and fluorescent microscopy. Moreover, the observed increase of internalization after liposomal encapsulation can be credited to the enhanced elasticity of the structure and the augmented affinity towards cellular membranes compared to unencapsulated particles64.
Cell death induced by magnetic hyperthermia
To perform in vitro MHT, we chose specific samples based on the findings from their magnetothermal response as well as cytocompatibility and localization assays. The selected samples were cit-Nf35, Rcit-Nf35, cit-Nf35@Lipo, and cit-Nf35@LipoR. Pellets of approximately 1.2–1.5*106 LLC or CULA cells were formed by gentle centrifugation, and 500 μl culture medium containing 27mM Fe (1.5 mg Fe /ml) of each sample was introduced. Each sample was subjected to the same conditions; thermostated at 36.6 °C and underwent MHT for 15 min. Control samples were thermostated at 36.6 °C and remained in the incubator for 15 min. According to the thermal curves (Supplementary Fig. S4), Nf35 reached 44 °C faster than the other samples, but most samples reached 42 °C in about 5 min and endured another 10 min of MHT at 43–44 °C. By removing the supernatant immediately after the 15 min treatment and resuspending each pellet in DMEM, we could keep only the amount of the nanoparticles that interacted (internalized or surface-attached) with the cells. Each cell suspension was divided into 3 parts and re-seeded in culture plates for 24 h. One part for live microscopy (Fig. 7A), the second for fluorescent microscopy (Fig. 7B), and the third for MTT (Fig. 7C). The concentration is a crucial factor for MHT experiments both in vitro and in vivo65. We chose the specific concentration of 27mM Fe , considering their magnetothermal response (Fig. 2C,D) with respect to the viability results (Fig. 5), by scaling up the iron concentration to match the cellular concentration of the pellet. In more detail, the cell pellets, created to simulate a mini-tumor for in vitro MHT, have 50–75 times higher cellular concentration than in the MTT experiment. At concentrations [300–500] μΜ Fe (Fig. 5) the cellular viability remained over 80% in both cell lines, whilst the theoretically equivalent -for higher cellular density- concentration range is15,16,17,18,19,20,21,22,23,24,25,26,27,28,29,30,31,32,33,34,35,36,37 mM Fe . The selected concentration of 27 mM Fe falls within this range, while retaining the desired magnetothermal response to evaluate the therapeutic effect of our samples after in vitro MHT.
Figure 7 In vitro magnetic hyperthermia after-effects 24 h post treatment (A) Live optical microscopy (B) Optical fluorescent microscopy (all scale bars at 10 μm) after fixation (C) MTT viability assay (*0.01 < p < 0.05, **0.001 < p < 0.01, ***0.0001 < p < 0.001). Full size image
We observed severe cytological alterations in size and shape of both LLC and CULA cells after applying MHT, compared with the control groups which remained intact and proliferated normally (Fig. 7A). Cells appear apoptotic in all samples treated with MHT (Fig. 7Axi–xx), but at different stages. Rhodamine B containing nanostructures after MHT presented extensive cellular deformation (Fig. 7Axii,xv,xvii,xx) indicative of late apoptosis, which is further supported by considerably low viability for Rcit-Nf35 (CULA: 7.6% and LLC: 7.8%) and cit-Nf35@LipoR (CULA: 10.2% and LLC: 7.5%) (Fig. 7C w/MHT). Rcit-Nf35 and cit-Nf35@LipoR control samples without MHT appear in the cytoplasm without affecting the cell structure, evidenced in both optical (Fig. 7Aiii,vii,v,x) and fluorescent (Fig. 7Bi–viii) microscopy. Cells treated with cit-Nf35 after MHT (Fig. 7Axii,xvii) appeared as apoptotic at a lesser extent with notably decreased viability in both cell lines (CULA: 35.9% and LLC: 35.8%) (Fig. 7C). Apoptotic cells were observed co-existing with well-defined live cells in cit-Nf35@Lipo samples undergoing MHT (Fig. 7Axiv,xix), which was reflected by higher cellular proliferation rates (CULA: 74.3% and LLC: 56.5%) (Fig. 7C). The unaffected cellular structure (Fig. 7Ai–x) and substantially increased viability (Fig. 7C wo/MHT) of all unexposed to MHT samples -similarly to the MTT results in Fig. 5 at the range of 300–500 μΜ Fe —leads to the assumption that the observable cell death is solely dependent to the contribution of MHT.
After calculating the remaining iron concentration in the cell pellets, we observed that almost half of the amount of the treating nanoformulations actually remains in the cell pellet after the supernatant’s removal. Interestingly, the cell pellets subjected to MHT presented slightly higher remaining iron concentration than the control samples without MHT (Supplementary Table S1). This phenomenon can be attributed to the increased cellular membrane fluidity, after exposure to MHT at 44 °C, resulting in the enhancement of permeability towards the samples66.
Rhodamine B containing nanostructures showed significant cell damage and considerable proliferation decrease in both cell lines after MHT exposure. We suspect that the loaded RhB was released from the thermosensitive lipid bilayer because of the temperature increase after MHT, leading to accelerated apoptosis stemming from the magnetothermal response. To explore this possibility, we performed a release experiment for Rcit-Nf35 and cit-Nf35@LipoR in presence and absence of a magnetic field. Indeed, the results (Supplementary Fig. S5A) suggest that 32% of the liposomal encapsulated RhB was released under MHT, whereas Rcit-Nf35 demonstrated minimal release at 3%. In the absence of an AMF, no significant release was observed. The difference in the release profile between the two samples under MHT can be attributed to their structure; in Rcit-Nf35, RhB is stably conjugated through chemical adsorption on the surface of the nanoflowers by means of electrostatic interactions, whereas in cit-Nf35@LipoR, RhB is bounded inside the thermosensitive liposomes through passive loading and can be released with heating. This behavior is also supported by the drop in fluorescent signal intensity after MHT for cit-Nf35@LipoR (Supplementary Fig. S8), in which case the released RhB is removed along with the supernatant. Hence, concurrent in vitro MHT and RhB interaction with the cells leads to significant decrease in viability. In the absence of an AMF Rcit-Nf35 presented ~ 10% decreased viability compared to the RhB containing magnetoliposomes, probably stemming from the immediate exposure to the grafted RhB. Cells treated with cit-Nf35 and cit-Nf35@Lipo overall exhibit higher cellular viabilities with or without MHT, compared to the ones that contain RhB. In the context of Rhodamine B having been reported to cause DNA damage and oxidative stress67,68,69, we can conclude that it contributes synergistically to MHT induced cancer cell apoptosis, in our experimental set-up.