Data collection from the Fernandina tortoises
We extracted DNA from a femur of the sole C. phantasticus specimen (CAS catalog #8101) which was obtained from the California Academy of Sciences collection. In a dedicated ancient DNA facility at Yale University, a Dremel rotary tool with a cutting blade was used to excise a small wedge of bone (~200 mg), targeting the mid-point in the femur where the bone is densest. The wedge of bone was pulverized in a tube submerged in liquid nitrogen using a Spex 6770 freezer mill. The bone was then demineralized by incubating overnight at 56 °C in a solution of 0.5 M EDTA pH 8.0, 10% SDS, and Proteinase K. DNA was recovered from the resulting lysate using a Qiagen MinElute column. The lysate was mixed with 5× volumes of PB buffer (Qiagen) and centrifuged through the MinElute column. The column was washed twice with PE buffer, before the DNA was eluted using 50 μl of ultra-pure water, warmed to 56 °C.
A small sample of blood (~1 mL) was collected from the brachial artery of a front limb of the living Fernandina tortoise (“Fernanda”). The research was approved by Yale’s Institutional Animal Care and Use Committee (2020–20346). The blood sample was collected under the permit MAE-DNB-CM-2016–0060-M-0003 from the Ecuador Ministry of the Environment, and imported under CITES permit 20US209142/9. The blood was mixed with 3 mL of Longmire Lysis buffer40 and stored at 4 °C. DNA was extracted from the blood using a DNeasy Blood and Tissue Kit (Qiagen) according to the manufacturer’s protocol.
For both tortoises, the DNA was prepared into Illumina sequencing libraries by the Yale Center for Genome Analysis, and then sequenced on an Illumina NovaSeq S4.
Sequence processing and alignment
Sequences were trimmed and aligned to the C. abingdonii reference nuclear and mitochondrial genomes assembly ASM359739v122, using the BAM pipeline in PALEOMIX version 1.2.1441. In a previous study, analyses were performed to assess whether the use of an in-group reference genome impacted alignment quality, and it was found to not be an issue among Galapagos giant tortoises12. PALEOMIX is a wrapper program that employs other bioinformatic tools, including ADAPTERREMOVAL version 2.3.142, to trim, BWA mem version 0.7.1743, to align, PICARD MarkDuplicates (version 2.6.0, http://broadinstitute.github.io/picard/) and paleomix rmdup_collapsed to remove PCR duplicates, and GATK IndelRealigner44 to realign around indels. For CAS 8101 an additional step was included in the pipeline to rescale the quality scores of bases that were potentially the result of postmortem DNA damage using MAPDAMAGE 2.045. The BAM files were filtered for a minimum mapquality score of 30, retaining only primary alignments and with an insert size between paired end reads of less than 800 bp using BAMTOOLS version 2.5.146. Regions of the nuclear genome that are potentially repetitive were filtered out using mask files based on mapability (generated using the program SEQBUILITY https://github.com/lh3/misc), and known repetitive elements identified by REPEATMASKER47. Contigs in the nuclear genome that are less than 100 kb in length were removed, as they tended to have lower mean mapping quality scores. In total, 2598 nuclear genome contigs were retained, with a total length of 2,226,678,034 bp that is equal to 96.8% of the total genome length.
Nuclear genome analyses
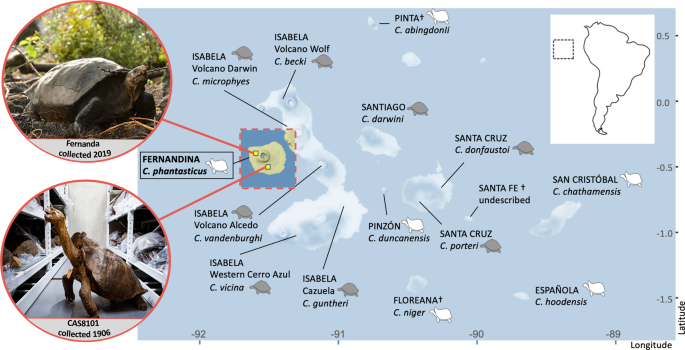
We analyzed the nuclear genome BAM files for the two Fernandina individuals along with data from 37 other Galapagos giant tortoise genomes, which included three representatives from all 11 of the living species, including three individuals each from the two lineages with C. becki (PBL and PBR) (data from Jensen, et al.12, NCBI Bioproject PRJNA761229), plus one representative from the extinct Pinta Island species (C. abingdonii, data from Quesada, et al.22). The C. abingdonii individual (the tortoise known as “Lonesome George”) is the one from which the reference genome was constructed22, so in order to generate a dataset with equivalent coverage to the other individuals we used only a subset of the Illumina short reads available (NCBI SRA accessions SRR6950587, SRR6950589, and SRR6950615). For phylogenetic analyses, an outgroup, the Chaco tortoise (C. chilensis, data from Jensen, et al.12, NCBI SRA BioSample SAMN24582572) was also aligned to the C. abingdonii genome and used. The geographic locations of each lineage are indicated in Fig. 1, sequencing depths are presented in Supplementary Data 1.
The BAM files for all individuals were used as input to detect variants and call genotypes using BCFTOOLS mpileup/call48 which were filtered using VCFTOOLS49. Only genotype calls supported by a minimum depth of six reads with a genotype quality score of >17 were retained, and only loci with no missing data with a maximum mean coverage within one standard deviation of the mean coverage across loci were retained. This dataset of 716,435,660 bp, including invariant sites, was used to calculate observed heterozygosity using VCFTOOLS. Invariant sites were then filtered out, to retain only sites with a minor allele count of 1, and the–indep-pairwise function in PLINK v1.950 was used to prune out loci in linkage disequilibrium (LD) using a sliding window size of 50 kb, step size of 5 loci, and r2 threshold of 0.5. In addition, we calculated heterozygosity using the single-sample SFS approach implemented in ANGSD, including downsampling our read depth and using only transversions (see Supplemental text for detailed methods).
To assess the ancestry and genetic affinities of the two Fernandina individuals, we used PCA, implemented in PLINK v2.0 using the–pca var-wts option, and plotted in R.
Nuclear phylogenetic analyses
Whole genome sequence fasta files were created from the mapped-read BAM files using ANGSD51. Through this method, the base at each site is chosen with the highest number of reads, and indels are skipped. To test for the possible effects of sequence length and linkage in the phylogenetic analyses we created different subsets of data and performed phylogenetic analyses on each of them.
For each set, we randomly selected a starting point on each contig of the assembly between site 100,000 and 1,000,000 to avoid starting too close to a potential telomere. From there, we extracted a fixed length of sequence (10 or 100 kb), skipped a length of sequence (100 kb or 1 Mb) of sequence, extracted the following fixed length of sequence, and continued this pattern through the end of the contig. The same coordinates were then used to extract homologous sequences from all other samples. Because sequences were extracted using coordinates of the reference genome, re-alignment of the extracted sequences was not necessary. This process was repeated to create separate aligned sequence datasets of 10 kb or 100 kb in length, and separated by 100 kb or 1 Mb to test for the effects of sequence length and possible linkage in the phylogenetic analyses. The python script for generating these sequences is available on our GitHub repository (https://github.com/sjgaughran/tortoise-phylogenomics).
Each alignment was filtered using the AMAS package52 to retain alignments with more than 5 parsimony informative sites, less than 10% missing data, and a GC-content greater than 30% but less than 70%. Maximum likelihood trees were then constructed for each alignment using RAxML23 with the GTR-GAMMA model, 20 bootstraps (-N 20), and assigning the C. chilensis tortoise sequence as the outgroup. The resulting gene trees were concatenated and used as input for ASTRAL24 to find the best species tree from the gene trees, with branch support reflecting quartet support (i.e., the amount of gene tree conflict around the branch).
To calculate genetic distance, we generated custom python scripts that calculated the number of pairwise differences between individuals in each alignment, divided by the number of sites for which there was no missing data (‘N’) for that pair of individuals. We then averaged this across all alignments for each data set. Because genetic distances between individuals are higher in populations with higher genetic diversity, we used a measure of pairwise genetic distance that accounts for the average heterozygosity of the individuals being compared. To account for differences in heterozygosity across individuals, for each pairwise comparison we took the average of the heterozygosity between the two individuals and divided the absolute pairwise genetic distance by this average heterozygosity. This normalized genetic distance can be described as:
Equation 1.
$${{{{{\rm{Distance}}}}}}=\,\frac{\frac{1}{n}\mathop{\sum }\limits_{i=1}^{n}\frac{{a}_{i}}{{S}_{i}}}{\frac{{h}_{1}+{h}_{2}}{2}}$$ (1)
where n is the number of genomic segments, a i is the number of pairwise differences between the two individuals for segment i, S i is the number of non-N base pairs in segment i, h 1 is the per-base pair genome-wide heterozygosity of one individual and h 2 is the per-base pair genome wide heterozygosity of the other individual. The scripts for calculating this distance and plotting the comparisons are available on our GitHub repository (https://github.com/sjgaughran/tortoise-phylogenomics).
Mitochondrial genome analyses
We analyzed the mitochondrial genome BAM files for the two Fernandina individuals along with the same representatives of the 12 living lineages and C. abingdonii as for the nuclear analyses, with the addition of one other C. abingdonii individual (historical specimen CAS 8112, collected in 1906 from the wild) and one individual of C. niger (historical specimen 46606 from the Harvard Museum of Comparative Zoology, “MCZ”) from Floreana Island. Mitochondrial genomes for these two additional historical individuals were obtained using low-coverage whole genome sequencing, following the same DNA extraction, library preparation, sequencing, and analysis methods as described for CAS 8101. For CAS 8112 and MCZ 46606 coverage of the nuclear genome was too low to include them in those analyses, but coverage of the mitochondrial genome was 138× and 13×, respectively (Supplemental Table 2). The mitochondrial BAM files were input into BCFTOOLS mpileup/call with the -c option to write the consensus allele. The VCF file was converted to Phylip format and aligned with mitochondrial genome sequences for the outgroup taxon C. chilensis (LT599484).
The mitochondrial genomes were realigned with MUSCLE53, and concatenated into a super matrix for the determination of appropriate substitution models. The final super matrix of 15,522 bases included 13 protein coding genes, 22 tRNAs, and 2 ribosomal RNAs (Table S2).
PartitionFinder2 (PF) v.2.154 was used to find the best-fit partitioning scheme and the best nucleotide substitution model for each partition (Table S3). The alignment of mitogenomes was subdivided into 63 predefined blocks; 39 of them correspond to each codon position for the 13 coding genes, 2 to the ribosomal genes (12S rRNA and 16S rRNA), and 22 to tRNAs. The analysis was run twice in order to find the best-fit partitioning scheme and evolutionary models for each downstream analysis according to the models that can be implemented in software that we used in phylogenetic analyses (RAxML, MrBayes55). In all analyses, linked branch lengths and greedy algorithm were selected to search for the best-fit solutions, and the model selection was based on the Bayesian Information Criterion (BIC) that is substantially more accurate in finding the true model than AIC/AICc56, ignoring the models that contain both gamma distribution and invariable sites57.
Bayesian inference (BI) analysis was performed in MrBayes v.3.2.755, performing four runs and using eight sampling chains for each run based on the partition and models revealed in PF2. Each chain ran for 10,000,000 generations, sampling every 5000 generations. To check for convergence and stationarity, we used the plot of the generation versus the log probability of the data (the log likelihood values), the average standard deviation of split frequencies, the average Potential Scale Reduction Factor (PSRF), and the minimum value of Estimated Sample Sizes (ESS). The first 25% of trees were discarded as burn-in. A 50% majority rule consensus tree was then produced from the posterior distribution of trees and the posterior probabilities were calculated as the percentage of samples recovering any particular clade. Posterior probabilities ≥ 0.95 indicate statistically significant support58.
Maximum likelihood (ML) analysis was performed using RAxML v.8.2.12. The tree with the best likelihood for each dataset was selected among the 50 ML trees generated on distinct starting trees. Statistical confidence was assessed based on 1000 thorough bootstraps.
Statistics and reproducibility
Statistical support for gene trees and the mitochondrial trees was assessed as bootstrap values in RAxML for the ML analyses, and as posterior probabilities in MrBayes in the BI analysis. The method for calculating normalized genetic distance as described above was carried out in a custom python script, which is available on our GitHub repository (see “Code Availability”).
Reporting summary
Further information on research design is available in the Nature Research Reporting Summary linked to this article.