Natural aging of COCS
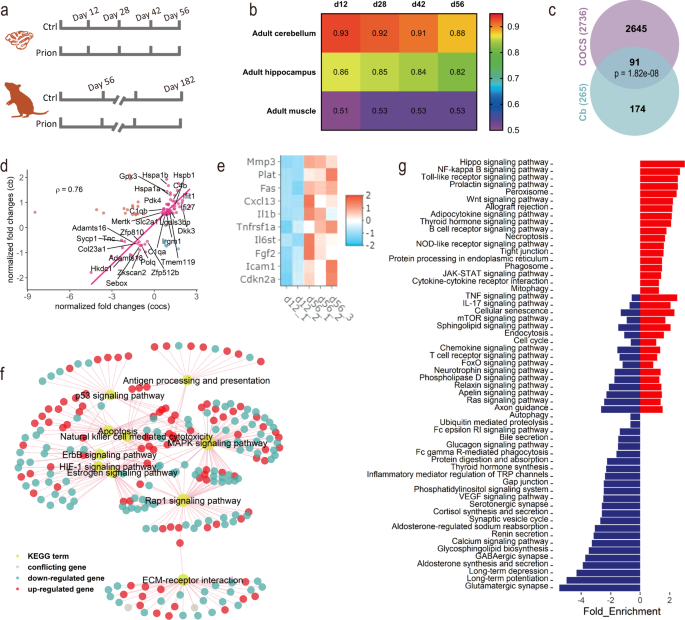
We used RNA sequencing (RNAseq) to obtain genome-wide gene expression profiles of COCS maintained ex vivo for 12, 28, 42, or 56 days in the presence or absence of prions (Fig. 1a). To compare it with in vivo, a similar RNAseq was performed for the cerebellum of adult C57BL/6 J mice at 56 or 182 days post-intracerebral inoculation with normal brain homogenate (NBH) or brain homogenate containing prions (Fig. 1a). The global gene expression in the control COCS was highly similar to that in the cerebellum and hippocampus (GSE14473812) in vivo, but substantially different from the adult muscle (GSE14548013) (Fig. 1b), indicating that brain-specific gene expression was retained in COCS. The correlation of transcriptional patterns between the control COCS and adult brain tissues underwent a subtle monotonic decrease over time (Fig. 1b). Indeed, a comparison of gene expression in the control COCS between 56 and 12 days identified 2736 differentially expressed genes (DEG) (Supplementary Fig. 1a; Supplementary Data 1).
Fig. 1: COCS recapitulate in vivo gene expression and undergo rapid aging. a Design of the RNAseq experiments. b Spearman’s correlation coefficient (ρ) of gene expression in COCS (12-56 days) with adult mouse cerebellum, hippocampus and muscle. X-axis indicates days ex vivo of COCS. c Overlap between DEG of aged COCS and cerebellum (p: hypergeometric test). d Changes of common DEG in aged COCS vs cerebella. Genes of interest are highlighted with their names. Genes show different directions of changes in the two conditions are highlighted in cyan or red. e Heatmap showing the expression of cellular senescence genes, including p16 (Cdkn2a) and members of the senescence-associated secretory phenotype, in young (12 days) and old (56 days) COCS. f Subset of common KEGG pathways that are significantly (FDR < 0.05) dysregulated in aged COCS and cerebellum. g Additional KEGG pathways that are significantly (FDR < 0.05) enriched in the DEG of aged COCS. Negative and positive values of the x-axis indicate downregulation and upregulation during aging, respectively. Blue bars: downregulated pathways in aged COCS. Red bars: upregulated pathways in aged COCS. Full size image
To assess whether the time-dependent transcriptional changes in the control COCS mirror the pathophysiology of brain aging in vivo, we examined whether similar alterations were detectable in the mouse cerebellum across ages. We identified 265 DEG in the cerebellar tissues of NBH-inoculated mice between 56 and 182 days (~4–9 months of age) (Supplementary Fig. 1b; Supplementary Data 2). Ninety-one out of the 265 DEG overlapped with those observed in the control COCS (Fig. 1c). Furthermore, 80% of the overlapping genes were altered in the same direction, and were highly correlated (ρ = 0.76, Spearman’s correlation) between the control COCS and in vivo (Fig. 1d). These genes were associated with microglia (e.g., Tmem119, C1qa, C1qb, and C4b), inflammation (e.g., Mertk, Irgm1, Ifit1, Ifi27, and Lgals3bp), protein stabilization (e.g., Hspa1a, Hspa1b, Hspb1, and Dkk3), glucose metabolism (e.g., Slc2a1, Pdk4, Gpx3, and Hkdc1), extracellular matrix (e.g., Col23a1, Adamts16, Adamts18, and Tnc), cell proliferation, and gene expression regulation (e.g., Sycp1, Polq, Zkscan2, Sebox, Zfp512b, and Zfp810). In addition, a noteworthy overlap was identified between the DEG in the control COCS and more advanced brain-aging stages, such as the 24-month mouse hippocampus (GSE6191514) (Supplementary Fig. 2a–c). Examination of the expression levels of cellular senescence genes, including the senescence marker p16 (Cdkn2a) and members of the senescence-associated secretory phenotype (e.g., Mmp3 and Icam1), indicated a strong induction of cellular senescence in the control COCS at 56 days (Fig. 1e), recapitulating a hallmark of in vivo tissue aging15.
To examine whether the transcriptional changes in the control COCS might be caused by the transient exposure to NBH, we analyzed ten randomly picked DEG (five upregulated and five downregulated) and ten genes related to cellular senescence by quantitative RT-PCR. However, none of them showed any difference between the control and naïve (no NBH exposure) COCS at 12 and 56 days (Supplementary Fig. 3a, b), indicating that the time-dependent gene expression changes in the control COCS were mainly induced by the natural aging process.
Enrichment of DEG in aged COCS and in vivo for KEGG pathways identified 41 commonly altered biological processes (Supplementary Data 3). These included antigen processing and presentation, p53 signaling, apoptosis, natural killer cell-mediated cell toxicity, Mapk signaling, ErbB signaling, Hif1 signaling, estrogen signaling, Rap1 signaling, and ECM-receptor interaction (Fig. 1f), all of which had been found to be overrepresented in aged brains16,17,18,19,20. Additional aging-related pathways, such as NF-kB signaling, mTOR signaling, autophagy, cellular senescence and VEGF signaling, were found to be more profoundly altered in long-term cultured COCS than in 9-month cerebella (Fig. 1g), suggesting that the 56-day-old COCS represent a more advanced in vivo brain-aging stage.
Aging-modulatory effects of rapamycin in COCS
To further validate the physiological relevance of the time-dependent transcriptional changes in COCS to in vivo brain aging, we treated naïve COCS with rapamycin, which is often used in anti-aging paradigms, or with DMSO from day 12 to day 56, and examined the expression levels of cellular senescence genes by quantitative RT-PCR. Strikingly, we found that the transcriptional induction of all the cellular senescence-associated genes in aged COCS was drastically suppressed by rapamycin treatment (Fig. 2a). In addition, by applying elastic-net-based machine learning21 to our time-course RNAseq dataset of the control COCS, we identified 322 age-predicting genes (Supplementary Data 4). Quantitative RT-PCR results demonstrated that rapamycin substantially inhibited the expression changes of all eight randomly picked upregulated age-predicting genes (Fig. 2b), and five out of eight randomly picked downregulated age-predicting genes (Fig. 2c), in the 56-day-old naïve COCS, indicating a global slowdown of the biological aging process upon rapamycin treatment. These data confirm that a biological process similar to that underlying in vivo brain aging drove the progressive transcriptional changes in COCS over time.
Fig. 2: Aging-regulatory effects of rapamycin in COCS. a Rapamycin (Rapa) decelerated the time-dependent upregulation of cellular senescence genes, including the senescence marker p16 (Cdkn2a) and members of the senescence-associated secretory phenotype. b, c Rapamycin (Rapa) decelerated the time-dependent upregulation (b) and downregulation (c) of eight and five randomly picked age-predictive genes in COCS, respectively (n = 3). Data are presented as mean ± SEM. *p < 0.05, **p < 0.01, ***p < 0.001. n.s not significant. Full size image
Accelerated aging in prion-exposed COCS
To evaluate the power of our model system for identifying novel modifiers of brain aging, we next studied how the biological aging process develops in COCS exposed to prions. We compared the transcriptional changes in the prion-exposed COCS at 56 days with those induced by natural aging in the control COCS. Surprisingly, we found that a large number of genes dysregulated in the aged COCS further changed their expression levels in the presence of prions (Fig. 3a). These results suggest that prions may alter the biological aging process.
Fig. 3: Prions accelerate biological aging in COCS. a Normalized fold changes of DEG commonly identified in prion-exposed and naturally aged COCS. ρ: Spearman’s correlation coefficient. Genes show different directions of changes in the two conditions are highlighted in cyan or red. b Upper panel of each cluster: graphs showing the aging-associated gene clusters classified by fuzzy c-means. Only those genes with cluster membership values >0.5 are shown. Middle panel for each cluster: heatmaps showing the relative expression levels of clustered genes in the presence and absence of prions. Bottom panel for each cluster: quantifications of normalized expression levels of clustered genes in the presence and absence of prions. ****p < 0.0001. c Linear regression of chronological and predicted biological ages of NBH- (Ctrl) and prion-exposed COCS at different time points. Shading indicates 0.95 confidence interval. *p < 0.05, **p < 0.01. n.s not significant. d Heatmap showing the transcriptional activities of the five gene co-expression network-modules in NBH- (Ctrl) and prion-exposed COCS over time. NES: normalized enrichment score of gene set enrichment analysis. Full size image
To test this hypothesis, we selected 3104 aging-related genes by combining DEG identified by comparing control COCS at any two time points, and examined their expression changes in the presence and absence of prions. Using fuzzy c-means clustering22, we classified the aging-related genes into six clusters (Fig. 3b). Genes in clusters 2 and 6 showed downregulation over time (Fig. 3b), and were enriched for neuronal genes (Supplementary Fig. 4a) and pathways associated with the synaptic function (Supplementary Fig. 4b). Genes in clusters 1 and 3 showed upregulation over time (Fig. 3b), and were enriched for Bergmann glia, astrocyte, and microglia specific genes (Supplementary Fig. 4a), and pathways related to interferon and inflammatory responses (Supplementary Fig. 4b). Interestingly, genes in cluster 4, which were associated with cell adhesion and extracellular matrix (Supplementary Fig. 4b) and exhibited strong early downregulation (Fig. 3b), were almost exclusively enriched in microglia (Supplementary Fig. 4a), indicating the possible coexistence of several distinct microglia populations. The cluster five genes showed strong early upregulation (Fig. 3b) and were enriched for genes highly expressed in oligodendrocyte linage cells (Supplementary Fig. 4a). We examined how prion exposure influenced the transcriptional evolution of these aging-associated genes over time at the cluster level. Strikingly, we found that the temporal signatures of all the six aging-associated clusters were largely preserved after prion exposure; however, the overall temporal kinetics of both the upregulated and downregulated clusters were strongly accelerated in the presence of prions (Fig. 3b).
To further investigate the prion-dependent aging acceleration, we trained an age-predictive machine-learning algorithm based on ridge regression23 using the time-course gene expression profiles in the control COCS, and calculated the biological ages of COCS exposed or not exposed to prions. The algorithm-predicted biological ages for the control COCS were similar to their chronological ages at all time points (Fig. 3c); however, the algorithm-predicted biological ages for the prion-exposed COCS were notably older compared to their chronological ages at three out of the four time points (Fig. 3c). Specifically, we found that the biological ages of the prion-exposed COCS were ~3, 8, and 13 days older compared to the control COCS at day 28, day 42, and day 56, respectively (Fig. 3c). These data further support the conclusion that the biological aging process is accelerated in COCS after prion exposure.
To explore the mechanisms behind the accelerated aging in the prion-exposed COCS, we did a gene co-expression network analysis across all experimental conditions and identified five distinct co-expression modules (Supplementary Fig. 5). We evaluated the module activities across samples using gene set enrichment analysis, and found all the five modules showed strong associations with both aging and prion exposure (Fig. 3d). Genes in modules 2, 4, and 5 showed time-dependent upregulation while genes in modules 1 and 3 showed time-dependent downregulation (Fig. 3d), all of which were drastically enhanced in the presence of prions (Fig. 3d). These results suggest that prions and aging essentially activate the same molecular programs.
Anti-PrP antibody POM2 abolishes accelerated aging in prion-exposed COCS
To further examine the accelerating effects of prions on the aging process, we treated prion-exposed COCS and control COCS with the anti-PrP antibody fragment FabPOM224, and sequenced their transcriptomes at 12 and 56 days. FabPOM2 treatment strongly reduced prion levels in the prion-exposed COCS (Fig. 4a, b). Strikingly, we found that although FabPOM2 did not alter the expression of aging-related genes in the absence of prions (Supplementary Fig. 6a); it completely abolished the accelerated aging signatures in the prion-exposed COCS (Fig. 4c, d). We then calculated the biological ages of the FabPOM2-treated COCS with our machine-learning algorithm, and found there was no difference between the control and the prion-exposed COCS anymore (Fig. 4e). Crucially, the biological ages of FabPOM2-treated COCS were similar to their chronological ages no matter whether they had been exposed to prions or not (Fig. 4e). These data indicate that acceleration of biological aging in the prion-exposed COCS was strictly dependent on prion replication.
Fig. 4: FabPOM2 treatment abolishes prion-induced aging acceleration and neurotoxicity. a, b Representative western blots (a) and quantification (b) of PrPSc in prion-inoculated COCS with or without FabPOM2 treatment (n = 5). ***p < 0.001. c Heatmap showing the expression levels of aging-associated genes in NBH- (Ctrl) and prion-exposed COCS with or without FabPOM2 treatment at day 12 and day 56. Values are normalized row wise. d Quantifications of normalized expression changes of the aging-associated genes shown in c between day 12 and day 56 in NBH- (Ctrl) and prion-exposed COCS with or without FabPOM2 treatment. ****p-value < 0.0001. e Chronological and predicted biological ages of COCS in NBH- (Ctrl) and prion-exposed COCS treated with FabPOM2. n.s not significant. f Heatmap showing the expression levels of differentially expressed genes in prion-exposed COCS at day 56 with or without FabPOM2 treatment. Data are normalized row wise. g Quantifications of normalized expression levels of genes shown in f. Left panel: upregulated genes in prion-exposed COCS. Right panel: downregulated genes in prion-exposed COCS. ****p < 0.0001. n.s not significant. h Representative immunofluorescent images of NeuN staining in NBH- (Ctrl) and prion-exposed COCS at day 56 with or without FabPOM2 treatment. i Quantifications of NeuN positive areas shown in h (n ≥ 15 brain slices for each group). ***p < 0.001. n.s not significant. j Representative western blots showing synaptophysin and NeuN protein levels in NBH- (Ctrl) and prion-exposed COCS at day 56 with or without FabPOM2 treatment. k Quantifications of synaptophysin and NeuN protein levels shown in j (n = 4 for Ctrl group; n = 5 for prion group). ***p < 0.001. n.s not significant. Data are presented as mean ± SEM. Full size image
We then examined how FabPOM2 treatment affected prion-induced neurotoxicity. By examining the RNAseq data, we found that FabPOM2 treatment completely abrogated all prion-induced molecular changes in COCS (Fig. 4f, g; Supplementary Fig. 6b). Quantification of the neuronal marker NeuN through immunofluorescence and western blotting suggested that FabPOM2 treatment also abolished prion-induced neurodegeneration (Fig. 4h–k). In addition, we found that the progressive loss of the synaptic marker synaptophysin after prion exposure was fully prevented by FabPOM2 (Fig. 4j, k). These data suggest that aging acceleration by prions may be a driver of neurotoxicity.
Accelerated biological brain aging in mouse models and patients of prion diseases
Since the progression of prion diseases is much faster than natural aging in humans and animal models, it is difficult to directly study the influence of prions on the aging process in vivo. However, if prions also accelerate brain aging in vivo, genes whose expression changes in advanced age may be altered prematurely in young prion-inoculated animals or exhibit stronger changes in prion disease patients compared to age-matched control subjects.
To test this, we extracted a set of genes significantly dysregulated in the 24-month mouse hippocampus compared to 3-month (GSE6191514), and examined their expression changes in the hippocampus of 8-month compared to 3-month in the presence and absence of prions (GSE14473812). In agreement with our prediction, we found many of the genes dysregulated in the 24-month hippocampus during normal aging had already shown significant changes in the 8-month hippocampus compared to 3-month in prion-exposed mice (Fig. 5a, b). In contrast, changes of the same genes were barely detectable in the 8-month hippocampus compared to the 3-month hippocampus in the absence of prions (Fig. 5a, b). To further validate these findings, we analyzed a publicly available RNAseq dataset (GSE16813725) examining genome-wide gene expression in the hippocampus of wild type (WT) and 5xFAD mice across different ages. Using the same approach as in Fig. 3b, we identified the aging-associated genes in the WT hippocampus and classified them into six clusters using fuzzy c-means clustering (Fig. 5c). We then examined how the expression of genes in clusters 3 and 6, two most age-predictive clusters, changed in the prion-exposed mice and AD mice compared to their respective controls. As expected, we found genes in both clusters changed much more strongly in the hippocampus of prion-exposed mice compared to the NBH control group between 8 and 3 months of age (Fig. 5d). In contrast, very similar expression changes were observed in the hippocampus of WT and AD mice within a similar period of time (Fig. 5d). Furthermore, we found a drastic upregulation of senescence-related genes, including the cellular senescence markers and members of the senescence-associated secretory phenotype, in the brains of prion-infected mice (Fig. 5e). These data suggest that prions also accelerate brain aging in the mouse model of prion diseases.
Fig. 5: Prions accelerate biological brain aging in vivo. a Heatmap showing the normalized fold changes of in vivo brain-aging-signature genes across conditions. ctrl_8M_3M: 8-month vs. 3-month hippocampus in control (NBH-exposed) mice; prion_8M_3M: 8-month vs. 3-month hippocampus in prion-infected mice; aging_24M_3M: 24-month vs. 3-month hippocampus in normal mice. b Quantifications of normalized expression changes of aging-signature genes shown in a. Left panel: upregulated brain-aging-signature genes shown in a. Right panel: downregulated brain-aging-signature genes shown a. ****p-value < 0.0001. c In vivo brain-aging-associated genes clustered by fuzzy c-means. Only those genes with cluster membership values >0.5 are shown. d Normalized expression changes of genes in clusters 3 and 6 shown in c in prion-inoculated mice, AD mice and their respective controls. ****p-value < 0.0001. n.s not significant. e Heatmap showing the expression levels of cellular senescence genes, including senescence markers and members of the senescence-associated secretory phenotype, in the cerebellum of NBH- (ctrl) and prion-inoculated mice. f Fold changes of human brain-aging-signature genes in the brains of Creutzfeldt-Jakob disease (CJD) patients compared to age-matched controls. Significant: p-value < 0.05. n.s not significant. g Graphs showing results of gene set enrichment analysis of senescence-inducer and inhibitor genes in the differentially expressed genes (DEG) of CJD. Statistical significance of the analysis is given as false discovery rate (fdr). DEG were ranked according to their fold changes in the CJD brains compared to age-matched controls. Full size image
To investigate whether similar biological processes are present in the brains of human prion disease patients, we examined the transcriptional changes of human brain-aging-signature genes26 in the brains of Creutzfeldt-Jakob disease (CJD) patients and age-matched control subjects (GSE12457127). Strikingly, we found that most of the upregulated human brain-aging-signature genes exhibited higher expression levels in the CJD brains than in the age-matched controls (Fig. 5f). Similarly, most of the downregulated human brain-aging-signature genes exhibited lower expression levels in the CJD brains compared to the age-matched controls (Fig. 5f). In addition, by gene set enrichment analysis, we found the senescence-inducer genes28, but not the senescence-inhibitor genes28, were strongly upregulated in the CJD brains (Fig. 5g), indicating induction of cellular senescence in the brains of prion disease patients. These observations suggest that acceleration of brain aging may also present in human prion disease patients.