Recent surface air temperature (SAT) development
SAT development from reanalyses
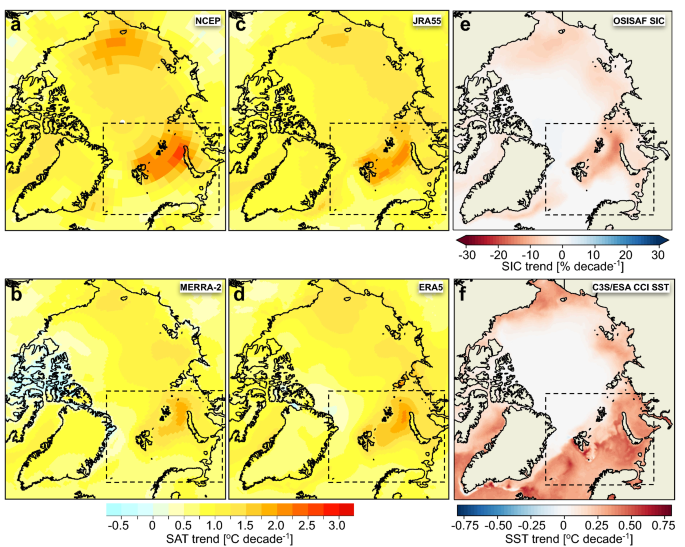
Our initial analyses were based on a suite of global reanalyses and show that the increase in the Arctic SATs over the period 1981–2020 was not spatially uniform. In general, higher positive SAT trends occurred in the marginal seas of the Arctic Ocean with seasonally ice-covered sea. The trends were strongest in the NBS, with an annual warming rate generally between 1.2 °C and 2.0 °C per decade, depending on the reanalysis product (Fig. 1a–d). The maximum annual warming occurred in a zone between FJL and Novaya Zemlya (for location see Fig. 2a) with values ranging from 1.8 °C (Fig. 1b) to 2.5 °C (Fig. 1a) per decade. Here also the largest decline in SIC (Fig. 1e) was observed, with a reduction of up to 16% per decade. Finally, the trends in SST were also pronounced in the Barents area, with the highest trends of 0.5 to 0.6 °C per decade found south of and along the west coast of Svalbard and in the central and south-eastern areas of the Barents Sea (Fig. 1f).
Figure 2 The spatial pattern of changes in surface air temperature, sea ice and sea surface temperature in the Barents study area for the time periods 1981–2020, 1991–2020 and 2001–2020. (a) Barents study area including the 13 weather stations which are shown with symbols and the first two letters of the station name from Fig. 3b (for larger map and more details, see Fig. S1). The regional boxes used for time series analyses (Table 1 and 3) are marked on the map, including the four Svalbard sub-regions. (b)–(f) Annual SAT trends (°C/decade) derived from CARRA and ERA5. Please note that the results are mapped onto different grid resolutions. (g)–(i) Annual trends in SIC (%/decade) with mean 15% SIC (ice edge) contour line marked in grey, and (j)–(l) present the annual SST trends (°C/decade) during the three periods. We used the esd R-package (https://doi.org/10.5281/zenodo.29385) to create the maps in b-f. The maps in a, g-l were generated using Python 3.6 (http://www.python.org) including pyresample 1.19 and cartopy 0.18. Full size image
CARRA and ERA5 reanalyses have been used in the further analysis of the Barents study area, and we performed detailed analysis in the following three main regions; Svalbard, Northern Barents Sea (NBS) and Franz Josef Land (FJL) (Fig. 2a). ERA5 showed higher warming rates in the periods 1991–2020 and 2001–2020 compared to 1981–2020, and the most pronounced warming took place in the eastern NBS and northeast of Svalbard (Fig. 2b–f).
However, CARRA showed notably greater regional SAT trends compared with ERA5. While ERA5 shows an annual warming rate of up to 2.5 °C per decade in both periods, the highest warming rate found for CARRA is 3.1 °C per decade (Fig. 2b–f). The hotspot in ERA5 primarily occurs in a zone between FJL and Novaya Zemlya, but CARRA has in addition a distinct hotspot area between northeastern Svalbard and FJL, especially in the period 2001–2020 with warming rates between 2.5 and 3.0 °C per decade.
SAT development from instrumental observations
Within the study area (Fig. 2a), two long-term composite series have been established for Svalbard Airport24 in the west and the Krenkel Observatory38 in the northeast (Fig. 3a). Both highlight the unprecedented high temperatures of the twenty-first century and the recent warming rate that is stronger and longer lasting than during the “early 20th-century warming” (cf. Førland et al.22). The annual average temperature for all 13 stations in the study area was compiled for the years they are operated, during 1981–2020 (Fig. 3b). There is an annual temperature difference of more than 10 °C between the coldest stations on FJL and the warmest stations on Svalbard, thus they cover most of the temperature range identified by the reanalyses in the region.
Figure 3 Temperature series from weather stations and observed trends. (a) Annual SAT series from the manned stations at Svalbard Airport24,31 and Krenkel Observatory38. (b) Annual SAT 1981–2020 from both old and newly available observations from Norwegian (in blue) and Russian (in grey) weather stations. (c) The new SAT series from the automatic weather stations at Verlegenhuken, Edgeøya, and Karl XII-øya compared with the manned station at Hopen. The data in a were filtered by a Gaussian filter with a standard deviation of three years, which illustrates variability at a decadal scale. In c linear trends for the 2001–2020 period are shown as solid lines. Values for the linear trends and statistical significance can be found in Table 1. Full size image
The new instrumental series from northern and eastern Svalbard at Verlegenhuken, Edgeøya and Karl XII-øya (for location see Fig. 2a) were compared with the well-established series from Hopen at south-eastern Svalbard (Fig. 3c). Compared with Hopen, the trend is stronger for all three sites, especially in the recent period 2001–2020. Trend values from the three new series were compared with our four longest time series (Table 1). From 1981 to 2020, our observed station-based data showed an annual warming rate varying between ~ 1.0 °C and 1.6 °C per decade. Record-high warming was observed over the two periods 1991–2020 and 2001–2020, with annual values ranging from ~ 1.1 °C per decade in Ny-Ålesund to 2.7 °C per decade at Karl XII-øya (Table 1 and Fig. 3c). The annual warming was dominated by higher autumn and winter warming but enhanced warming occurred in all seasons (Table 1). In autumn (SON) we noticed an accelerated warming for 1991–2020 and 2001–2020, with up to 4.0 °C per decade for the latter period at Karl XII-øya. In winter (DJF), the highest trends (up to 3.8 °C per decade at Krenkel Observatory) were found for the period 1991–2020. In spring (MAM) the highest trend was observed at Krenkel Observatory, with 2.1 °C per decade during the latest period 2001–2020. All stations showed low or moderate warming rates during summer (JJA), with values ranging from 0 to 0.7 °C per decade. The exception was Karl XII-øya, with a summer warming rate of 1.3 °C per decade during 2001–2020.
Table 1 Linear temperature trends (°C/decade) based on instrumental observations and CARRA and ERA5 reanalysis. Full size table
The annual trends were nearly all statistically significant at the 1 or 5% level for the three periods (Table 1). For 1981–2020 and 1991–2020, they were statistically significant at the 1% level. For most stations, seasonal trends were statistically significant at 1% or 5% level for the two longest periods. For 2001–2020, most of the SON trends were significant at the 1% level but for the other seasons either significant at the 5% level or not significant.
Comparing observed SAT trends with reanalyses
The warming seen in the instrumental observations (Table 1) is generally consistent with the spatial and temporal patterns found in the reanalyses. SAT increased in the entire area. The SAT trends were highest in the east and north and lowest in west and south. In the longest period 1981–2020, there was a good agreement between the four observed series and ERA5 (Figs. 4 and S6). For the 1991–2020 period there was also a reasonable agreement between observed trends and both reanalyses. The exception was Edgeøya and partly at Verlegenhuken, where CARRA indicated larger warming than observed (0.5 °C and 0.1 °C higher, respectively). For the period 2001–2020, observations are closer to CARRA than ERA5 at Verlegenhuken, Edgeøya and Karl XII-øya (Figs. 4 and S6). At Karl XII-øya, observed trends are larger than trends from CARRA. For the two latter periods, there is a striking difference between CARRA and ERA5. CARRA generally indicates larger warming rates (of up to 2.6 °C per decade at Ostrov Victoria) than ERA5 for the northern and eastern sites (cf. Figure 2). For the three southwestern stations Hopen, Sørkappøya, and Svalbard Airport, the trends were somewhat larger in ERA5 than in CARRA. Hence, CARRA clearly shows higher spatial variations in the trends than ERA5.
Figure 4 Annual trends in surface air temperature compared with reanalyses. Estimated SAT trends from observations (circles), ERA5 (blue bars) and CARRA (red bars, only in b and c) for the three different time periods: (a) 1981–2020, (b) 1991–2020 and c 2001–2020. The order of stations follows the ranked annual trends computed from CARRA reanalysis for the period 2001–2020. Similar results but for seasonal values can be found in Fig. S6. Full size image
Evaluation of ERA5 and CARRA reanalyses
The newly established station series from Karl XII-øya, Edgeøya, and Verlegenhuken provide a possibility to assess CARRA and ERA5 reanalyses with new observations that were not available during their production. The results were summarized in terms of biases and Standard Deviations of Error (SDE) in Table 2. It should be noted when comparing reanalysis (grid values) with point observations that some of the differences are due to what they represent and not necessarily errors in the data sets. For CARRA, the biases increase substantially at Karl XII-øya for the period without available observations. However, at Edgeøya and Verlegenhuken the biases are more similar for the two periods. For ERA5, the biases at Karl XII-øya and Edgeøya (NDJFMA only) are substantially higher for the periods where the observations are not available. Furthermore, both reanalyses show higher SDE at all three sites when no observations were available compared to when they were available. However, the availability of observations alone is not enough to ensure that they are assimilated in the reanalyses. For example, adjustments of surface temperatures, based on SAT through the surface assimilation process, are only done for the land part of a grid cell, and in ERA5 only if the land part is larger than 50%9. Due to this protocol, local observations of SAT were used at Verlegenhuken and Edgeøya in CARRA, but at Karl XII-øya, which is an ocean point in both reanalyses, the observations were not used in the assimilation process. The same applies to Edgeøya and Verlegenhuken in ERA5 (land part less than 50%). The change in the deviation between the reanalyses and the observations for these sites must therefore be explained otherwise. The mean temperatures, given in Table 2, differ substantially between the periods and support the idea that temporal variations in weather conditions may be the reason for these differences. The SAT in periods without available local observations is on average 6.9 °C, 3.3 °C and 0.9 °C lower for Karl XII-øya, Edgeøya, and Verlegenhuken, respectively. The deviations from the observations in Table 2 for CARRA are consistently similar or lower than the deviations for ERA5 and the results are therefore in good agreement with the general picture on how CARRA adds value to ERA539. Even if both reanalyses show a high correlation with in-situ observations, CARRA shows higher correlations than ERA5, especially for the warmest months May–October (Fig. S5). Obviously, ERA5 produces some of its highest correlations with the observations at Krenkel Observatory and Ny-Ålesund which are the only two SAT observation sites that are assimilated in ERA5 in the region.
Table 2 Summary of SAT biases and Standard Deviation of Error (SDE) in the CARRA and ERA5 data sets at three observation sites (Karl XII-øya, Verlegenhuken, and Edgeøya) for the period 1998–2018. Full size table
Additionally, we compared CARRA and ERA5 with observed SAT from ten observation sites, stratified by the nearby sea ice conditions (Table S3). For all sites, the SDE was higher when close ice (SIC > 70%) was present compared to open water (SIC < 10%). The absolute biases were on average only slightly larger for close ice than for open water for both reanalyses, but some locations (e.g. Karl XII-øya) were highly sensitive to the sea ice conditions. Furthermore, the frequency of close or mixed ice (SIC = 10–70%) at Karl XII-øya was higher in the period without available SAT observations (mean SIC = 79%) than in the period with available SAT observations (mean SIC = 50%) and can explain a substantial part of the differences in bias and SDE for Karl XII-øya seen in Table 2. Thus, a pronounced warm bias for close ice conditions was observed. Averaged over all sites, CARRA has a lower absolute bias than ERA5 independent of close ice (0.6 °C) or open water (0.7 °C) conditions.
Trends in SIC and SST
SIC and SST development from remote sensing observations
The sea ice has declined since 1981 in the entire Barents study area (Figs. 2, 5). The strongest decline occurred over the shelf region north of the mean ice edge (Fig. 2) in the NBS with pronounced sea ice reductions in the area between FJL and Novaya Zemlya, and in the area north and east of Svalbard. Similar to the warming pattern, the decline in SIC was more pronounced during the periods 1991–2020 and 2001–2020 than during the entire 40 years period (1981–2020).
Figure 5 Decadal monthly mean sea-ice concentration and sea surface temperature and trends. Monthly decadal mean SIC and SST for Svalbard (a), (g), Northern Barents Sea (b), (h) and Franz Josef Land (c), (i) (see Fig. 2a). Estimated linear trends for SIC (d)–(f) and SST (j)–(l), respectively, for the same areas and for the three study periods. Full size image
The Svalbard region is largely affected by the warm Atlantic Water, making the western part mostly ice-free year-round (Fig. S7) and the whole region is close to ice-free during mid-summer (Fig. 5a). The largest decline has occurred in winter (Fig. 5d) where the mean SIC has decreased from 40 to 50% in the 80 s to 15–25% in the period 2011–2020 (Fig. 5a). The NBS and FJL regions have a generally higher mean SIC throughout the year and with winter SIC (November to May) well above 70% in the 80 s and 90 s (Fig. 5b–c). The NBS SIC has dropped by 5–15% per decade for all seasons, except for November when SIC decreased by more than 23% per decade during the last three decades and more than 27% the recent two decades (Fig. 5e). In FJL, the least decline in sea ice was during winter, however, a strongly reduced ice cover has occurred for the months from June to November with a pronounced and increasingly faster reduction in October–November (Fig. 5f).
The SST trends are overall positive in the Barents study area with the highest warming rates generally found in the third period (2001–2020) along the two branches of the Norwegian Atlantic Current. One of the branches flows along western Svalbard and the other crosses the Barents Sea towards the Arctic Ocean between FJL and Novaya Zemlya (Figs. 2j–l, 5j–l). Of the regions analyzed here, Svalbard west (Fig. 2a) had the highest trends with up to 0.8 °C per decade annually and 1.0 °C per decade in spring (Table 3). Svalbard south, related to the bathymetric trough Storfjordrenna (just south of the station Sørkappøya), also showed an accelerated warming trend (Fig. 2j–l). In the Barents Sea, a very strong warming (up to 0.8 °C per decade) occurred in the southeastern region just outside of the mean ice zone. Furthermore, the southwestern Kara Sea within the mean ice zone experienced a strong warming especially in the last two decades. The weakest SST trends were found for the FJL region ranging from nearly 0 °C per decade in winter and spring to 0.3–0.4 °C per decade in summer and autumn for 2001–2020 (Table 3).
Table 3 Trends in sea ice concentration and sea surface temperature. Full size table
Observed warming related to sea ice and SST
The spatial pattern of SIC trends resembles very much the SAT trends pattern across the Barents study area (Fig. 2). Figure 6a shows the scatter plot of annual SAT values from the 13 weather stations as a function of the annual SIC in the adjacent sea region (50 × 50 km) extracted from the high-resolution NIS ice charts. The values align well relating low SIC with higher SAT values and vice versa. The FJL stations, typically located further away from the sea ice edge, show a slightly steeper regression between SAT and the ice cover than the Svalbard stations, which more often are surrounded by less dense ice cover.
Figure 6 Correlation between sea ice concentration and surface air temperature. (a) Scatter plot between the annual SIC (calculated from 50 × 50 km boxes) and the annual SAT observed at the weather stations for 1981–2020. SAT data are original values only (no interpolations). (b) Scatter plot between the regional annual mean SIC (OSI SAF data) and SAT (from CARRA and ERA5) calculated from regional boxes (cf. Figure 2a) for the period 1991–2020. c 12-month running mean SIC- and SAT-anomalies for Hopen, based on the SIC 50 × 50 km boxes (NIS-dataset) and instrumental observations, respectively. The anomalies were computed with respect to the 1991–2020 mean. (d) Same as in c but for the NBS region, based on OSI SAF and CARRA datasets, respectively. (e) Scatter plot between 1991–2020 trends in SIC (calculated from 50 × 50 km boxes) and SAT from the weather stations for autumn (SON). (f) Same as in e but for winter (DJF) with regression lines for stations located in “Svalbard south, west and north” and “Svalbard east and FJL”. In (e) and (f) CARRA series at station locations is used for gap-filling where SAT data are missing in part of the series for Sørkappøya (Sø), Karl XII-øya (Ka), Kongsøya (Ko), Kvitøya (Kv), Rudolf Island (Ru), Nagurskaya (Na) and Ostrov Viktoria (Os). Stations are shown with symbols and the first two letters of the station name from (a). Full size image
On a regional scale, the annual SAT derived from both CARRA and ERA5 relate to the annual regional SIC (OSI SAF data) in the same manner as for the station observations (Fig. 6b). However, for the FJL and NBS regions, a stronger disagreement can clearly be seen between the two reanalyses for higher values of SIC (SIC > 50%), with lower SAT values for CARRA compared to ERA5. The lower CARRA temperatures over high SIC for the FJL and NBS regions correspond better with the observed SAT from the associated stations (Fig. 6a).
Both the long-term trend and the interannual variability show high compliance between the 12-month running mean of SIC versus SAT both locally and regionally (Fig. 6c,d). Similar high compliance was found for the two other main regions of Svalbard and FJL. From these time series, the signature warming peaks stand out very clearly for 2006, 2012, 2016 in both SIC and SAT, indicating the absence of a clear temporal lag between the two geophysical properties of sea ice and air temperatures.
Taking into account all 13 station locations, we find that the trends of the annual SAT relate well with the trends of annual SIC (R2 ~ 0.5 where R is the Pearson correlation coefficient). It is, however, the autumn and winter seasons that account for most of the high correlation between changes in SAT and SIC. Interactions between local SIC and SAT trends in autumn (SON, Fig. 6e) showed a significant correlation (R2 = 0.89) with the strongest warming and sea ice decline occurring for the FJL stations. In winter (DJF, Fig. 6f), a significant correlation was found as well, however, there was a clear regional difference between stations located in Svalbard south-west-north and stations in Svalbard east and FJL. The two latter areas, located in the east, had much lower SIC-trends during winter, than for the Svalbard south-west-north stations despite the as-high SAT trends of similar magnitude (Tables 1, 3). The outcome is shown as two separate regression lines in Fig. 6f for the south-west-north group of stations (R2 = 0.95) and the eastern stations (R2 = 0.70), respectively.
On a seasonal scale, the SST peaks in August, in close correspondence with the timing of SIC minimum (August–September), see Fig. 5. On the other hand, the SST trend has a remarkable strong peak in July (mainly NBS and FJL) prior to the SST peak, and a second peak in October–November (the third period in NBS and FJL and for all three periods in the Svalbard region) just before the trough of the SIC trend (Fig. 5). The two peaks in the SST trend caused a prolonging period of a warmer sea surface in the summertime. The warming trend in late autumn during 2001–2020 correlated well with the corresponding significant autumn peak seen in the SAT trend (Table 1).