Data
This study utilizes the Information Resources, Inc. (IRI) household scanner panel dataset. Households who made at least one meat or PBMA purchase from November 2018 to November 2020 were included. The resulting data set consists of individual-transaction data from 38,966 households. Each entry in the dataset is recorded at a universal product code (UPC) level. The dataset includes UPCs of the primary categories of beef, poultry, seafood, pork, PBMAs, turkey, etc. Each UPC code is attached to a product description which includes characteristics such as the brand, processing method, packaging, and size. Additionally, each UPC represents a specific set of product characteristics which include the brand, type of meat, fat content, weight, etc. We aggregated purchases to the weekly level, implying 104 weeks of observations for each of the 38,966 households.
The PBMAs did not include non-patty or non-ground substitutes such as sausage link substitutes. The PBMAs studied resemble ground meat products and are theoretically the closest substitute. Thus, we restricted analysis to purchases of ground meat options (ground beef, ground chicken, ground turkey, or ground/crumble/patty), and PBMA patties and burgers. The ground meat products include categories of ground beef, beef burgers, ground turkey, turkey burgers, ground chicken, soy burgers, and newer forms of PBMAs. The total number of transactions in the dataset are 505,262 consisting of 439 UPCs. The UPCs that remained in the dataset were those were purchased on 50 or more occasions in the span of the dataset. Many UPCs that were purchased on 50 or less occasions were unclear as to what the products specifically were, and thus were not considered for this analysis.
In addition to product characteristics, the demographics of each household are known. The demographics considered are the age of the household head (young (< 35), middle age (35–64), old (65 +)), the number of individuals in the household, marital status (married, single female, single male), education level (college degree or not), employment status (employed or not), income level (low (< $45,000), middle ($45,000-$99,999), high (> $100,000)), race (white, African-American, other races), Hispanic, and the presence of children. Due to the nature of the data, some household entries contain characteristics of both a female and male head of household. In these cases, the female characteristics are considered as the primary characteristics when a female household head is present due to the fact that a majority of primary shoppers in household are females47. Female characteristics were used when applicable for the age of the household head, and the education level as the other demographic characteristics were used to describe the household in general without taking into account the specific heads of household. Supplementary table 1 details the household demographic breakdown.
After identifying the relevant demographics and UPCs we aggregate the products using indicator variables for ground beef, turkey, chicken, and PBMAs. We aggregate the purchases for each of these product types for each individual household for each week over the span of two years. These aggregations formulate a dataset of 38,966 households that purchased at least one of the UPCs in the product categories of ground beef, turkey, chicken, and PBMAs. Next, we identified the households who purchased at least one PBMA over the span of the dataset, which added up to 7761 households.
Data analysis
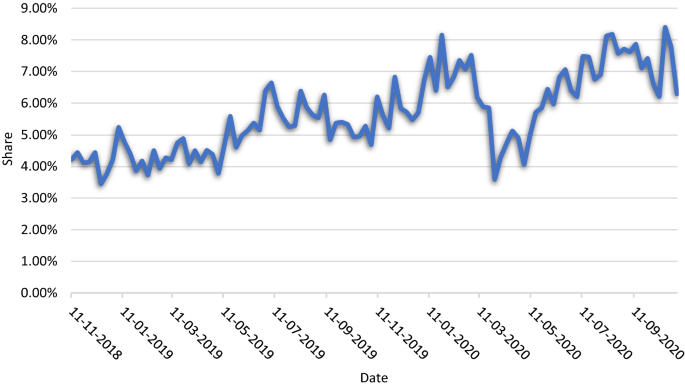
Our first market analysis is the expenditure share of PBMAs relative to other ground meats over the two year span of the dataset. We estimate the expenditure share by taking the sum of dollars spent on a particular ground meat option in a given week and divided that by the total expenditure on ground meat and PBMAs in a given week. Additionally, we estimate the market expenditures and units purchased for ground meats and PBMAs by taking the total expenditure and units purchased in a given week and divide that by the number of households who purchased a product in that specific week.
Next we estimate an overview of purchasing behavior by both the full sample and PBMA consumers estimating the share of PBMA buyers, the share of households that purchased PBMAs on more than one occasion, the share of households that did not purchase ground meat, the share of households who only purchased ground meat and no PBMAs, and the share of households who purchased both ground meat and PBMAs. We estimate the share of households that purchased PBMAs by denoting a household as a buyer if they purchased at least one PBMA over the span of two years. This provides the smaller subset of the sample of PBMA buyers. The share of households who made repeat purchases is estimated by examining if a household if made purchases of PBMAs on multiple occasions in the dataset. If they did make multiple purchases they were assigned an indicator variable for engaging in habit forming behavior. Next, we estimated the share of households that did not purchase ground meat. These estimates were calculated by assigning a dummy variable to a household that purchased at least 1 one ground meat item over the span of the dataset. If they received a “0” for this indicator they were included in the share that did purchase ground meat. Using the indicator variable for ground meat buyers and PBMA buyers, we also estimate the share of households who purchased ground meat only, and the share of households that purchased both ground meat and PBMAs.
After estimating the overall shares of household behaviors, we estimate the average aggregate number of units purchased, average number of weekly units purchased, average total expenditure, and average weekly expenditure for both PBMAs and ground meat. We estimate the number of units purchased by calculating the sum of units of ground meat and PBMAs purchased by a household. The weekly units are estimated by dividing the total number of units purchased by the 104 weeks of data collection. The same process is repeated for the ground meat and PBMA expenditures.
The final metric is to estimate if ground meat units and expenditures changed after the household entered the PBMA market by making their first purchase. We estimate the average weekly consumption of ground meat products by first finding the week that a household made their first purchase of a PBMA. Next we took the sum of ground meat units and expenditure on ground meat products before and after the first purchase occurred. After taking the sum of units and expenditures, we divide the sums by the number of weeks before and after the first purchase. The averages are then compared in a paired t-test to examine if purchasing patterns changed amongst households after the first PBMA purchase.
After the estimating the general behavioral overview of the households in the market, we analyzed the consumer segments and purchasing patterns by demographic groups. First we estimated the consumer segments, which were the share of PBMA buyers, the habit forming buyers who purchased on more than one occasion, the share of households who did not purchase PBMAs, the share of households who purchased both ground meat and PBMAs, and the share of households that did not purchase ground meat. To test the differences a chi-squared test was used where the null hypothesis is that no association is detectable between the binary outcome variable and the demographics.
Next, we estimated the demographic differences for the aggregate and weekly number of units purchased and expenditures for both ground meat options and PBMAs. Due to these variables being continuous outcomes, we employed an analysis of variance (ANOVA) test with a null hypothesis that the difference in means between demographic groups for these metrics were equal to 0.
The final metric we estimated was if household purchases and expenditures of ground meats and PBMAs after the beginning of the COVID-19 pandemic. We estimated the average number of units purchased and expenditures prior to March 1, 2020 and after. This date was chosen as it resembled the month in which the early stages of the economic disruptions from COVID-19 began in the food sector41. We tested the differences in the averages with a paired t-test before and after the beginning of the pandemic.
We confirm that all methods were carried out in accordance with the relevant guidelines from Information Resources Inc. (IRI) and Purdue University. Due to the nature of the data the approval to conduct research with this data was given by a signed contract with Information Resources Inc. (IRI). All respondents give consent to Information Resources Inc.