Battery materials requirements
The role of the current collector is to connect the cathode and anode to external circuitry. The ideal material therefore provides high electrical conductivity and low contact resistance. It is also important that the current collector doesn’t chemically react or dissolve in contact with the electrolyte. While metals such as aluminum and copper are typically used as current collector, their use for disposable electronics is a waste of valuable resources. Our current collector ink is composed of graphite flakes, carbon black, shellac and ethanol23. The graphite flakes (Fig. 2a) and carbon black (Fig. 2b) provide electrical conductivity to the composite (Fig. 2d). The smaller carbon black particles improve electrical contact between the larger and more conductive graphite flakes.
Figure 2 SEM micrographs of the (a) graphite flakes, (b) carbon black and (c) zinc particles comprised in the battery. (d) SEM micrograph of the current collector showing the densely packed graphite flakes, carbon black and shellac composite structure. (e) SEM micrograph of the cathode showing the loosely packed graphite flakes and shellac composite structure. (f) SEM micrograph of the anode on a partially discharged battery showing the porous shellac matrix that remains after zinc is consumed. (g) Graph of the viscosity as a function of shear rate showing the shear-thinning behavior of the current collector ink. (h) Graph of the storage and loss modulus as a function of shear stress showing the 600 Pa yield stress of the current collector ink. (i) Graph of the viscosity as a function of shear rate showing the shear-thinning behavior of the cathode ink. (j) Graph of the storage and loss modulus as a function of shear stress showing the 5600 Pa yield stress of the cathode ink. (k) Graph of the viscosity as a function of shear rate showing the shear-thinning behavior of the anode ink. (l) Graph of the storage and loss modulus as a function of shear stress showing the 750 Pa yield stress of the anode ink. Full size image
The role of the air cathode is to support the oxygen reduction reaction (ORR). The ideal material therefore maximizes the density of reaction sites and allows for oxygen in ambient air to reach these sites. Transition metals like Platinum or Cobalt are typically used as catalyst for the ORR reaction, effectively reducing the activation energy and increasing the reaction rate. We avoided this type of additive for our disposable battery because of the environmental concerns associated with the bioaccumulation of heavy metals. Our cathode ink is composed of graphite flakes, shellac and ethanol. Once dried, the graphite flakes (Fig. 2a) and the shellac create a porous structure (Fig. 2e). Compared to the current collector, the cathode provides a higher density of reaction sites and is permeable to air which allows for oxygen from ambient air to reach the reaction sites. It however has a lower electrical conductivity.
The role of the anode is to support the zinc oxidation reaction. In most commercial zinc air batteries, the anode is a piece of pure zinc which also serves as the current collector and as a structural part of the battery’s outer shell. This configuration simplifies fabrication and assembly, but a large proportion of the available zinc remains unused. While this is a viable approach for a closed loop system where devices are recycled at the end of their useful life, it’s not compatible with disposable applications. Our anode ink is composed of zinc powder, shellac and ethanol. The zinc (Fig. 2c) particles embedded in the shellac matrix are consumed during discharging, leaving behind a porous matrix of shellac (Fig. 2f). This approach provides the design flexibility of additive manufacturing and uses zinc discerningly i.e. only as the reactive element in the anode. The structural integrity is provided by the paper substrate and connections to outside circuitry are achieved with our carbon-based current collector.
Ink rheological properties
We characterized the rheological properties of our inks by measuring their shear thinning behavior and yield stress, two important properties for additive manufacturing technique such as robocasting, screen printing and stencil printing. The current collector ink exhibits shear thinning behavior and a yield stress of 600 Pa as shown in Fig. 2g and h, respectively. While only stencil printing is investigated in this work, we recently demonstrated the compatibility of this current collector ink with robocasting and screen printing. The cathode ink exhibits shear thinning behavior and a yield stress of 5600 Pa as shown in Fig. 2i and j, respectively. This rheology worked well for stencil printing. The yield stress is, however, at the higher end of the range for extrusion-based techniques like robocasting. For this type of additive manufacturing, the ink formulation could be slightly modified in order to achieve a yield stress closer to 103 Pa. The anode ink exhibits shear thinning behavior and a yield stress of 750 Pa as shown in Fig. 2k and l, respectively. The loss tangent (i.e. storage to loss modulus ratio) is lower than for the other inks, indicating a weaker gel. This had no impact on this work and this rheology worked well for stencil printing. A weaker gel, however, ultimately defines the maximum aspect ratio above which the gel starts flowing under its own weight.
Battery performance
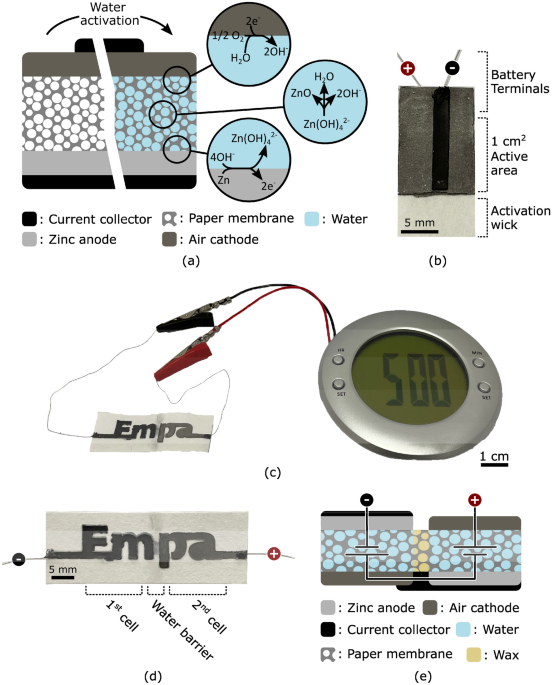
The performance of our paper battery was characterized using the device shown in Fig. 1b, and all measurements were made on the same device.
The open circuit potential of the battery was measured as a function of time. As presented in Fig. 3a, after water is provided to the system at time zero, it takes less than 20 s for the battery to activate and reach a stable 1.2 V open circuit potential. Electrochemical impedance spectroscopy measurements were also performed on the device before and after activation. The corresponding Nyquist plots are presented in Fig. 3b and c, respectively. The internal resistance decreases by more than three orders of magnitudes, dropping from 85 kΩ to 90 Ω upon activation. The same measurement was performed after discharging the device for 1 h at a constant current of 100 μA. Results presented in Fig. 3c show that the internal resistance further decreased to 70 Ω.
Figure 3 (a) Graph of the open circuit potential (OCP) of the single-cell battery as a function of time upon activation. Time zero corresponds to the moment water was dispensed on the activation wick. The battery shows a stable 1.2 V OCP and a 20 s activation time. (b) Nyquist plot of the battery before activation, showing an internal resistance R int of 85 kΩ. (c) Nyquist plots of the battery immediately upon activation (grey squares) and after 1 h of discharge at 100 μA (black dots), showing internal resistances R int of around 70 Ω and 90 Ω, respectively. (d) Chronopotentiogram of the battery (black solid line) and the corresponding current ramp (grey dotted line) as a function of time. (e) Graph of the power generated by the battery as a function of the current, showing a maximum of 150 μW at 0.5 mA. (f) Chronopotentiogram of the battery at a constant current of 100 μA, showing the process of drying and reactivating the device. The discontinuity in the data points is due to complementary analysis that were carried out on the sample at its peak operating voltage. Full size image
The power capability of the battery was characterized by measuring the operating voltage at different discharge currents ranging from 0.1 mA to 1 mA. Figure 3d shows the measured operating voltage (black solid line) and the corresponding discharge current (grey dotted line) as a function of time. Each current step lasts for 50 s, enough for the operating voltage to reach a stable value. Figure 3e shows the corresponding calculated electrical power as a function of the driving current. The device provided a maximum of 150 μW at 0.5 mA. Higher operating voltage can be achieved by connecting multiple electrochemical cells in series. As shown in Fig. 1c, our two cell battery was capable of powering an alarm clock and its liquid crystal display.
The discharge behavior of the battery was characterized by measuring the operating voltage over an extended period of time at constant current. Figure 3f presents the chronopotentiogram obtained at a constant current of 100 μA. The discontinuity at 30 min in the data points is where the experiment was stopped to measure the power capability of the device close to its peak operating performance. After 1 h of discharge (and the additional power capability measurements), performance significantly decreases due to drying of the paper substrate. At activation, the system was only provided with enough water to saturate the paper substrate which represents approximately 100 mg of water, corresponding to two drops of water dispensed directly on the battery’s wick using a pipette. Upon rehydration with the same amount of water, the battery readily recovers its performance and maintain a stable operating voltage of 0.5 V for more than 1 h. The operating time before rehydration is essentially limited by the amount of water that the paper membrane can absorb. An approach to extending operation time would be to use a larger or thicker wick, effectively using it as a reservoir.
To put these results into perspective it can be useful to look at the requirements of internet of things (IoT) devices. An IoT ecosystem is typically composed of distributed low-power transducers that can communicate with a centralized high-power processing unit. Power requirements varies by several order of magnitudes across the complete ecosystem, from 10 nW to 100 W24. As reported by Mish et al., miniaturized FM receivers can operate at around 1 mW. This is slightly above the demonstrated performance of our 1 cm2 single cell battery, but still within reach by connecting cells in parallel or by increasing the surface area of the battery. For device operating within the demonstrated performance range, we find hearing aid at 100 μW, RFID tag at 10 mW, electronic watch calculator at 1 μW and quartz oscillator at 100 nW. It should also be noted that low-power electronic devices can remain in standby while consuming as little as 10 nW, significantly decreasing the average power consumption.