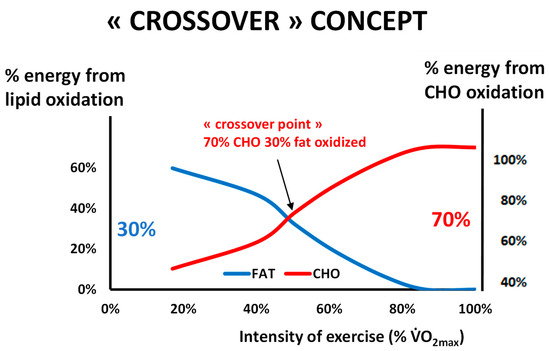
Figure 1. The classical picture of Brooks and Mercier’s “Crossover concept” redrawn from our personal database of more than 5000 exercise calorimetries (see text). This hypothesis assumes that there is a major shift in the balance of substrates used for oxidation during exercise grossly around 50% of the maximal aerobic capacity, when carbohydrates represent more than 70% of the sources of energy for the exercising body. Oxidative use of fat culminates below this level, and close to it or slightly above it, blood lactate increases and the ventilatory threshold occurs. Note that the ordinates for % of fat oxidation and % of CHO oxidation are not symmetric, in order to better visualize the crossover. In a series of more than 5000 exercise calorimetries, we find that the crossover point is, on average, at 55.1% of VO 2max but exhibits a wide variability among individuals.
Figure 1. The classical picture of Brooks and Mercier’s “Crossover concept” redrawn from our personal database of more than 5000 exercise calorimetries (see text). This hypothesis assumes that there is a major shift in the balance of substrates used for oxidation during exercise grossly around 50% of the maximal aerobic capacity, when carbohydrates represent more than 70% of the sources of energy for the exercising body. Oxidative use of fat culminates below this level, and close to it or slightly above it, blood lactate increases and the ventilatory threshold occurs. Note that the ordinates for % of fat oxidation and % of CHO oxidation are not symmetric, in order to better visualize the crossover. In a series of more than 5000 exercise calorimetries, we find that the crossover point is, on average, at 55.1% of VO 2max but exhibits a wide variability among individuals.
Figure 2. An example of exercise calorimetry performed on a 75-year-old male subject explored for training prescription in grade-2 obesity (weight 99.3 kg, body mass index: 36 kg/m², percentage of fat: 27.7%, VO 2max ACSM: 19.7 mL/min/kg). Four 6-min steps were performed: 20, 40, 70, and 100 watts. The crossover point is found at 68 Watts (i.e., 56% of maximal aerobic power) and the LIPOXmax is found at 51 Watts (i.e., 42% of maximal aerobic power). The MFO is 297 mg/min, i.e., 8.2 mg/min/kg of muscle mass. CHO represents 100% of the oxidized substrates above 100 watts, i.e., 82% of maximal aerobic power. It can be seen that over the range of intensities applied during the test, CHO oxidation can be approximately modeled as a straight line ( carbohydrate cost of the watt ) whose slope is, in this individual, 0.24 mg/min/kg/watt.
Figure 2. An example of exercise calorimetry performed on a 75-year-old male subject explored for training prescription in grade-2 obesity (weight 99.3 kg, body mass index: 36 kg/m², percentage of fat: 27.7%, VO 2max ACSM: 19.7 mL/min/kg). Four 6-min steps were performed: 20, 40, 70, and 100 watts. The crossover point is found at 68 Watts (i.e., 56% of maximal aerobic power) and the LIPOXmax is found at 51 Watts (i.e., 42% of maximal aerobic power). The MFO is 297 mg/min, i.e., 8.2 mg/min/kg of muscle mass. CHO represents 100% of the oxidized substrates above 100 watts, i.e., 82% of maximal aerobic power. It can be seen that over the range of intensities applied during the test, CHO oxidation can be approximately modeled as a straight line ( carbohydrate cost of the watt ) whose slope is, in this individual, 0.24 mg/min/kg/watt.
Figure 3. Schematic representation of the events explaining the “bell-shaped curve” of lipid oxidation when exercise intensity increases (see text). Lipolysis is not the limiting step and is still active far above the “crossover point”, but lipid oxidation is inhibited by the metabolites generated by the increase in the rate of CHO oxidation, which becomes the dominant fuel. At this intensity level, blood lactate increases because of the high rate of carbohydrate processing. Therefore, the LIPOXmax (intensity where lipid oxidation reaches its top) occurs below the “crossover point”, the rise in blood lactate, and the ventilatory threshold. The drawing of lipid oxidation is obtained from our database including 5258 calorimetries, and the point of maximal lipid oxidation occurred at 47 ± 1% of VO 2max . At the level of LIPOXmax, individuals oxidized 209.5 ± 1.37 mg/min of lipids. This level is widely variable among individuals. Lactate data are from [ Schematic representation of the events explaining the “bell-shaped curve” of lipid oxidation when exercise intensity increases (see text). Lipolysis is not the limiting step and is still active far above the “crossover point”, but lipid oxidation is inhibited by the metabolites generated by the increase in the rate of CHO oxidation, which becomes the dominant fuel. At this intensity level, blood lactate increases because of the high rate of carbohydrate processing. Therefore, the LIPOXmax (intensity where lipid oxidation reaches its top) occurs below the “crossover point”, the rise in blood lactate, and the ventilatory threshold. The drawing of lipid oxidation is obtained from our database including 5258 calorimetries, and the point of maximal lipid oxidation occurred at 47 ± 1% of VO. At the level of LIPOXmax, individuals oxidized 209.5 ± 1.37 mg/min of lipids. This level is widely variable among individuals. Lactate data are from [ 59 ] and intramuscular lipolysis from [ 60 ]. HSL: Hormone-sensitive lipase activity.
Figure 3. Schematic representation of the events explaining the “bell-shaped curve” of lipid oxidation when exercise intensity increases (see text). Lipolysis is not the limiting step and is still active far above the “crossover point”, but lipid oxidation is inhibited by the metabolites generated by the increase in the rate of CHO oxidation, which becomes the dominant fuel. At this intensity level, blood lactate increases because of the high rate of carbohydrate processing. Therefore, the LIPOXmax (intensity where lipid oxidation reaches its top) occurs below the “crossover point”, the rise in blood lactate, and the ventilatory threshold. The drawing of lipid oxidation is obtained from our database including 5258 calorimetries, and the point of maximal lipid oxidation occurred at 47 ± 1% of VO 2max . At the level of LIPOXmax, individuals oxidized 209.5 ± 1.37 mg/min of lipids. This level is widely variable among individuals. Lactate data are from [ Schematic representation of the events explaining the “bell-shaped curve” of lipid oxidation when exercise intensity increases (see text). Lipolysis is not the limiting step and is still active far above the “crossover point”, but lipid oxidation is inhibited by the metabolites generated by the increase in the rate of CHO oxidation, which becomes the dominant fuel. At this intensity level, blood lactate increases because of the high rate of carbohydrate processing. Therefore, the LIPOXmax (intensity where lipid oxidation reaches its top) occurs below the “crossover point”, the rise in blood lactate, and the ventilatory threshold. The drawing of lipid oxidation is obtained from our database including 5258 calorimetries, and the point of maximal lipid oxidation occurred at 47 ± 1% of VO. At the level of LIPOXmax, individuals oxidized 209.5 ± 1.37 mg/min of lipids. This level is widely variable among individuals. Lactate data are from [ 59 ] and intramuscular lipolysis from [ 60 ]. HSL: Hormone-sensitive lipase activity.
Figure 4. The lipid oxidation zone or “LIPOX zone” corresponds to a level of light to moderate exercise (usually 30–50% of VO 2max , quoted from “very light” to “moderate” on scales of perceived exertion, and corresponding in practice to 50–70% of the maximal heart rate (HRmax). Equivalences between % of VO 2max and % heart rate reserve (HRR) and % VO 2 reserve are calculated according to [ The lipid oxidation zone or “LIPOX zone” corresponds to a level of light to moderate exercise (usually 30–50% of VO, quoted from “very light” to “moderate” on scales of perceived exertion, and corresponding in practice to 50–70% of the maximal heart rate (HRmax). Equivalences between % of VOand % heart rate reserve (HRR) and % VOreserve are calculated according to [ 154 155 ].
Figure 4. The lipid oxidation zone or “LIPOX zone” corresponds to a level of light to moderate exercise (usually 30–50% of VO 2max , quoted from “very light” to “moderate” on scales of perceived exertion, and corresponding in practice to 50–70% of the maximal heart rate (HRmax). Equivalences between % of VO 2max and % heart rate reserve (HRR) and % VO 2 reserve are calculated according to [ The lipid oxidation zone or “LIPOX zone” corresponds to a level of light to moderate exercise (usually 30–50% of VO, quoted from “very light” to “moderate” on scales of perceived exertion, and corresponding in practice to 50–70% of the maximal heart rate (HRmax). Equivalences between % of VOand % heart rate reserve (HRR) and % VOreserve are calculated according to [ 154 155 ].
Figure 5. Schematic representation of physiological situations that modify the asymmetrical dome-shaped curve of lipid oxidation.
Figure 5. Schematic representation of physiological situations that modify the asymmetrical dome-shaped curve of lipid oxidation.
Figure 6. An attempt to summarize hormonal influences that shift the balance of substrates towards more carbohydrate vs. more fat oxidation. As indicated in the text, this issue remains poorly investigated.
Figure 6. An attempt to summarize hormonal influences that shift the balance of substrates towards more carbohydrate vs. more fat oxidation. As indicated in the text, this issue remains poorly investigated.
Figure 7. Follow-up of a cohort of 12 obese patients regularly followed over 96 months (results partially presented in [18,231, Follow-up of a cohort of 12 obese patients regularly followed over 96 months (results partially presented in [ 33 ] and further updated in January 2022). This is the continuation of previously presented shorter follow-up studies [ 17 256 ]. Results show that the weight-lowering effect of LIPOXmax training persists over more than 8 years.
Figure 7. Follow-up of a cohort of 12 obese patients regularly followed over 96 months (results partially presented in [18,231, Follow-up of a cohort of 12 obese patients regularly followed over 96 months (results partially presented in [ 33 ] and further updated in January 2022). This is the continuation of previously presented shorter follow-up studies [ 17 256 ]. Results show that the weight-lowering effect of LIPOXmax training persists over more than 8 years.
Figure 8. An example of exercise calorimetry in a patient exhibiting a markedly ‘biphasic’ profile of substrate oxidation during exercise. Opposite effects on eating behavior of the two zones of the balance of substrates may, in part, explain why exercise targeted toward fat oxidation induces weight loss [ An example of exercise calorimetry in a patient exhibiting a markedly ‘biphasic’ profile of substrate oxidation during exercise. Opposite effects on eating behavior of the two zones of the balance of substrates may, in part, explain why exercise targeted toward fat oxidation induces weight loss [ 30 344 ]), while short bouts of exercise targeted toward higher intensities in the zone of predominant oxidation of CHO may induce overeating and paradoxical weight gain [ 345 ].
Figure 8. An example of exercise calorimetry in a patient exhibiting a markedly ‘biphasic’ profile of substrate oxidation during exercise. Opposite effects on eating behavior of the two zones of the balance of substrates may, in part, explain why exercise targeted toward fat oxidation induces weight loss [ An example of exercise calorimetry in a patient exhibiting a markedly ‘biphasic’ profile of substrate oxidation during exercise. Opposite effects on eating behavior of the two zones of the balance of substrates may, in part, explain why exercise targeted toward fat oxidation induces weight loss [ 30 344 ]), while short bouts of exercise targeted toward higher intensities in the zone of predominant oxidation of CHO may induce overeating and paradoxical weight gain [ 345 ].
Figure 9. An example of the biphasic profile of substrate oxidation in a 48-year-old woman who suddenly gained weight after discontinuing sport practice. Current weight is 96 kg (percentage of body fat 37.6%). The LIPOXmax occurs at 64 watts (i.e., 42% VO 2max ), and MFO at this level is 282 mg/min. However, the optimal level of fat/carbohydrate oxidation ratio (OLORFOX) [ An example of the biphasic profile of substrate oxidation in a 48-year-old woman who suddenly gained weight after discontinuing sport practice. Current weight is 96 kg (percentage of body fat 37.6%). The LIPOXmax occurs at 64 watts (i.e., 42% VO), and MFO at this level is 282 mg/min. However, the optimal level of fat/carbohydrate oxidation ratio (OLORFOX) [ 352 ] occurs at a lower power intensity at 23 watts, so the target heart rate can be proposed as 82 b/min, rather than 92 bpm, if one wants to spare carbohydrates.
Figure 9. An example of the biphasic profile of substrate oxidation in a 48-year-old woman who suddenly gained weight after discontinuing sport practice. Current weight is 96 kg (percentage of body fat 37.6%). The LIPOXmax occurs at 64 watts (i.e., 42% VO 2max ), and MFO at this level is 282 mg/min. However, the optimal level of fat/carbohydrate oxidation ratio (OLORFOX) [ An example of the biphasic profile of substrate oxidation in a 48-year-old woman who suddenly gained weight after discontinuing sport practice. Current weight is 96 kg (percentage of body fat 37.6%). The LIPOXmax occurs at 64 watts (i.e., 42% VO), and MFO at this level is 282 mg/min. However, the optimal level of fat/carbohydrate oxidation ratio (OLORFOX) [ 352 ] occurs at a lower power intensity at 23 watts, so the target heart rate can be proposed as 82 b/min, rather than 92 bpm, if one wants to spare carbohydrates.
Figure 10. Summary picture. Maximal oxidation during exercise is determined by genetic background and gender, as well as hormones (catecholamines, GH, estradiol), exercise habits, and nutrition. It is a rather stable and reproducible parameter, unless subjects change their lifestyle, and is impaired in various pathologic conditions (obesity, diabetes, sleep apnea, bariatric surgery). This level or others closely related can be used for targeting exercise training. There is now good evidence that in the middle term (2–6 months), this variety of exercise training improves mitochondrial function, VO 2max , lipid oxidation during exercise, parameters of glucose disposal, LDL cholesterol, and low-grade inflammation. Fat mass decreases and fat-free mass are maintained. In diabetics, the decrease in HbA 1c elicited by this variety of training is of the same magnitude as that of other protocols (−0.6%). In fact, the effects on VO 2max , blood pressure, and circulating levels of lipids at 2–6 months are less pronounced than those of higher-intensity protocols and interval training. A moderating effect on sedentarity-associated overeating is also reported by several studies and occurs over the first week. Long-term effects are only reported by a limited number of nonrandomized studies but they appear to be prolonged (up to 7 years), inducing a gradual improvement in body composition (loss of central and limb fat mass, maintenance of muscle mass) and blood pressure. Whether such prolonged training can have other beneficial effects is not yet known. More studies are needed to better describe and understand all these processes.
Figure 10. Summary picture. Maximal oxidation during exercise is determined by genetic background and gender, as well as hormones (catecholamines, GH, estradiol), exercise habits, and nutrition. It is a rather stable and reproducible parameter, unless subjects change their lifestyle, and is impaired in various pathologic conditions (obesity, diabetes, sleep apnea, bariatric surgery). This level or others closely related can be used for targeting exercise training. There is now good evidence that in the middle term (2–6 months), this variety of exercise training improves mitochondrial function, VO 2max , lipid oxidation during exercise, parameters of glucose disposal, LDL cholesterol, and low-grade inflammation. Fat mass decreases and fat-free mass are maintained. In diabetics, the decrease in HbA 1c elicited by this variety of training is of the same magnitude as that of other protocols (−0.6%). In fact, the effects on VO 2max , blood pressure, and circulating levels of lipids at 2–6 months are less pronounced than those of higher-intensity protocols and interval training. A moderating effect on sedentarity-associated overeating is also reported by several studies and occurs over the first week. Long-term effects are only reported by a limited number of nonrandomized studies but they appear to be prolonged (up to 7 years), inducing a gradual improvement in body composition (loss of central and limb fat mass, maintenance of muscle mass) and blood pressure. Whether such prolonged training can have other beneficial effects is not yet known. More studies are needed to better describe and understand all these processes.
Table 1. Factors, diseases, and physiological situations that have been studied for their effect, or lack of effect, on the ability to oxidize lipids during exercise.
Table 1. Factors, diseases, and physiological situations that have been studied for their effect, or lack of effect, on the ability to oxidize lipids during exercise. Modifying Factor Effect References Previous meal taken less than 3 h before Decreased MFO and shifted LIPOXmax to a slightly lower intensity [5,6,111,112,113] Dietary carbohydrate and fat intake Dietary carbohydrate and fat intake make modest but independent contributions to the interindividual variability in the capacity to oxidize fat during exercise. [114] Polyphenols of green tea They increase maximal fat oxidation and shifts the point where fat is no longer oxidized to higher intensity levels [115,116] Anthocyanins from Prunus cerasus L. Reported to be capable of augmenting fat oxidation but do not modify MFO [117] Low-fat diet Decreases fat oxidation during exercise [118] Previous exercise performed just before the exercise calorimetry 1 h single bout of moderate-intensity exercise slightly increases MFO [119] Puberty LIPOXmax and MFO are higher in prepubertal children and gradually decrease throughout puberty to reach adult values at the end of puberty [120,121,122,123] Type of exercise Higher during running than cycling in adults and in pre- to early pubertal children [63,122] Ramadan At the end of Ramadan, subjects had increased their fat utilization during exercise, with a right-shift of the cross-over point and the LIPOXmax and an increase in MFO [124] Gender Women oxidize slightly more lipids, and on average, their LIPOXmax occurs at higher relative output. Estradiol and progesterone seem to have opposite effects, with estradiol eliciting greater lipid oxidation.
Greater use of fat and reduced amount of CHO usage during the luteal vs. follicular phase, directly related to the change in estradiol. [122,125,126,127,128,129,130,131,132] Temperature Shift to preferential CHO oxidation during exercise in hot environments. Reversal after acclimation and training. [133,134] Highly trained athletes Most of them exhibit a markedly high ability to oxidize lipids during exercise but in some sports such as soccer, preferential use of CHO is often observed [5,59,135,136,137] Obesity and diabetes LIPOXmax values markedly shifted to lower power intensities and MFO decreased.
After bariatric surgery the LIPOXmax is shifted to lower intensities. [32,138] Hypoxia Exposure to hypoxia did not induce a consistent change in the balance of substrates during exercise compared with normoxia [139] Cardiometabolic risk factors Increased waist circumference
and plasma triacylglycerols are associated with impaired lipid oxidation [140] Non-alcoholic hepatic steatosis Inverse correlation between LIPOXmax and the fatty liver index [141] Sedentary time, and physical activity time Sedentary impairs, while physical activity improves, MFO and LIPOXmax. More studies needed. [142] Cardiorespiratory fitness (CRF) MFO and Fatmax are positively correlated with VO 2max [143] Metformin Increases fat oxidation during exercise and decreases its postexercise rise [144] Type 2 diabetes Lower ability to oxidize lipids when compared to subjects matched for body mass index (difference not found by all authors) [145,146] Type 1 diabetes Lower ability to oxidize lipids [147,148] Sleep apnea syndrome Lower ability to oxidize lipids during exercise. Training improves both apnea index and lipid oxidation during exercise (MFO and LIPOXmax values) [149] Fasting Peak fat oxidation increased in prolonged fasted state and this was highly correlated with plasma free fatty acids concentrations. [150] Protein intake A moderate increase in daily protein intake up to 1 g·kg−1·d−1 improves the maximal ability to oxidize fat during exercise. [151] Anorexia nervosa Lower ability to oxidize fat during exercise due to the decrease in muscle mass [152]
Table 2. Studies investigating the effect of LIPOXmax training in overweight. The studies on LIPOXmax training after sleeve gastrectomy are not in this table and are discussed in the text in Studies investigating the effect of LIPOXmax training in overweight. The studies on LIPOXmax training after sleeve gastrectomy are not in this table and are discussed in the text in Section 5.5 . It can be seen in this table that most studies (and mostly the randomized trials) are of short duration. The best-designed among these studies have been included in a recent meta-analysis [ 16 ], which concludes that this training procedure is undoubtedly an efficient weight-reducing strategy. There are very few long-term studies, and these are ‘real world studies’ representing the follow-up of patients over a long period. Those long-term studies show that even if the weight-lowering effect of LIPOXmax training is rather slow, it is prolonged and allows sustained weight loss over periods as long as 96 months.