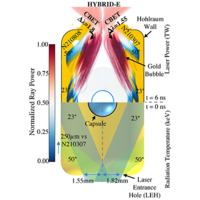
Figure 1
(a) Top: Calculated positions of the wall and capsule materials [gold-lined depleted uranium hohlraum (orange), HDC ablator (light gray), and DT ice layer (blue)] at peak power (6 ns) from radiation-hydrodynamic HYDRA simulations with simulated laser rays colored by relative power overlaid. Implosion symmetry control is accomplished via cross-beam energy transfer (CBET) in low-gas-filled ( ∼ 0.3 g / cm 3 ) hohlraums [6] from the “outer” laser beams ( 44 . 5 ∘ and 50 ∘ ) to the “inner” beams ( 23 ∘ and 30 ∘ ) by detuning the wavelengths relative to each other ( Δ λ ). (a) Bottom: Hybrid-E target geometry at t = 0 with laser beam pointing (laser cones are labeled by their respective polar angle) for the new (N210808, left) and previous (N210307, right) configurations. (b) The total (thick curves), “outer” cone (thin middle curves), and “inner” cone (thin lower curves) laser powers vs time (i.e., pulse shape) for experiments N210808 (red) and N210307 (blue). The balancing of power between the “outer” and “inner” cones together with CBET is tailored to give precise control of the time-dependent radiation drive symmetry. (c) Simulated hohlraum internal radiation temperature, T rad , histories for N210808 (red) and N210307 (blue). The extended T rad , for N210808 compared to N210307 results in increased late-time ablation pressure and reduced “coast time.” The near vertical rise of the T rad at t ∼ 9.2 ns seen in the red curve is reheating of the hohlraum from the capsule fusion output. “Bang times” or time of peak neutron production and times of peak implosion velocity are also denoted. (d) Calculated change in cone powers as a result of CBET moving power from the “outer” beams to the “inner” beams, incident in black and post-CBET in red. This calculation uses multipliers on the incident powers to match experimental tuning data [7]. (e) Ratio of the “inner” cone power to total laser power for the incident pulse (black) and post-CBET pulse (red) from the calculation in (d). See the text for more information.