Observed arctic amplification
The evolution of global mean and Arctic mean temperatures during 1950–2021 is shown in Fig. 1a by considering the four observational datasets: NASA’s Goddard Institute for Space Studies Surface Temperature version 4 (GISTEMP), the Berkeley Earth temperature dataset (BEST), the Met Office Hadley Centre/Climatic Research Unit version 5.0.1.0 (HadCRUT5) and ERA5 reanalysis. Compared to the global temperatures (Fig. 1a, light colours), the warming in the Arctic (Fig. 1a, dark colours) is much more pronounced, especially since the late 1970s. We note also that the different datasets are in a close agreement since 1979, but in the pre-1979 period ERA5 is markedly colder than the three other datasets. Reasons for this cold bias are presumably related to lower number of assimilated observations, as discussed in earlier studies42,43.
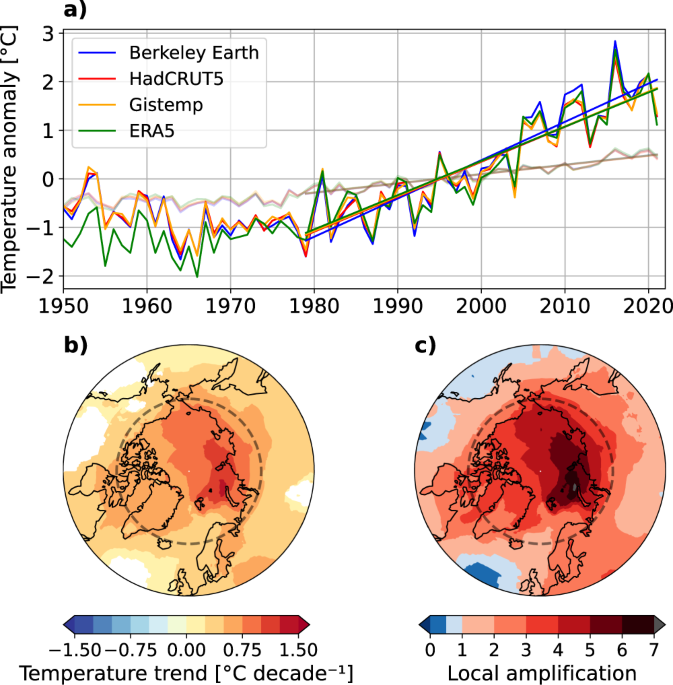
Fig. 1: Annual mean temperature evolution in the Arctic. a Annual mean temperature anomalies in the Arctic (66.5∘–90∘N) (dark colours) and globally (light colours) during 1950–2021 derived from the various observational datasets. Temperature anomalies have been calculated relative to the standard 30-year period of 1981–2010. Shown are also the linear temperature trends for 1979–2021. b Annual mean temperature trends for the period 1979–2021, derived from the average of the observational datasets. Areas without a statistically significant change are masked out. c Local amplification ratio calculated for the period 1979–2021, derived from the average of the observational datasets. The dashed line in (b) and (c) depicts the Arctic Circle (66.5∘N latitude). Full size image
Due to the good agreement over the last 43 years, we next consider the average of these four datasets as an observational estimate. The observations indicate that, during 1979–2021, a large fraction of the Arctic Ocean was warming faster than 0.75 ∘C decade−1 (Fig. 1b), with a maximum warming in the Eurasian sector of the Arctic Ocean, near Svalbard and Novaya Zemlya. In this region, the temperature trend over 1979–2021 locally exceeds 1.25 ∘C decade−1 (Fig. 1b). In contrast, large continental regions in the North America and, to a lesser extent, in Western Siberia, do not manifest statistically significant trends in temperatures; however these regions are mainly located in mid-latitudes and are only indirectly affected by AA. The spatial patterns of temperature trends are broadly consistent across the individual observational datasets (Fig. S2), with GISTEMP and HadCRUT5 showing somewhat less pronounced warming maxima near Svalbard and Bering Strait (Fig. S2a and c) than BEST and ERA5.
When the temperature trends shown in Fig. 1b are divided by the multi-dataset global mean temperature trend at each grid-point, we get the spatial map of 43-year local Arctic amplification (AA 43 ), or simply local amplification when calculated for areas south of the Arctic circle (Fig. 1c). Values higher than one indicate that those regions are warming faster than the global average, while values below one correspondingly indicate a slower warming. The AA 43 maps for individual observational datasets are provided in the Supplementary Fig. S3.
During 1979–2021, major portions of the Arctic Ocean were warming at least four times as fast as the global average (Fig. 1c). The most extreme AA values occur in the sea areas near Novaya Zemlya, which were locally warming up to seven times as fast as the global average. These high warming rates are consistent with recent research44, and evidently, the primary reason for such a high amplification ratio is the reduction of cold-season ice cover, which has been most pronounced in the Barents Sea44,45. Furthermore, it has been found that changes in atmospheric circulation have amplified the warming in this area46,47. In general, there are no regions within the Arctic Circle where AA 43 is smaller than two, apart from the northern North Atlantic.
The observed multi-dataset mean temperature trend in the Arctic is 0.73 ∘C decade−1 and for the globe as a whole 0.19 ∘C decade−1, with small differences between the individual datasets (Fig. S4a). Using Eq. (1) and the multi-dataset mean values for the Arctic and global mean warming trends, we arrive at AA 43 (hereafter referred as observed AA 43 ) of 3.8 for the latest 43-year period of 1979–2021. The individual AA 43 values range from 3.7 in ERA5 to 4.1 in BEST (Table 1 and Fig. S4b). Thus, referring Arctic warming as being two times as fast as the global mean clearly underestimates the situation during the recent 43 years.
Table 1 Arctic amplification ratio and its 5th and 95th percentiles calculated for the period 1979–2021 from the observational datasets, CMIP5 ensemble, and CMIP6 ensemble. Full size table
When different southern boundaries for the Arctic region are considered, AA 43 ranges generally between 3 and 4 (Fig. 2a). In general, with any reasonable combination for the length of the time window (≥20 years) and for the southern boundary of the Arctic (60∘–75∘N), the value of AA is greater than 3. The magnitude of AA increases towards higher Arctic latitude thresholds, because with higher latitude a larger proportion of the area encircled by the boundary is ocean, where AA is the strongest (Fig. 1c).
Fig. 2: The sensitivity of Arctic amplification ratio to the Arctic area and the period of interest. The sensitivity of Arctic amplification (AA) (a) to the time window used in calculating the linear trends (x-axis) and the southern boundary of the Arctic (y-axis), and (b) the percentile rank of the observed AA in the CMIP6 ensemble distribution. The end year of all linear trends is fixed to 2021. Thus, for example, 50 years on the x-axis corresponds to the trend calculated for 1972–2021. The star marks the baseline value used in the study, corresponding to the 43-year linear trend and the southern boundary of 66.5∘N. The observed AA is derived from the average of the four observational datasets. Full size image
Arctic amplification in CMIP5 and CMIP6 simulations
Figure 3 demonstrates how the observed AA 43 has intensified in the course of time: while in the beginning of the century the warming ratio of the Arctic to the globe over the previous 43 years was smaller than three, the recent amplified Arctic warming48 relative to the globe has raised the ratio close to four.
Fig. 3: The 43-year Arctic amplification ratio in observations and climate models. The 43-year Arctic amplification (AA) ratio derived from (a) CMIP5, (b) CMIP6, (c) MPI-GE and (d) CanESM5 realizations (thin grey lines) for all 43-year periods ending in 2000–2040. The x-axis represents the ending year of the 43-year AA ratios. Thick black lines represents the ensemble mean AA, calculated as a mean of ratios, not ratio of means. Observations (red lines) extend to 2021. 43-year AA ratios starting after 1970 and ending by 2040 are considered in the probability calculations (Section “Likelihood of observed Arctic amplification 1979–2021 in climate model simulations”) and shown with light background. The Arctic is defined as the area north of 66.5∘N. Full size image
The observed four-fold warming in the Arctic fits poorly in the spread of the CMIP5 and CMIP6 multi-model ensembles (Fig. 3). Compared with the observed AA 43 in 2021 (3.8), the CMIP5 ensemble-mean AA 43 (2.5) and CMIP6 ensemble-mean (2.7) are underestimated by 34% and 29%, respectively (Fig. 3a, b and S5b). However, the observed AA 43 reflects both the forced response to external forcing as well as the internal climate variability on the multi-decadal timescales considered here. Instead, in the ensemble mean of the climate models, the internal variability of climate system has been effectively averaged out, and thus the ensemble mean reflects only the models’ response to the external forcing. For this reason, comparing the observations only to the ensemble mean may be misleading, and therefore, the observed AA 43 needs to be put into context of the envelope of simulated AA 43 .
In the CMIP5 ensemble, there are only a few realizations which simulate stronger amplification than the observations (Fig. 3a). However, the fact that only one realization per model is used in the CMIP5 ensemble may imply that some of the extreme cases are missing. In general, CMIP6 models simulate slightly stronger AA 43 than CMIP5 models. Nonetheless, the majority of CMIP6 realizations in which the simulated AA 43 is stronger than the observed AA 43 , occur earlier in the 21st century (Fig. 3b). It is also worth noting that CMIP6 models have generally a larger spread in AA 43 than CMIP5, even when considering only one realization per CMIP6 model (not shown). Some CMIP6 realizations simulate cooling for the Arctic (negative AA 43 ) while some other realizations have higher than five-fold warming in the Arctic compared to the globe (Fig. 3b). The large spread in CMIP6-simulated AA is in line with an earlier study39 and highlights the effect of large internal variability for AA, even on a 43-year time scale.
Figure 4 shows AA as a function of the starting year used for calculating the trends. In general, the shorter the time period for which AA is calculated, the larger role the internal variability plays, and therefore the ensemble spread of the models tends to explode towards the right edge of the panels (i.e., towards shorter trends, Fig. 4). Considerable fraction of simulations with negative AA or very large AA (above 6) for trends shorter than 20 years suggest that such short periods may not be suitable for reliable estimation of AA. The long trends, on the other hand, are more representative of the forced amplification and therefore have less spread between the realizations. The observed AA is outside the spread of CMIP5 under wide range of the trend lengths (Fig. 4a). In CMIP6, the spread of AA is clearly wider than in CMIP5 and thus, the observed AA does not fall fully outside the CMIP6 ensemble at any starting year (Fig. 4b). Nevertheless, the observed AA is a very rare occasion in CMIP6 model simulations as Fig. 2b shows that in most cases when AA is calculated over time period longer than 20 years and for southern boundary poleward from 60∘N, the observed AA falls to the top 10% of the CMIP6 model ensemble and reaching to the 99th percentile of the ensemble in several window-latitude combinations. Remarkably, for CMIP5, the observed AA is fully outside the ensemble spread at all 30-45-year trend lengths regardless of southern boundary (Fig. S6b).
Fig. 4: Arctic amplification ratio as a function of the starting year of the trend in observations and climate models. Arctic amplification (AA) ratio as a function of the starting year of the trend derived from (a) CMIP5, (b) CMIP6, (c) MPI-GE and (d) CanESM5 realizations (thin grey lines). The end year of all linear trends is fixed to 2021. Thus, for example, 1950 on the x-axis corresponds to AA calculated for 1950–2021. Thick black lines represents the ensemble mean AA, calculated as a mean of ratios, not ratio of means. AA ratios shorter than 10 years are not shown. The dashed vertical line represents the 43-year AA, as calculated for 1979–2021. The Arctic is defined as the area north of 66.5∘N. Full size image
It is important to note that the discrepancy between the observational and modelled AA is sensitive to the starting year of the trend. For example, when AA is calculated using the 1950–2021 time period, the observed AA is very close to the ensemble means of all climate model datasets (the left edge of the panels in Fig. 4). However, this time period includes a 30-year period of 1950–1979 when the global mean temperatures did not rise mostly due to opposing effect of the anthropogenic aerosols counteracting the greenhouse gas-induced warming49. In 1950–1979, the temperatures in the Arctic were slightly cooling (except in ERA5, see Fig. 1a). Because of this non-linearity in the observations, the linear trend estimate over the whole 1950–2021 does not capture the entire dynamics of the recent warming in the Arctic and thus should be interpreted with caution.
By considering the seasonality of AA (Fig. 5), we see that AA is the strongest in the late autumn (November) and the weakest in the warm season (July). This is consistent in both CMIP6 models and the observations, and in line with the earlier study conducted with ERA-Interim reanalysis data and CMIP5 models8. Thus, over the past 43 years, the October-December months in the Arctic have warmed five times faster than the globe, while the warming ratio is close to two in June-August (Fig. 5). The stronger AA in late autumn arises from the newly opened water areas that act to enhance upwelling longwave radiation and turbulent fluxes of sensible and latent heat from the sea into the atmosphere8.
Fig. 5: Seasonality of the 43-year (1979–2021) Arctic amplification ratio. The red circles indicate the observed AA, as derived from the average of the four observational datasets. The orange lines indicate the medians of CMIP6 realizations, boxes show the first and third quartiles, and whiskers extend to the 5–95th percentiles of the realizations. The numbers in the upper row give the percent rank of the observed AA in the CMIP6 ensemble distribution. The Arctic is defined as the area north of 66.5∘N. Full size image
The observations systematically indicate larger AA than CMIP6 models around the year. In all months, the observed AA 43 falls to the upper 25 % of the CMIP6 ensemble, and even to the top 5% in April, May, June, and August. The monthly comparison of observations to CMIP5 models indicate even more pronounced underestimation of AA, especially in the melting season (Fig. S7). An interesting finding from Fig. 5 is the anomalously high observed AA in April. The high AA 43 in April is consistent in all four observational datasets (not shown), and has been reported also in the earlier studies41,50. However, while Hahn et al.41 noted that the warming in April falls within the intermodel spread for CMIP6 in 1979–2014, we found that when normalized with global warming, the warming in April is distinctly outside the CMIP6 ensemble (Fig. 5). According to Hahn et al.41, model biases in the reductions of spring snow cover may contribute to the discrepancy between observations and models in the melting season.
Likelihood of observed Arctic amplification 1979–2021 in climate model simulations
How likely is the nearly four-fold warming in the Arctic, as observed in 1979–2021? To answer this question, we investigate all possible AA 43 ratios starting after 1970 and ending by 2040 from all four climate model ensembles (see Section “Comparison between simulated and observed Arctic amplification”). While these 43-year periods overlap, and therefore not fully independent, we consider all these periods together because the internal climate variability is not expected to be in phase in models and observations.
In the CMIP5 simulations, there are only three realizations which simulate equally strong AA as observed between 1979 and 2021, even when the longer time window from 1970 to 2040 is allowed. This means that AA greater than or equal to the observed value of 3.8 occurs with a probability of p = 0.006 across the models (Fig. 6a). For CMIP6, we obtain a probability p = 0.028 for the occurrence of AA ≥ 3.8. If only one realization per model were used in CMIP6, the probability is p = 0.015 (Fig. S8). Thus, the CMIP6 models seem to reproduce the observed AA 43 marginally better than CMIP5 models, consistent with the higher sensitivity of sea ice loss to cumulative CO 2 emissions and global warming in the CMIP6 than in CMIP5 models33. Nevertheless, the likelihood of a fourfold warming in the Arctic in CMIP6 models remains still very small, indicating that the recent Arctic amplification in 1979–2021 is either extremely unlikely or the climate models systematically tend to underestimate AA.
Fig. 6: The probability of observed Arctic amplification in the climate model ensembles. Frequency distributions of all possible 43-year AA ratios between 1970 and 2040 in (a) CMIP5, (b) CMIP6, (c) MPI-GE, and (d) CanESM5 ensemble. The red line denotes the observed 43-year AA ratio, as calculated for 1979–2021. Full size image
The spread of simulated AA in CMIP5 and CMIP6 realizations arises from both internal climate variability and the inter-model spread. To assess the role of internal variability in the AA uncertainty, we next consider the two single-model initial-condition large ensembles (hereafter SMILEs). The individual members of SMILEs are initialized from different initial conditions with identical external forcing; thus the spread in these ensembles is solely due to internal variability51,52. In principle, SMILEs are thus powerful tool to quantify the internal variability of the climate system.
Looking at the spreads of AA 43 in SMILEs, we find that they explain a majority of the total CMIP5 and CMIP6 spread, suggesting that the model uncertainty plays a relatively small role in this comparison (Fig. 6). The observed AA 43 in 1979–2021 (red line) is fully outside the spread of MPI-GE (Fig. 6c), thus giving a probability p ≈ 0.00. This means explicitly that MPI-GE does not capture the observed Arctic amplification as none of its 100 ensemble members can simulate sufficiently strong AA 43 in any 43-year periods between 1970 and 2040.
For CanESM5, AA 43 ≥ 3.8 occurs with a probability of p = 0.054 (Fig. 6d). However, it is known that CanESM5 has a particularly high equilibrium climate sensitivity53, which indicates considerable higher rates of warming both in the Arctic and the globe compared to other models with the same external forcing (Fig. S5 and S9). Thus, while some members of CanESM5 simulate realistic AA 43 , they do so in a modelled climate which is warming much faster than the real world (Fig. S9d). In addition, the behaviour of simulated AA 43 ratios in CanESM5 differ from those in other models: while in CMIP5, CMIP6 and MPI-GE simulations the most extreme AA 43 values tend to occur in the beginning of 21st century, in the CanESM5 simulations AA is generally at its lowest in the beginning of the 21st century and intensifies towards 2040 (Fig. 3d).
A robust statistical test (see Section “Comparison between simulated and observed Arctic amplification” and Supplementary Methods) yields further support for the evidence that climate models as a group underestimate the present Arctic amplification. The test has been tailored to properly take into account the two main sources of uncertainty: the internal climate variability and the model uncertainty. The test returns p values of 0.00 for CMIP5 and 0.027 for CMIP6. When the test is further applied for the two SMILEs, we obtain p values of 0.00 and 0.091 for MPI-GE, and CanESM5, respectively. Thus, we can reject the null hypothesis at the 5 % level for CMIP5, CMIP6 and MPI-GE ensembles. This provides additional evidence that climate models, as a group, are not able to reproduce the observed AA 43 even when properly accounting for the internal variability and the model uncertainty.
Finally, we acknowledge that the p values calculated with the statistical test are dependent on the starting year of the trends. Here we used the 43-year trends calculated over 1979–2021, which showed large discrepancy (and thus low p values) between the observations and model realizations. The longer trends, which should in principle better reflect the externally forced response of the climate system, show a closer agreement (and evidently higher p values) with the climate models (Fig. 4). However, going back in time from 1979 increases the observational uncertainty, and the resulting linear trends do not fully represent the recent warming period in the Arctic due to a non-linear evolution of the temperature (Fig. 1a).