mRNA vaccines induce HIV reactivation ex vivo with minimal T-cell activation
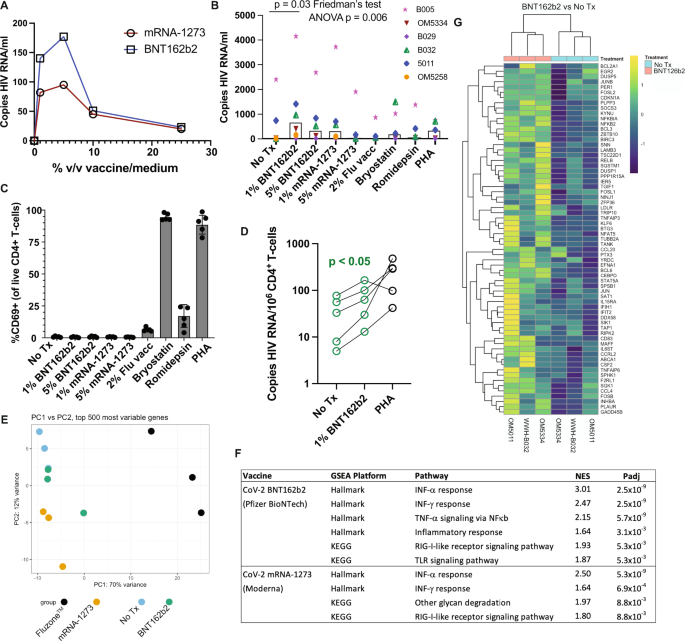
SARS-CoV-2 mRNA vaccination induces transient systemic innate immune responses in vivo, which include the activation of TLR, RIG-I, and other inflammatory signaling pathways, providing potential latency reversal stimuli25,26,27. We therefore first assessed whether the exposure of ex vivo peripheral blood mononuclear cells (PBMCs) or purified CD4+ T-cells from ART-suppressed donors (Supplementary Table 1) would release HIV RNA if exposed to SARS-CoV-2 mRNA vaccines ex vivo. PBMC samples were from SARS-CoV-2 naïve individuals, with most cryopreserved prior to 2020. Cells from an initial participant were used to establish a dose-response curve, which showed peak HIV RNA release after stimulation with either the Pfizer BioNTech BNT162b2 or the Moderna mRNA-1273 vaccines at 1–5% of the culture volume – with the former showing greater induction (Fig. 1A). This approach was extended to 5 additional donors, testing the 1% and 5% doses of both mRNA vaccines, alongside 2% volume/volume of FluzoneTM quadrivalent inactivated-virus influenza vaccine, as well as previously established optimal concentrations of the latency-reversing agents Bryostatin-1 and romidepsin and the mitogen phytohemagglutinin-L (PHA). We observed significant reactivation across this cohort following 1% BNT162b2 treatment (Fig. 1B), with a lesser degree of overall reactivation with 5% BNT162b2 treatment (p < 0.05 by paired t-test) and less consistent reactivation with 1% mRNA-1273 treatment (p = 0.12 by paired t-test). Treatment with influenza vaccine did not induce detectable release of HIV RNA in this ex vivo system.
Fig. 1: The BNT162b2 mRNA vaccine stimulates the RIG-I/TLR – TNF-α – NFκb axis and activates HIV transcription ex vivo. A qPCR measurements of HIV RNA in supernatants, 48 hours following ex vivo treatment of PBMCs from an ART-treated participant with the indicated concentrations of BNT126b2 (Pfizer BioNTech) or mRNA-1273 (Moderna) mRNA vaccines. B Extension of results from A to n = 6 ART-treated participants, adding treatments with 2% volume/volume Fluzone™ influenza vaccine, 25 nM bryostatin-1, 40 nM romidepsin, or 2 μg/ml phytohemagglutinin-L (PHA). P values were calculated by Friedman test with Dunn’s multiple comparison test (two-tailed). C Flow cytometry data from the same samples n = 5 donors harvested for (B) Shown are % CD69+ (activated) following gating on viable CD4+ T-cells. Data are presented as mean values +/− SD. D Cell-associated HIV RNA measures from the same samples as (B) P value of 0.0487 was calculated by a two-tailed paired t test between No Tx and 1% BNT162b2. E–G Bulk mRNA-seq data was generated using a subset of the samples plotted in (WWH-B032, OM5011, and OM5334). B, E Principal component analysis (PCA). The results show that transcriptional profiles of BNT126b2- and mRNA-1273-treated cells are more similar to ‘No treatment’ and to each other than Fluzone™-treated cells. F Gene set enrichment analyses showing pathways activated following mRNA vaccine treatments. Benjamini–Hochberg corrected P-values were calculated with the fgsea packge by a two-sided Weighted Kolmogorov–Smirnov (WGS) test. G Heatmap of 67 genes in the leading edge for the TNFA_SIGNALING_VIA-NFKB pathway, comparing BNT126b2 to No treatment. Source data are provided as a Source Data file. Full size image
Established latency-reversing agents (LRAs) performed relatively poorly in this assay, which we attribute to cell-free RNA being a particularly rigorous measure of latency reversal (ex. romidepsin has previously been shown to induce detectable cell-associated but not cell-free RNA28). Though induction of HIV release was marginal in response to bryostatin-1 and PHA, flow cytometric analysis of CD69 expression confirmed the very high levels of T-cell activation expected with these agents28 (Fig. 1C). Influenza vaccine treatment was also associated with appreciable CD4+ T-cell activation, despite a lack of viral RNA release. Interestingly, neither of the SARS CoV-2 mRNA vaccines induced T-cell activation by this measure (Fig. 1C). SARS CoV-2 vaccines also did not appreciably impact cell viability (Supplementary Fig. 1). Using cell pellets corresponding to the supernatants assessed in Fig. 1B, we further observed that 1% BNT162b2 treatment increased levels of cell-associated HIV RNA (Fig. 1D) – corroborating LRA activity. Thus, in this ex vivo experimental system the SARS CoV-2 mRNA vaccine BNT162b2 induced HIV latency reversal without the T-cell activation typically observed with most potent latency-reversing agents.
To probe the mechanisms underlying mRNA vaccine-induced latency reversal, we purified CD4+ T-cells from three of the samples studied in Fig. 1B, C and subjected these to bulk mRNA sequencing (RNA-Seq) along with corresponding influenza vaccine (FluzoneTM) treated samples. The majority of variance between samples could be attributed to treatment effects, though with the 1% BNT162b2 samples showing relatively little divergence from untreated (No Treatment) samples (Fig. 1E). Correspondingly, treatment with the SARS-CoV-2 mRNA vaccines yielded relatively few numbers of differentially expressed genes (DEGs) compared to untreated samples: 71 DEGs for 1% BNT162b2 and 193 DEGs for Moderna’s mRNA-1273 (adj. p value < 0.05). The FluzoneTM influenza vaccine had a substantially greater impact on the host transcriptional profile, with 3,424 DEGs.
Despite limited overall transcriptional perturbations, gene set enrichment analyses (GSEA) implicated biologically relevant signaling pathways that largely overlapped between the BNT162b2 and mRNA-1273 treatments (Fig. 1F). Retinoic acid-inducible gene I (RIG-I)-like receptors are the primary innate immune receptors of viral RNA which, when stimulated, induce type I interferons (IFN) and pro-inflammatory cytokines29. The results implicated both the pathway itself and the downstream IFN response in these mRNA vaccine treatments. BNT162b2 further implicated toll-like receptor (TLR) signaling. TLR-7 and TLR-8 comprise additional innate immune sensors of foreign ssRNA. They are predominately expressed by myeloid lineage cells, such as monocytes and plasmacytoid dendritic cells (pDCs), where signaling results in the release of type I IFN as well as TNF. TLR-7 agonists, including GS-9620, have been established as HIV LRAs. We have previously shown that these act predominately by driving the release of TNF, which induces NFκb activation and resulting proviral transcriptional initiation in HIV-infected CD4+ T-cells30. The observed activation of TNF signaling via the NFκb pathway implies an analogous mode of action for BNT162b2 (Fig. 1F, G). Of note, these ex vivo transcriptional perturbations are in agreement with those observed in the days following in vivo vaccination with BNT162b2 - where RIG-I like receptor signaling, TLR and inflammatory signaling, and the type I IFN response feature prominently31.
mRNA vaccination drives selective increases in HIV-Nef-specific CD8+ T-cell responses
To assess if HIV reactivation occurred in vivo following first and second vaccine doses, we queried HIV-specific T-cell responses for evidence of antigenic stimulation using activation-induced marker (AIM) assays (assessing co-induction of CD69 and CD137) at baseline (Visit 1, V1) and ∼2 weeks after SARS-CoV-2 mRNA vaccine dose 1 (Visit 2, V2; median, range: 17, 14-24 days) and dose 2 (Visit 3, V3; median, range: 16, 14–24 days) in a cohort of 13 antiretroviral therapy (ART) treated adults with plasma HIV RNA below the limits of detection by a standard clinical assay (Table 1). Timelines for all clinical cohorts in this study are depicted in Fig. 2. As an aside, we first note that direct virologic assessments of HIV expression following initial vaccination would have been valuable – but would require sample timepoints from the days following vaccination, which were not collected. We did collect these early timepoints following mRNA vaccine boosters (third dose), where we observed significant increases in cell-associated HIV RNA (Supplementary Table 2, Supplementary Fig. 2). We did not detect cell-free HIV RNA in the plasma from these timepoints (a higher threshold for latency reversal), using the same assay as in Fig. 1A, B. These results are consistent with a moderate degree of HIV reactivation not leading to appreciable viremia. Returning to T-cell responses following initial vaccine doses, we observed the expected inductions of SARS-CoV-2-Spike-specific CD4+ and CD8+ T-cell responses following vaccine dose 1 (V2), which were further enhanced following dose 2 (V3), from means of CD8 – 0.03% AIM + (V1) to 0.08% AIM + (V2) and 0.11% AIM + (V3); and CD4 − 0.04% AIM + (V1) to 0.07% AIM + (V2) and 0.13% AIM + (Fig. 3A–C). Corresponding with this, SARS-CoV-2 anti-S serology tests showed reactivity in 2/13 individuals at V1, 10/12 at V2, and 13/13 at V3. In contrast, no significant changes were observed in HIV-Gag-specific CD8+ or CD4+ T-cells, HIV-Nef-specific CD4+ T-cell responses, nor cytomegalovirus (CMV)-pp65-specific responses (included as an irrelevant control) (Fig. 3B, C), nor in anti-HIV gp120 antibody levels (Supplementary Fig. 3). However, we did observe trends towards increases in HIV-Nef-specific CD8+ T-cell responses following first vaccine dose, from a mean of 0.06% AIM + (V1) to 0.09% AIM + (V2) – p = 0.06 (Fig. 3B).
Table 1 Study Participant Clinical and Demographic Data Full size table
Fig. 2: Timelines for the three clinical cohorts included in this study. Shown are blood draw dates (V1, V2, and V3) alongside timings of SARS-CoV-2 mRNA vaccinations (Dose 1, Dose 2, and Dose 3). Full size image
Fig. 3: Sustained increases in SARS-CoV-2-specific CD4+ and CD8+ T-cell responses and transient increases in HIV Nef-specific CD8 T-cells following COVID mRNA vaccination. A Representative gating schematic for TCR-dependent activation induced marker (AIM) + populations (CD69+ CD137+) after stimulation with HIV, SARS-CoV-2 or CMV gene products. B, C Combined AIM + CD8+ and CD4+ T-cells results for n = 13 ARV-treated donors at baseline (V1), and ∼2 weeks after vaccine dose 1 (V2) or vaccine dose 2 (V3). CD8 + - B, CD4 + - C Data points represent means of duplicates. All responses are background (DMSO) subtracted, with the exception of the DMSO condition, which is shown as a mean of raw values. P values were calculated by one-tailed Wilcoxon matched-pairs signed rank test, adjusted for multiple comparisons using the Holm method. For the following comparisons where P values are given as <0.1 or <0.01 the exact p values are: SARS-CoV-2 Spike CD8 between V1 and V3 P = 0.0005, SARS-CoV-2 Spike CD4 between V1 and V2 P = 0.0093, between V1 and V3 P = 0.0007. D Results are analogous to panel B, but performed on a confirmatory cohort from Vancouver, Canada. P values were calculated by two-tailed Wilcoxon matched-pairs signed rank test, without multiple testing adjustments. Source data are provided as a Source Data file. Full size image
We took two approaches to further assess this increase in Nef-specific CD8+ T-cell responses following the first vaccine dose, given that it was on the margin of statistical significance: i) We performed these same AIM assays on an independent cohort (n = 15) and ii) We re-assessed T-cell responses in this original cohort by gzm-B ELISPOT, a more selective readout of cells that have recently encountered antigen in vivo16,32,33. Our independent validation cohort was based in Vancouver, Canada, and had samples from baseline (pre-vaccine, V1) and ∼4 weeks after both SARS-CoV-2 mRNA vaccine dose 1 (V2; median 31, range 28–37 days) and dose 2 (V3; median 30, range 27–32) (Table 1 & Fig. 3)34. Due to Canada’s decision to delay second SARS-CoV-2 vaccine doses due to limited initial vaccine supply the time between first and second vaccine doses was significantly longer for the Vancouver (median 54, range 49–61 days) compared to the New York cohort (median 27, range 21–57 days). As such, the V3 results are not directly comparable. For the Vancouver cohort, we observed a significant increase in HIV-Nef-specific CD8+ T-cell responses following the first vaccine dose from a mean of 0.05% AIM + (V1) to 0.09% AIM + (V2) – p = 0.03 (Fig. 3D). No such increases were observed for HIV-Gag or CMV-pp65, while SARS-CoV-2-Spike-specific CD8+ T-cell responses were induced as expected (Fig. 3D). Thus, AIM results from the validation cohort further support our hypothesis by showing unique boosting of HIV-Nef-specific CD8+ T-cell responses following the first dose of SARS-CoV-2 vaccine.
Both effector and memory CD4+ and CD8+ T-cells readily produce IFN-γ in vitro in response to their cognate antigens, evidencing either past or ongoing antigen exposure. Granzyme-B (gzm-B) production following short-term in vitro stimulation, however, is a distinguishing feature of virus-specific effector CD8+ T-cells that have recently encountered antigen in vivo, through either infection or vaccination (with induction from memory CD8+ T-cells requiring >24 h of in vitro stimulation)16,17,18. To further test the hypothesis that SARS-CoV-2 mRNA vaccination can reactivate HIV expression, we assessed gzm-B and IFN-γ responses in parallel by ELISPOT, using peptide pools spanning each of: HIV-Gag, HIV-Env, HIV-Pol, HIV-Nef, HIV-Tat, HIV-Rev, HIV-Vif/Vpr/Vpu (combined pool), CMV-pp65, and SARS-CoV-2-Spike11,35. Amongst the HIV-specific responses, increases were uniquely observed in gzm-B-producing responses to the early gene products Nef and Rev – spiking between V1 (baseline) and V2 (vaccine dose 1) from means of 71 and 50 spot forming units (SFU)/106 PBMC to 220 and 129 SFU/106 PBMCs, respectively (Nef – 3.1-fold increase, p = 0.002, Rev – 2.6-fold increase, p < 0.05) (Fig. 4A, B). No inductions of Nef- or Gag-specific T-cell responses were observed following SARS-CoV-2 mRNA vaccination in a cohort of HIV-negative individuals, ruling out HIV- SARS-CoV-2-Spike cross-reactivity as a driver of these increases (Supplementary Fig. 4A, B). As expected, we observed inductions of SARS-CoV-2-Spike-specific T-cell responses as measured by either gzm-B (means: V1 − 42 SFU/106 PBMCs, V2 − 51 SFU/106 PBMCs, V3 − 71 SFU/106 PBMCs) or IFN-γ (means: V1 – 13 SFU/106 PBMCs, V2 − 47 SFU/106 PBMCs, V3 − 114 SFU/106 PBMCs), and a lack of significant changes in CMV-pp65-specific responses (Fig. 4). Note that the somewhat weak gzm-B character of the SARS-CoV-2 responses is likely attributable to their predominant CD4 component (Fig. 3C). Correlations between HIV-specific T-cell responses as measured by AIM or by ELISPOT are given in Supplementary Fig. 5 and show a strong positive correlation between Nef-specific T-cell responses at V2 as measured by gzm-B ELISPOT versus AIM (CD8) (Spearman’s ρ = 0.93, p < 0.0001). These findings support the hypothesis that the first dose of SARS-CoV-2 mRNA vaccine induces HIV reactivation that is preferentially sensed by early-gene-product specific T-cells, driving an effector functional profile.
Fig. 4: Transient increases in granzyme-B T-cell responses to early HIV-gene products following the first dose of SARS-CoV-2 mRNA vaccination. A, C Representative ELISPOT results measuring granzyme-B (Gzm-B) (A), or IFN-γ (C). Peptide stimulations are plated in duplicates. B, D Combined ELISPOT results ART-treated donors at baseline (V1), and ~2 weeks after vaccine dose 1 (V2) or vaccine dose 2 (V3). Gzm-B – B, IFN-γ – D n = 13 donors for and V3, and n = 12 for V2 (donor 14 did not provide a V2 sample). Data points represents means of duplicates, following background (DMSO) subtraction. P values were calculated by one-tailed Wilcoxon matched-pairs signed rank test, adjusted for multiple comparisons using the Holm method. The exact P value for Gzm-B Rev between V1 and V2 is 0.02. Source data are provided as a Source Data file. Full size image
Although only Nef, and to a lesser extent Rev, specific T-cell responses showed significant changes across the cohort by gzm-B ELISPOT, we did observe some fluctuations in other responses in individual donors. For example, PIDs 9 and 15 showed modest increases in CMV-pp65 responses between V1 and V2. This may have been attributable to bystander activation following SARS-CoV-2 mRNA vaccination or to natural dynamics in responses. Since we are not aware of any study that has monitored variation in gzm-B-specific responses over ∼2 week intervals, we assessed this by collecting samples from a cohort of PWH that did not receive a vaccine and measured responses at similar intervals to our vaccine cohorts (V1 – V2 = 21, 16-25 days and V2 – V3 = 18, 13–25 days) (Supplementary Table 3). Gzm-B-producing CMV-pp65-specific responses also exhibited considerable dynamics in this control cohort with one individual showing an increase of 1,153 SFU/106 PBMCs and another showing a decrease of 742 SFU/106 PBMCs between V1 and V3 (Supplementary Fig. 6). We conclude that the sporadic changes in gzm-B-producing CMV-pp65-specific in our vaccine cohort cannot be attributed to the vaccine. Future studies may ask whether gzm-B-producing CMV-pp65-specific response dynamics reflect CMV reactivation events. Levels of CD69 expression on total CD4+ T-cells also did not change across study visits (Supplementary Fig. 7), indicating a lack of substantial bystander activation. Together, these data confirm that – while numerous events may cause fluctuation in gzm-B-producing responses – increases in HIV early gene product responses are unique in being attributable to SARS-CoV-2 mRNA vaccination, as evidenced by consistent and significant increases across the cohort (Nef > Rev).
HIV RNA decreases in association with post-vaccine Nef-specific T-cell responses
The in vivo sensing of reactivated HIV by gzm-B-releasing Nef and/or Rev-specific T-cells may result in the elimination of some HIV-infected cells, specifically those that were poised for vaccine-induced reactivation. This could also explain the lack of a clear boosting effect on Nef/Rev-specific T-cell responses following second vaccine doses (Figs. 3 and 4). Alternatively, activated HIV-specific CD8+ T-cell responses may suppress HIV transcription, through incompletely understood mechanisms36. To approach the potential impact of T-cell engagement on HIV-infected cells, we first measured changes in residual cell-associated HIV RNA from baseline, following each vaccination. Levels of polyadenylated HIV RNA decreased significantly over the course of the study (V1 to V3) as measured by two different sets of primers and probes, targeting either the 5’ or 3’ region of the HIV genome. The target of the 5’ primers/probes is only present in unspliced HIV RNA, whereas that of the 3’ primers/probes is present in all splicing isoforms (Fig. 5A). 5’ HIV RNA decreased from a mean of 2027 copies/106 CD4 cells at V1 to 1257 copies/106 CD4 cells at V3 (1.6-fold decrease p = 0.03); 3’ HIV RNA decreased from a mean of 541 copies/106 CD4 cells at V1 to 351 copies/106 CD4 cells at V3 (1.5-fold decrease p < 0.05) (Fig. 5B).
Fig. 5: Cell-associated HIV RNA decreased across SARS-CoV-2 mRNA vaccination, in inversely correlating with Gzm-B T-cell responses to early gene products. A Positions of RT-qPCR primer/probes. The 3’ primer/probes target all unspliced and spliced isoforms of HIV poly(A) RNA, whereas the 5’ primer/probes only target unspliced. B Cell-associated HIV RNA for n = 13 ART-treated donors at baseline (V1), and ∼2 weeks after vaccine dose 1 (V2) or vaccine dose 2 (V3). P values were calculated by one-tailed Wilcoxon matched-pairs signed rank tests, comparing V1 to V3, without adjustments for multiple testing. C, D Depiction of Spearman correlations between proportional changes (V3/V1) in HIV RNA and magnitudes of indicated T-cell responses measured at indicated visits by ELISPOT (C) or AIM assay (D). Circle sizes are proportional to P values, and color to Spearman’s R, as indicated in the scales shown. Analyses are for the n = 12 individuals who completed all 3 visits (donor 14 missed V2). The rings around each circle indicate the threshold P value of 0.05. Yellow asterisks indicate correlations that were significant following correction post hoc for multiple comparisons by the false discovery rate method of Benjamini and Hochberg using the SAS MULTTEST procedure (FDR option) (see also Supplementary Tables 4 and 5). E Plots of the most significant correlations from C (left panel) and D (right panel). Source data are provided as a Source Data file. Full size image
Interestingly, for 3’ HIV RNA, these changes showed a strong inverse correlation with Nef-specific gzm-B-producing T-cell responses at V2 (r = −0.73, p = 0.006), and trends towards inverse correlations with Nef- or Rev-specific gzm-B-producing T-cell responses at V3 (Fig. 5C and E, Supplementary Table 4). Changes in 5’ HIV RNA showed evidence of a similar pattern, with the relationship with Nef-specific gzm-B-producing responses at V2 near the threshold of significance. This fits with the expected observations of killing of cells transcribing HIV RNA by Nef-specific gzm-B-producing T-cells given that only the 3’ primer/probes directly detect Nef-encoding spliced transcripts, whereas the 5’ primer/probes would also detect transcripts from cells where unspliced HIV RNA predominates. No correlations were observed between gzm-B-specific responses to late gene products (Gag, Pol, or Env) nor IFN-γ-producing responses to any gene product, and either HIV RNA measure (Fig. 5C, Supplementary Table 4). AIM assay results showed agreement with the gzm-B ELISPOT results, with Nef-specific CD8+ (r = −0.76, p = 0.006) and – to a lesser extent – CD4+ T-cell responses (r = 0.66, p = 0.02) correlating inversely with changes in 3’ HIV mRNA (Fig. 5D, E, Supplementary Table 5). Thus, each of the HIV-specific T-cell responses shown to be significantly increased following SARS-CoV-2 vaccine dose 1 (Figs. 3 and 4), were in turn correlated with reductions in HIV RNA. This supports a model whereby the induced T-cell responses either suppressed viral transcription36, and/or eliminated some of the transcriptionally competent HIV-infected cells, with the demonstrated cytotoxic functionality (gzm-B) perhaps suggesting the latter37. Although we have limited ability to draw kinetic inferences from our data, we propose that the associations between T-cell responses at V2 with changes in HIV RNA that manifest at V3 reflect the time it takes for these responses to expand and exert antiviral activity.
No measurable changes in HIV reservoir size following vaccinations
Measurable reductions in the frequencies of cells harboring HIV DNA would comprise more direct evidence that some infected cells had been selectively eliminated, but existing assays have important limitations. Total levels of HIV DNA provide a poor representation of the ‘HIV reservoir’ (defined as infected cells with the potential to reseed viremia), due to the fact that the large majority of integrated viral genomes are defective (e.g. large deletions)38. A recently developed duplex digital-droplet PCR (ddPCR) assay termed the intact proviral DNA assay (IPDA) substantially improves upon this and provides a reasonable upper estimate of genomically intact proviruses39. However, a further complexity is that the vast majority of these proviruses do not reactivate to produce infectious virus even after maximal in vitro stimulation39, and some may be limited by chromosomal context from ever reactivating40,41,42. In applying the IPDA to quantify intact proviruses, as well as the defective proviruses that yielded only packaging signal (Ψ) or rev response element (RRE) amplification, we observed a lack of significant changes in any measure across the three visits for the 11 participants that produced valid results (Fig. 6A–C) (2 individuals showed characteristic detection failures likely attributable to HIV sequence diversity in the primer or probe binding sites43).
Fig. 6: No consistent changes in HIV reservoir measures following COVID vaccinations. A–C Copies of the indicated HIV DNA species for ARV-treated donors at baseline (V1), and ~2 weeks after vaccine dose 1 (V2) or vaccine dose 2 (V3). P values were calculated by one-tailed Wilcoxon matched pairs signed rank test comparing V1 with V3. n = 13 at V1 and V3 and n = 12 at V2 (PID 14 missed V2). D Tat/rev induced limiting dilution assay results for the n = 4 study participants tested. Source data are provided as a Source Data file. Full size image
We selected four individuals on the bases of clear inductions of Nef-specific gzm-B releasing responses (Fig. 4) and of sample availability, to measure the HIV reservoir using an alternative method – the Tat/rev Induced Limiting Dilution Assay (TILDA)44. This assay quantifies the frequencies of cells that can be induced by PMA/ionomycin to express tat or rev transcripts. Samples from two study participants (PIDs 9 and 17) showed inducible cells trending higher across visits, while this measure was unchanged in PID 15, and undetectable in PID 7. Although overall interpretation is limited by the small ‘n’ available for this assay, it is notable that PID 9 had the greatest magnitude increase in Nef-specific gzm-B responses in this study (Fig. 4), as well as one of the more marked drops in cell-associated HIV RNA in Fig. 5. Thus, these results suggest that – despite evidence for CD8+ T-cell engagement – reductions in cells that could be induced by PMA/ionomycin to produce transcripts were not achieved following SARS-CoV-2 mRNA vaccination.