Data preparation overview
The data used in our analyses are based on a census of the US academic market obtained under a data use agreement with AARC. That unprocessed dataset consisted of the employment records of all tenured or tenure-track faculty at all 392 doctoral-degree-granting universities in the United States for each year between 2011 and 2020, as well as records of those faculty members’ most advanced degree. We cleaned, annotated and preprocessed that unprocessed dataset to ensure consistency and robustness of our measurements, resulting in the data used in our analyses.
Cleaning the original dataset involved nine steps, which were performed sequentially. After cleaning, we augmented the processed dataset with two pieces of extra information to enable further analyses of faculty and universities, by annotating the country of each university and the gender of each professor. The nine preparation steps and two annotation steps are described below.
Data preparation steps
The first step in preparing the dataset was to de-duplicate degree-granting universities. These universities are in our data either because they were 'employing' universities covered by the AARC sample frame (all tenure-track faculty of US PhD-granting universities) or because they were 'producing' universities at which one or more faculty members in the AARC sample frame obtained their terminal degree (university, degree, year). Producing universities include those based outside the United States and those that do not grant PhDs. Thus, due to the AARC sample frame, all employing universities are US-based and PhD granting, and this set of 392 universities did not require preprocessing. On the other hand, producing universities—those where one or more employed faculty earned a degree—may or may not be PhD granting and may or may not be located in the United States.
Producing universities were cleaned by hand: instances in which single universities were represented in multiple ways ('University of Oxford' and 'Keble College', for example) were de-duplicated and, in the rare instances in which a degree referenced an unidentifiable university ('Medical University, England', for example), the degrees associated with that 'university' were removed but the individuals holding those degrees were not removed.
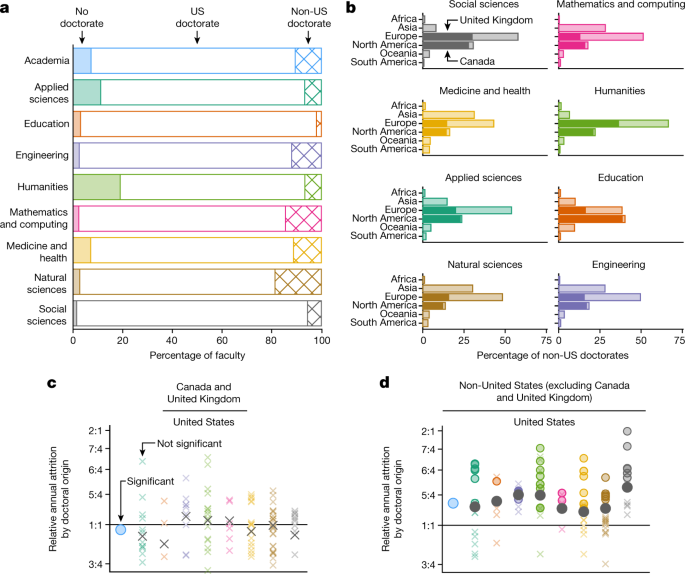
The second step in preparing the dataset was to clean faculty members' degrees. Terminal degrees are recorded for 98.2% of faculty in the unprocessed data: 5.7% of these degrees are not doctorates (5.3% are Master’s degrees and 0.4% are Bachelor’s degrees). We treated all doctoral degrees as equivalent—for example, we drew no distinction between a PhD and a D.Phil. We note that faculty without doctorates are distributed unevenly throughout academia, with members in the Humanities and Applied Sciences being least likely to have a doctoral degree (Extended Data Fig. 1).
Faculty without doctorates were included in analyses of gender. They were also included in the denominators of self-hiring rate calculations but, possessing no doctorates, they were never considered as potentially self-hires, themselves. Faculty without a doctorate were not included in analyses of production and prestige, which were restricted to faculty with doctorates.
The third step in preparing the dataset was to identify and de-duplicate departments. We ensured that no department was represented multiple different ways, by collapsing records due to (1) multiple representations of the same name (for example, 'Computer Science Department' versus 'Department of Computer Science') and (2) departmental renaming (for example, 'USC School of Engineering' versus 'USC Viterbi School of Engineering'). Although rare instances of the dissolution or creation of departments were observed, we restricted analyses that did not consider time to those departments for which data were available for a majority of years between 2011 and 2020, and restricted longitudinal analyses to only those departments for which data were available for all years.
The fourth step in preparing the dataset was to annotate each department according to a two-level taxonomy based on the field (fine scale) and domain (coarse scale) of its focus. This taxonomy allowed us to analyse faculty hiring at both levels, and to compare patterns between levels. Extended Data Table 1 contains a complete list of fields and domains.
Most departments received just one annotation, but some received multiple annotations due to their interdisciplinarity. This choice was intentional, because the composition of faculty in a 'Department of Physics and Astronomy' is relevant to questions focused on the composition of both ('Physics, Natural Sciences') and ('Astronomy, Natural Sciences'). On the basis of this premise, we include both (or all) appropriate annotations for departments. For instance, the above hypothetical department and its faculty would be included in both Physics and Astronomy analyses. The basic unit of data in our analyses is therefore the individual–discipline pair. A focus on the individual would be preferable, but would require taxonomy annotations of individuals rather than departments—information we do not have. Furthermore, many individuals are likely to consider themselves to be members of multiple disciplines.
Whenever a university had multiple departments within the same field, those departments were considered as one unit. To illustrate how this was done, consider the seven departments of Carnegie Mellon’s School of Computer Science. All seven departments were annotated as Computer Science and treated together in analyses of Computer Science.
Some fields have the potential to conceptually belong to multiple domains. For example, Computer Engineering could be reasonably included in the domain of either Formal Sciences (which includes Computer Science) or Engineering (which includes Electrical Engineering). Similarly, Educational Psychology could be reasonably included in the domain of Education or of Social Sciences. In these instances, we associated each such field with the domain that maximized the fraction of faculty whose doctoral university had a department in that domain. In other words, we matched fields with domains using the heuristic that fields are best associated with the domains in which their faculty are most likely to have been trained.
The fifth step in preparing the dataset was to remove inconsistent employment records. Rarely, faculty in the dataset seem to be employed at multiple universities in the same year. These cases represent situations in which a professor made a mid-career move and the university from which they moved failed to remove that professor from their public-facing records. We removed such spurious and residual records for only the conflicting years, and left the records of employment preceding such mid-career moves unaltered. This removed only 0.23% of employment records.
The sixth step in preparing the dataset was to impute missing employment records. Rarely, faculty disappear from the dataset only to later reappear in the department they left. We considered these to be spurious 'departures', and imputed employment records for the missing years using the rank held by the faculty before becoming absent from the data. Employment records were not imputed if they were associated with a department that did not have any employment records in the given year. Imputations affected 1.3% of employment records and 4.7% of faculty.
The seventh step in preparing the dataset was to exclude non-primary appointments such as professors’ associations or courtesy/emeritus appointments with multiple departments. We identified primary appointments by making the following two assumptions. First, if a professor was observed to have just one appointment in a particular year, then that was their primary appointment for that year—as well as for any other year in which they held that appointment (including years with multiple observed appointments). This corresponds to a heuristic that faculty should appear on the roster of their primary unit before appearing on non-primary rosters. Second, if a professor was observed to have appointments in multiple units, and a promotion (for example, from Assistant Professor to Associate Professor) was observed in one unit’s roster but not in another’s, it was assumed that the non-updating unit is not a primary appointment. This corresponds to a heuristic that, if units vary in when they report promotions, it is more likely that the primary unit is updated first and thus units that update more slowly are non-primary.
Primary appointments could not be identified for 1.2% of faculty, and 5.5% of appointments were classified as non-primary. Field- and domain-level analyses were restricted to primary appointments, but analyses of academia included faculty regardless of whether their primary appointment(s) could be identified, under the assumption that employment in a tenure-track position implies having some primary appointment, identifiable or not.
The eighth step in preparing the dataset was to carefully handle employment records with mid-career moves so that each faculty member was associated with only a single employing university. Mid-career moves do not alter a professor’s doctoral university or gender, and so cannot affect measurements such as a discipline’s faculty production Gini coefficient, its gender composition or the fraction of faculty within the discipline that holds a degree from outside the United States. However, mid-career moves have the potential to alter a discipline’s self-hire rate and the steepness of its prestige hierarchy. This raises important questions for how one should treat mid-career moves when performing calculations that average over our decade of observations—should one analyse the appointment before or the appointment after the move(s)?
First we chose to use, whenever possible, the most recent employing university of each professor. In other words, if a professor was employed at multiple universities between 2011 and 2020, only that university where they were most recently employed was considered. Second, we checked that this choice did not meaningfully affect our analyses of self-hiring or prestige, because 6.9% of faculty made a mid-career move within our sample frame. To evaluate the impact of this choice on self-hiring analyses, we first calculated self-hiring rates on the basis of faculty members’ first employing university (that is, their pre-mid-career-move university if they had a mid-career move). We then calculated self-hiring rates on the basis of faculty members’ last employing university (that is, their post-mid-career-move university if they had a mid-career move). Comparing these two estimates we found that, across all 107 fields, eight domains and academia, mid-career moves had no significant effect on our measurements of self-hiring rates (two-sided z-test for proportions, α = 0.05, n = 295,089 faculty in both samples). To evaluate the impact of this choice on prestige hierarchies, we first calculated the upward mobility in rank-sorted faculty hiring networks on the basis of faculty members’ first employing university (that is, their pre-mid-career move university if they had a mid-career move). We then followed the same procedure but on the basis of faculty members’ last employing university (that is, their post-mid-career move university if they had a mid-career move). Comparing these two approaches, we found that mid-career moves did not significantly alter upward mobility in any field or domain (two-sample, two-sided z-test for proportions, Benjamini–Hochberg-corrected α = 0.05; see Extended Data Table 1 for n). At the academia level, taking the most recent university rather than the first university among mid-career moves resulted in 0.7% more upwardly mobile doctorate-to-faculty transitions (two-sample, two-sided z-test for proportions, Benjamini–Hochberg-corrected P < 0.05, n = 238,281 in both samples).
The ninth and final step in preparing the dataset was to exclude departments that were inconsistently sampled. Not all departments in the unprocessed dataset were recorded by the AARC in all years, for reasons outside the control of the research team. To ensure robustness of results, we restricted our analyses that did not consider time to those departments that appeared in a majority of years between 2011 and 2020. This resulted in the removal of 1.8% of employment records, 3.4% of faculty and 9.1% of departments. Additionally, 24 employing universities (6.1%) were excluded by this criterion, most of which were seminaries.
Annotations
The country of each producing university was determined by hand. First, Amazon Mechanical Turk was used to gather initial annotations. Each university was annotated by two different annotators. Inter-annotator agreement was >99% and disagreements were readily resolved by hand. To ensure no errors, a second pass was completed by the researchers and resulted in no alterations.
Self-identified gender annotations were provided for 6% of faculty in the unprocessed dataset. To annotate the remaining faculty with gender estimates, we used a two-step process based on first and last names. First, complete names were passed to two offline dictionaries: a hand-annotated list of faculty employed at Business, Computer Science and History departments (corresponding to the data used in ref. 27) and the open-source python package gender-guesser58. Both dictionaries responded with one of the following classifications: female, male or unable to classify. Second, for cases in which the dictionaries either disagreed or agreed but were unable to assign a gender to the name, we queried Ethnea59 and used the gender to which they assigned the name (if any). Using this approach we were able to annotate 85% of faculty with man or woman labels. Faculty whose names could not be associated with a gender were excluded from analyses of gender but included in other analyses. This methodology associates names with binary (man/woman) labels because of technical limitations inherent in name-based gendering methodologies, but we recognize that gender is non-binary. The use of these binary gender labels is not intended to reinforce a gender binary.
Per-analysis inclusion criteria
The prepared and annotated dataset contained 295,089 individuals employed at 368 universities, and was used as the basis of all of our analyses. In some analyses, further inclusion criteria were applied but with the guiding principle that analyses should be as inclusive as possible and reasonable. For example, analyses of the professoriate by gender considered only faculty with a gender annotation but did not require members to hold a doctorate. Analyses of prestige, on the other hand, considered only those faculty with doctorates from US universities but did not require that faculty have a gender annotation. The aim of these inclusion criteria was to ensure the robustness of results while simultaneously being maximally inclusive. When an analysis fell into more than one of the above categories, inclusion criteria for all categories were applied. For example, when analysing changes in US faculty production over time, inclusion criteria for analyses of both US faculty production and over time were applied.
Some fields and domains were excluded from field- or domain-level analyses, either because they were too small or because they were insufficiently self-contained. Faculty in excluded fields were nevertheless included in domain- and academia-level analyses, and those in excluded domains were nevertheless included in academia-level analyses (Extended Data Table 2).
Two domains were excluded from domain-level analysis: (1) Public Administration and Policy and (2) Journalism, Media and Communications. These domains were excluded because they employed far fewer faculty than other domains, and because their inclusion made domain-level comparisons difficult.
Fields were included in field-level analyses only if (1) at least 25% of universities had a department in that field or (2) the number of faculty with a primary appointment in that field, and who also earned their doctorate from a university that had a department in that field, was ≥500. These requirements were intended to ensure the coherence of fields for analyses of production and prestige. For information on the number of faculty excluded from field- and domain-level analyses, see Extended Data Table 2.
Analyses of production and prestige included only faculty who hold a US doctorate. Faculty without a doctorate are a small minority of the population in most fields, and were excluded because their degrees are not directly comparable to doctorates. Faculty with non-US doctorates were excluded because the universities that produced them are outside the sample frame.
For all longitudinal analyses, we required departments to be sampled in all years between 2011 and 2020 to ensure consistency in the sample frame. This resulted in the removal of 5.9% of employment records, 7.2% of faculty and 12.6% of departments for those analyses. Additionally, 15 employing universities (4.1%) were excluded by this criterion.
Identification of new hires
Some analyses required us to divide faculty into two complementary sets: new hires and existing faculty. For analyses that aggregated faculty over our decade of observation, we labelled faculty as new hires if they met one of two criteria. First, any professor not present in the dataset in 2011 and who later appeared was considered to be a new hire; this criterion was applied only for departments whose existence predated the appearance of the new professor. Second, faculty who earned their degree within 4 years of their first recorded employment were also considered to be new faculty. Thus defined there are 59,007 new faculty, making up 20.0% of the faculty in the dataset. The new faculty label was applied to qualifying faculty regardless of which criterion they met or in which observed year they met it. Our longitudinal analyses were more strict, such that faculty were labelled as new only in their first observed year of employment, but were considered as existing faculty for each observed year thereafter.
Identification of attrition and calculation of attrition risk
A professor who leaves academia for any reason constitutes an attrition, including retirement, termination of employment for any reason, acceptance of a position outside our sample frame (for example, in industry, government or a university outside the United States) or death. Our unprocessed data do not allow us to identify reasons for attrition. A professor’s last year of employment is considered the year of their attrition when counting attritions over time. Faculty who change disciplines are not considered to be attritions from disciplines they leave. Because attritions in a given year are identified through comparison with employment records in the next, attrition analyses do not include the final year of the sample frame (2020). Faculty were counted as an attrition at most once; a professor who appeared to leave multiple times was considered an attrition only on exiting for the last time.
Attrition risk is defined, for a given set of faculty in a given year, as the probability that each professor in that set failed to appear in the set in the next year—that is, the proportion of observed leaving events among possible leaving events on an annual basis. Thus, all attrition risks as stated in this study are annual per-capita risks of attrition. Average annual attrition risks were formed by counting all attrition events and dividing by the total person-years at risk.
Faculty hiring networks
Faculty hiring networks represent the directed flows of faculty from their doctoral universities to their employing universities. As such, each node in such a network represents a university and each weighted, directed edge represents the number of professors trained at one university and who are employed at the other. For the purposes of the faculty hiring networks analysed here, we restrict the set of nodes to, at most, those employing universities within the AARC sample frame. This means that nodes representing non-US universities are not included, and therefore the edges that would link them to in-sample universities are also not included. Without loss of generality, we now describe in more precise detail the creation of a particular field’s faculty hiring network, but this process applies equivalently for both domains and academia as a whole.
First, universities were included in a field only if they had a unit (for example, a department, or departments) associated with that field. As a result, a university appears in the rankings for a field only if it has a representative unit; without a Department of Botany, a university cannot be ranked in Botany. Second, ranks are identifiable from patterns in faculty hiring only if every unit employs at least one individual in that field who was trained at a unit that also employs faculty in that field. Phrased from the perspective of the faculty hiring network, this requirement amounts to ensuring that the in-degree of every node is at least one. Because the removal of one unit (based on the above requirements) might cause another to fail to meet the requirements, we applied this rule repeatedly until it was satisfied by all units.
The outcome of this network construction process is a weighted, directed multi-graph A(k) such that: (1) the set of nodes i = 1,2,... represent universities with a department or unit in field k. (2) The set of edges represent hiring relationships, such that \({A}_{ij}^{(k)}\) is an integer count of the number of faculty in field k who graduated from i and are employed at j. Thus A(k) is a positive, integer-weighted, non-symmetric, network adjacency matrix for field k. (3) The out-degree \({d}_{i}^{(k)}={\sum }_{j}{A}_{ij}^{(k)}\) is greater than or equal to one for every node i, meaning that every university has placed at least one graduate in field k. (4) The in-degree \({d}_{j}^{(k)}={\sum }_{i}{A}_{ij}^{(k)}\) is greater than or equal to one for every node j, meaning that every university has hired at least one graduate from field k.
To infer ranks in faculty hiring networks meeting the criteria above, we used the SpringRank algorithm48 without regularization, producing a scalar embedding of each network’s nodes. Node that embeddings were converted to ordinal rank percentiles. (In principle, embeddings may produce ties requiring a rule for tie-breaking when converting to ordinal ranks. However, no ties in SpringRanks were observed in practice).
To determine whether properties of an empirically observed hierarchy in a faculty hiring network could be ascribed to its in-degree sequence (unit sizes) and out-degree sequence (faculty production counts) alone, we generated an ensemble of n = 1,000 networks with identical in- and out-degrees that were otherwise entirely random, using a degree-preserving null model called the configuration model46,60. We excluded self-hires (that is, self-loops) from randomization in the configuration model for a subtle but methodologically important reason. We observed that self-hires occur at much higher rates in empirical networks than expected under a configuration model. As a result, were we to treat self-hires as links to be randomized, the process of randomization would, itself, increase the number of inter-university hires from which ranks were inferred. Because of the fact that SpringRank (or an alternative algorithm) infers ranks from inter-university hires, but not self-hires, the act of 'randomizing away' self-hires would thus distort ranks, as well as the number of potential edges aligned with (or aligned against) any inferred hierarchy. In short, randomization of self-hires would, in and of itself, distort the null distribution against which we hope to compare, dashing any hope of valid inferences to be drawn from the exercise. We note, with care, that when computing the fraction of hires violating the direction of the hierarchy, either empirically or in the null model, we nevertheless included self-hires in the total number of hires—that is, the denominator of said fraction. These methodological choices follow the considerations of the configuration model 'graph spaces' introduced by Fosdick et al.46.
Reporting summary
Further information on research design is available in the Nature Research Reporting Summary linked to this article.