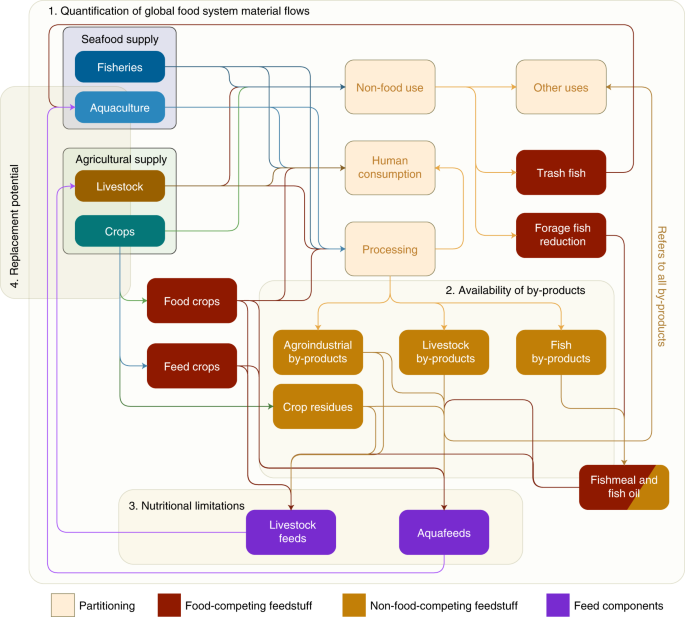
The material flows of feed use and the production of by-products and residues in the global food system were mapped to understand the links and dependencies between the three subsectors of crop, livestock and aquaculture production. The analysis consisted of four main steps (Fig. 1). First, we quantified the global food system flows, including the national levels of feed use in both the livestock and aquaculture sectors and the potential production of by-products. Second, the regional availability of by-products and residues was analysed by subtracting the quantities used as feed from the potential production. Third, using existing literature on feed experiments, we considered how much of the food-competing feedstuff can be replaced with food system by-products, considering the nutritional requirements of the production animals as well as regulations. Fourth, the replacement potential was analysed, combining the regional availability of the by-products and residues with the nutritional requirements. Finally, the potential increase in the global food supply was calculated, assuming that all feedstuffs freed by this replacement were redirected to human consumption. The analysis was performed for a three-year average of 2016–2018.
Here the focus was on replacing human-edible feed use, including cereals, oilseed oils, pulses, sugar crops and whole fish used in producing fish oil and fishmeal, with by-products and residues. Although some of the feedstuffs in these categories are produced with varieties classified as not suitable for human food (for example, fodder maize), and not all of them meet the quality criteria for food use, we allocated them to the food-competing feedstuff category since they are produced on arable land that can instead be used for the production of varieties suitable for human consumption. Also, other forage feeds (for example, alfalfa or grass hay) may compete with food production when produced on arable land, but unlike fodder maize, they are less demanding and are often produced in marginal lands60,61; therefore, they were not treated as food-competing feedstuff in this study. All feed use of oilseeds was converted into meals/cakes and oils. While some unprocessed oilseeds (for example, soybeans) are consumed by humans, here only the oil fraction was considered human edible. The economic importance of different oilseed meals varies greatly, and especially with soybean, the meal fraction constitutes a major part of the production value. Here we still aggregate all oilseed meals as by-products from the food system perspective, as they are fractions of food crops but require the animal sector to return to the human food supply. Roughages, crop residues and crop processing by-products (such as oilseed meals and cereal bran) were not considered food-competing (Supplementary Table 4). Although some of them (for example, brans) can also be used as food, they are considered co-products of primary food commodities (for example, flour); therefore, they were not considered to be in direct competition with food use.
Feed use material flows
For the total feed use in livestock production, we first multiplied the yearly national cattle (meat and dairy), poultry (meat and eggs) and pork (meat) production from the statistics from the Food and Agriculture Organization of the United Nations (FAO)2 by the ratios of different production systems from FAO GLEAM21. The production numbers were multiplied by the regional feed conversion ratios (FCRs) (kg dry matter feed per kg output), combining the FCRs from three global studies: Mekonnen and Hoekstra62 (all commodities), Mottet et al.1 (all commodities) and Herrero et al.23 (only for cattle). The FCR values reported as dry matter feed use per protein content were converted into dry matter feed use per product by applying data on protein content of the different end products from ref. 63. These sources, although being the most up-to-date ones covering all world regions, are limited and include uncertainties (for example, due to the lack of data). In this study, the FCRs for the years 2000 (refs. 23,62) and 2010 (ref. 1) were applied. It is very likely that the FCRs have improved since, with more efficient production systems. At the same time, the development of livestock FCRs in the past decade has been rather minor; for example, the FCRs for finishing pigs in the European Union improved by only 1% between 2013 and 2019 (refs. 64,65). Nevertheless, updated and more precise FCRs, particularly for low-income countries—where the development might be faster and collecting data can be challenging—could yield somewhat different results. There is therefore a need for studies that work with the uncertainties related to the data applied and address potential changes in feed use material flows owing to production systems’ development. The country- and species-specific feed use was multiplied by the ratio of different feedstuffs from ref. 21. These feed use data are presented for different production systems for ten world regions, including the feed use of both non-food-competing feedstuff (such as roughages and by-products) and the feed use of food-competing feedstuff (such as cereals and other food crops) for the different livestock species. This procedure resulted in higher estimates of total fishmeal use in poultry and pig production compared with the official data reported in ref. 66 and was thus corrected by applying the fishmeal inclusion rates for pig and poultry from ref. 26. In addition, the aggregated feed use category of grains in ruminant feed was divided into individual commodities (maize, wheat and barley) on the basis of global feed use ratios of these materials.
For the total feed use in aquaculture, for both commercial and farm-made feeds, we multiplied the production of each fed aquaculture production group (carps, tilapias, catfishes, other freshwater fishes, salmons, trouts, milkfish, eels, other marine fishes, shrimps and other freshwater crustaceans) by their respective FCRs. The FCRs for commercial feeds were derived from ref. 25, and the FCRs for farm-made feeds were assumed to be 50% higher than those for commercial ones on the basis of ref. 67. Diet compositions for the major fed aquaculture groups were taken from country-specific survey data from ref. 31 and extrapolated to country-level diets according to ref. 32. The diet composition data were provided in ranges of inclusion for each ingredient (minimum, maximum and average), and to estimate a diet composition that sums to 100%, the proportion of each ingredient for the average diet composition was used to scale the diet to it, as explained in more detail in the Supplementary Information. The amounts of fishmeal and fish oil produced from by-products of fish processing were estimated to be 25–35% of the total quantities produced3.
The livestock and aquaculture feed data were combined, the different feed categories were unified and the totals were validated and harmonized with the estimates of global feed use from FAO Supply and Utilization Accounts2 for the years 2016–2018 for the feed groups for which the data were available (cereals, pulses, vegetable oils and molasses). Comparisons between our feed use estimates and published data are available in the Supplementary Information.
Availability of by-products and residues
To estimate the availability of food system by-products and residues, we first estimated their global production and subtracted current feed use from the totals. We then assigned the available by-products to countries on the basis of their share of global production of each feedstuff. Four categories of food system by-products were considered: (1) crop residues; (2) cereal, sugar, citrus fruit and oilseed processing by-products; (3) livestock by-products; and (4) fish by-products processed into fishmeal and fish oil. The focus was on the by-products of primary crop and animal production and crop processing by-products already used as feed in important quantities at the global scale; therefore, food waste from retail or consumption, for example, was not considered here.
To estimate the potential availability of crop residues, the yearly crop production2 was multiplied by crop-specific residues-to-production ratios from ref. 68 and S. Wirsenius et al. (manuscript in preparation). Here we considered only crop residues from cereals, rice, sugar cane and pulses that are most used as feedstuff17,69. Crop residues left on fields have an important impact on soil fertilization and moisture retention28. We therefore accounted for the crop residues that will be left on fields by multiplying the crop production by the ratios of maximum sustainable harvest, ranging from 0% to 50% (refs. 28,70).
Crop processing by-products are the co-products that result from a multifunctional process that is driven by the demand of the main product. The by-products considered in this study included cereal bran, distiller’s grains from biofuel and brewing industries, sugar beet pulp, sugarcane and sugar beet molasses, citrus pulp, and oilseed meals. The average quantities of cereal bran and molasses produced between 2016 and 2018 were adopted from FAO Supply and Utilization Accounts2. The amounts of distiller’s grains from corn ethanol production were applied from ref. 71 for the four highest-production countries, covering 97% of the global corn ethanol production. Brewer’s grains from beer brewing were estimated assuming that 21–22 kg of spent grains are produced per hectolitre of brewed beer72 and multiplying the country-level barley beer production2 by this conversion factor. The amounts of sugar beet pulp and oilseed meals were calculated from the average amounts of sugar beet and oilseeds processed between 2016 and 2018 (ref. 2) and multiplied by the conversion factors73 reducing the amounts of waste created in the processing stage74. The production of citrus pulp was estimated by multiplying the amounts of citrus fruits (lemons and limes, oranges, tangerines, mandarins, clementines and satsumas) processed21 by the conversion factor73 and subtracting waste and losses from processing74.
To estimate the potential availability of livestock by-products, we first converted the production quantities of end products (cattle, pig and poultry meat)2 to live weight using dressing percentages21 and then multiplied those by the ratios of the processed by-products (poultry by-product meal, poultry oil, blood meal, hydrolysed feather meal, meat meal from pork meat production and poultry oil)33. To estimate the poultry by-products from egg production, the amounts of slaughtered hen were calculated. This was estimated by dividing the numbers of laying hens2 by the average age at slaughtering and multiplying by their average weight at the end of the laying period21. Here the meat from laying hens was not assumed to be consumed by humans.
To estimate the availability of by-products from fish production, we first gathered the aquaculture production and capture fisheries data from FishStatJ30. The fisheries production was multiplied by the average ratios of human consumption and non-food use from refs. 75,76, which presented the average ratios for developed and developing countries separately. The data were corrected for certain captured fish species for which the literature indicates a higher ratio going to non-food use77,78. The amounts of fish destined for non-food uses were then multiplied by the ratios going to reduction (that is, fishmeal and fish oil production) and the ratios of fish fed directly to aquaculture75,76. The amounts of potential fish by-products were estimated by multiplying the amounts of fish for human consumption from capture fisheries and aquaculture by the ratios processed75,76 and multiplying the processed quantities by the average ratio of 41.5% of fish consisting of by-products (such as trimmings)79, subtracting 2% blood that is not used in reduction and finally assuming 2% losses at the primary fish processing stage78. The share of by-products in fish varies among different fish species and even among the same species. The value applied in this study (41.5%) was estimated for salmon79 and is probably a conservative estimate for most other fish species. However, it was applied here as a proxy, to avoid an overly optimistic estimation of fish by-product availability. To account for the uncertainty inherent in applying these conversion factors, we performed a sensitivity analysis (see below). The amounts of fishmeal and fish oil that could be produced from these by-products were then estimated by using the conversion ratios of 0.2 for fishmeal and 0.04 for fish oil, values a bit lower than the conversion ratios for fishmeal and fish oil from whole fish77. Comparisons between our estimates and assessments from previous studies of food system by-product availability are available in the Supplementary Information. The production of by-products was converted to dry matter using the dry matter contents of the different feedstuffs22,80,81.
Replacement constraints
The replacement constraints estimating the share of by-products that can replace food-competing feedstuff in animal feed were derived from feed experiment studies, assuming no reductions in productivity. The only exception for this was the replacement of cereals with crop residues in cattle feeds, which reduced productivity by 40–80%. This reduced productivity was taken into account later when estimating the increased food supply.
Fishmeal and fish oil are included in livestock feeds and aquafeeds because of their protein content, favourable amino acid and fatty acid profiles, effects on growth and the immune system, and high digestibility82. However, they are not essential to pig and poultry, and here we assumed that 75–100% of the fishmeal in pig and poultry feeds is replaceable with oilseed meals, fishmeal made from fish by-products or livestock by-products of non-ruminant origin (blood meal and hydrolysed feather meal) without negatively impacting their productivity83,84 (Supplementary Table 7).
On the basis of previous alternative feed experiments for various fish species, 27–79% of the fishmeal (dry matter) and 51–79% of the fish oil in aquafeeds can be replaced with processed by-products from livestock production (Supplementary Table 7). Fishmeal and fish oil made from fish by-products differ from those produced from whole fish as they on average contain less protein and have a higher ash content85. Despite this, they provide essential fatty acids and have been successfully applied in aquafeeds85. Here we assume that they are viable alternatives and can replace 75–100% of the fishmeal and fish oil made from whole fish in aquafeeds. Distiller’s grains have also been applied in aquafeeds, but they require further processing to remove fibre and increase their protein content to be viable alternatives for fishmeal86; therefore, they were not included as fishmeal replacement for fish feed in this study.
Crop processing by-products, including cereal by-products (brans and distiller’s grains), citrus pulp and sugar by-products (sugar beet pulp and molasses), were considered here as potential replacements for cereal use, and oilseed meals as potential replacements for pulse use in livestock feed. Cereal by-products such as bran have been applied in pig feeding (Supplementary Table 8). They typically contain less starch and more fibre than whole cereals, due to endosperm removal during processing87. Although the high fibre content of these feedstuffs can produce satiety and have beneficial impacts on gut health in pig production, their inclusion is sometimes limited because of the reduced digestibility of dietary energy and protein, which can reduce the overall production performance88, including also environmental performance (e.g. waste and overall greenhouse gas emissions). Sugar beet pulp contains readily digestible fibre such as pectin, has a low lignin concentration and thus has a high energy value for ruminant nutrition89, making it a well-suited substitute for cereals20. The nutritive value of sugar beet pulp can be further improved with added molasses89. Crop residues (straws and leaves) that are high in fibre can replace part of the cereals used in ruminant feeding, but with negative impacts on productivity (Supplementary Tables 6 and 8). They are better suited for replacing conventional roughage, such as grass silage, in ruminant diets. However, the potential use of crop residues for monogastric animals such as pigs and poultry is much lower due to the limited ability of monogastrics to digest feedstuffs with high fibre concentrations and low digestibility90 (Supplementary Table 6). Oilseed meals and cakes (derived from soy and rapeseed, for example) are high-quality protein feeds with balanced amino acid composition and high nutrient digestibility for livestock80. The animal production responses of oilseed meals and cakes are typically superior or less often equal to those of pulses (for example, faba bean, pea, lupin and lentils) in diets of lactating dairy cows90,91,92, pigs50,93 and poultry94,95. The use of oilseed meals and cakes as protein feed in livestock diets is currently the prevailing practice, whereas pulses are considered as the alternative. The substitution rates of pulses with rapeseed meal and cake and soybean meal were 100% on all livestock diets according to our literature review (Supplementary Table 8). However, as literature about substitution rates of pulses with other oilseed by-products was lacking, the substitution rate of all oilseed by-products was assumed to be 75–100%, taking into account possible differences in nutritive value. For ruminants, only the mixed and feedlot production systems21 that contained cereals in their feed were considered in the replacement, since the ruminant diets in grazing systems are mainly based on forages and typically contain no or only low amounts of cereal-based concentrates.
Legislation and regulation also constrain the use of livestock by-products as feed. A comprehensive review of animal by-product regulations in all countries was out of scope for this study, so to follow a precautionary approach and avoid overly optimistic by-product availability estimates, we applied the European Union regulations globally, since they can be considered among the strictest ones. Feeding farmed animals on materials originating from the same species is forbidden43,44,45; in addition, the use of processed by-products from bovine animals is banned in livestock or aquaculture feed to avoid the spread of transmittable diseases43,44. The safety issues regarding the feed use of by-products of ruminant origin are also acknowledged in US regulations96 as well as the more broad feed use recommendations by the FAO97. Livestock by-products of bovine origin were therefore not considered as feed replacements in this study. However, livestock-derived protein of non-ruminant origin (meat and bone meal, blood meal, hydrolysed feather meal and poultry meal assessed in this study) is allowed for pig, poultry and aquaculture feeds, considering the intra-species recycling ban45.
Replacement potential
The replacement potential of cereals, fishmeal and fish oil with food system by-products and residues was estimated by considering (1) the potential availability of the replacement materials within the 19 world regions (see Supplementary Table 5 for the division of countries into subregions) and (2) the replacement constraints including the nutritional requirements of livestock and aquaculture as well as the regulation of the use of different animal-derived by-products and residues in livestock and aquaculture feeds (Supplementary Tables 6–8). Environmental performance was, however, not considered.
First, the feed use of each of the food-competing feedstuffs selected was multiplied by the replacement constraints to estimate the maximum and minimum replacement potentials for each animal production group and replacement material individually. Second, the maximum and minimum replacement potentials were corrected with the availability of the selected replacement material in the region. Third, the combined replacement potential of the different replacement materials for one animal production group was estimated by summing the individual replacement potentials and normalizing them to avoid exceeding the total feed use of the animal production group in a region. Finally, the combined potential of the different replacement materials and animal production groups were summed to derive the total replacement potential (see Supplementary Section 3 for a more detailed description of the method).
The increased food supply was estimated by multiplying the replaced food-competing feedstuff amounts by their energy (kcal), protein and fat contents63,80,81. Since fishmeal and fish oil can be produced simultaneously from the same fish, the increased food supply from replacing fishmeal and fish oil alternatives was not summed to avoid double-accounting; instead, only the one with the higher replacement potential was considered.
For the replacement of cereals in feed use, two cases were estimated: one applying only the replacement materials (cereal bran, sugar beet pulp, molasses, distiller’s grains and citrus pulp) and constraints with no estimated impact on productivity (Supplementary Table 6) and a second case adding crop residues as a potential replacement material in addition to the first case. In the latter case, the replacement with crop residues implies a 40–80% decrease in cattle meat and dairy production (Supplementary Table 6), which was then calculated with a simplified approach assuming that the reduced production would be proportional to the share of feed replaced and subtracted from the estimated increase in the food supply.
Since the selected by-products are typically low-value commodities, inter-regional trade of by-products and residues was excluded, but materials were assumed to be freely traded within each region. Oilseed meals and fishmeal are exceptions, being highly traded and valued products in the global feed markets. Here, as we did not account for inter-regional trade, the feed use of these highly traded commodities exceeds the potential production for some regions. In those regions, the replacement potential is assumed to be zero for the by-products with negative availability.
Uncertainty analysis
To assess the combined uncertainties related to the estimation of livestock and aquaculture feed use and the production of food system by-products, we performed Monte Carlo simulations for the input data. First, we searched the literature to find the most suitable ranges for each of the input parameters and variables. We then used these ranges in Monte Carlo simulations (n = 500) to perform an uncertainty analysis.
For the analysis, we generated 500 values of potential livestock and aquaculture feed use on the basis of a truncated normal distribution. We used the minimum, maximum and mean values and the standard deviation of the reported FCRs from the literature (described in the ‘Feed use material flows’ section) to derive the truncated normal distributions for the different production systems and regions.
Next, we followed a similar approach to derive the uncertainty intervals for the availability of by-products and residues. Five hundred randomly sampled values were taken from uniform distributions of different conversion factors with a coefficient of variation (CV) of 0.1. This CV was chosen because it represents the variation in the FAO technical conversion factors73 for many of the crop processing by-products. Due to the lack of more detailed data, the same distribution and CV were assumed to also represent the uncertainty in the availability of crop residues and livestock by-products. Finally, we applied the range for replacement potentials identified in the literature (Supplementary Table 6) and generated 500 values of potential replacement constraints on the basis of a uniform distribution to estimate the uncertainty related to the replacement potential (Supplementary Information).